| Param | Original file | Final file |
|---|---|---|
| Filename | modeM0/AS1A09_142T01_9000003766_26068cztM0_level2.evt | modeM0/AS1A09_142T01_9000003766_26068cztM0_level2_quad_clean.evt |
| Size (bytes) | 504,040,320 | 104,999,040 |
| Size | 480.7 MB | 100.1 MB |
| Events in quadrant A | 3,550,178 | 713,043 |
| Events in quadrant B | 3,476,242 | 716,026 |
| Events in quadrant C | 3,392,863 | 662,402 |
| Events in quadrant D | 4,421,863 | 652,240 |
| Mode M9 | |||
|---|---|---|---|
| Quadrant | BADHDUFLAG | Total packets | Discarded packets |
| A | 0 | 16 | 0 |
| B | 0 | 17 | 0 |
| C | 0 | 17 | 0 |
| D | 0 | 17 | 0 |
| Mode M0 | |||
|---|---|---|---|
| Quadrant | BADHDUFLAG | Total packets | Discarded packets |
| A | 0 | 14416 | 0 |
| B | 0 | 14208 | 0 |
| C | 0 | 13871 | 0 |
| D | 0 | 17092 | 0 |
| Quadrant | Total seconds | Saturated seconds | Saturation percentage |
|---|---|---|---|
| A | 6254 | 91 | 1.455069% |
| B | 6254 | 95 | 1.519028% |
| C | 6254 | 107 | 1.710905% |
| D | 6254 | 279 | 4.461145% |
Noise dominated data is calculated using 1-second bins in cleaned event files. If a bin has >2000 counts, and if more than 50% of those come from <1% of pixels, then it is considered to be noise-dominated and hence unusable.
| Quadrant | # 1 sec bins | Bins with >0 counts | Bins with >2000 counts | High rate bins dominated by noise | Noise dominated (total time) | Noise dominated (detector-on time) | Marked lightcurve |
|---|---|---|---|---|---|---|---|
| A | 7579 | 6254 | 0 | 0 | 0.00% | 0.00% | 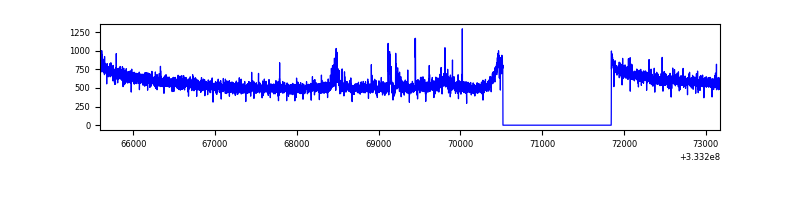 |
| B | 7579 | 6254 | 1 | 1 | 0.01% | 0.02% | 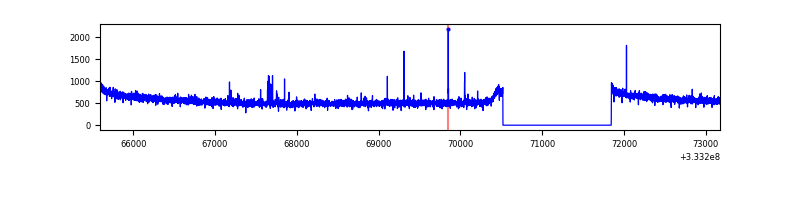 |
| C | 7579 | 6254 | 3 | 3 | 0.04% | 0.05% | 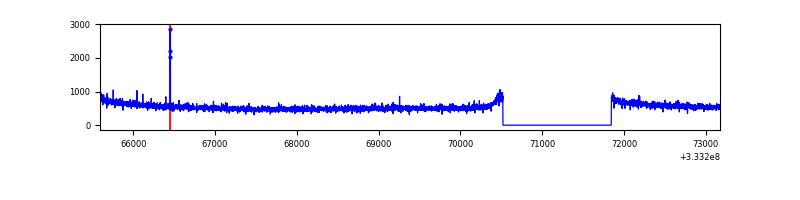 |
| D | 7579 | 6254 | 233 | 233 | 3.07% | 3.73% | 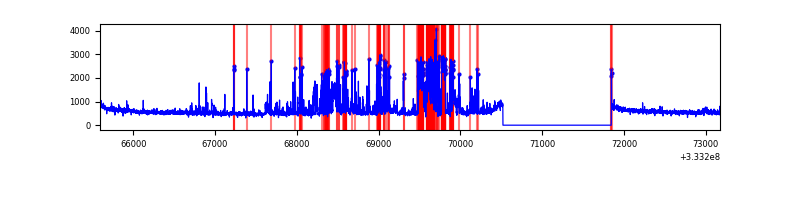 |
Top three noisy pixels from each quadrant. If the there are fewer than three noisy pixels in the level2.evt file, extra rows are filled as -1
| Pixel properties | Quadrant properties | ||||||
|---|---|---|---|---|---|---|---|
| Quadrant | DetID | PixID | Counts | Sigma | Mean | Median | Sigma |
| A | 6 | 16 | 75590 | 423.35 | 901 | 886 | 176.5 |
| A | 13 | 254 | 10513 | 54.56 | 901 | 886 | 176.5 |
| A | 0 | 226 | 7779 | 39.06 | 901 | 886 | 176.5 |
| B | 0 | 190 | 22863 | 135.64 | 882 | 863 | 162.2 |
| B | 12 | 111 | 18544 | 109.01 | 882 | 863 | 162.2 |
| B | 11 | 111 | 16789 | 98.19 | 882 | 863 | 162.2 |
| C | 14 | 238 | 136826 | 714.27 | 831 | 837 | 190.4 |
| C | 2 | 16 | 13300 | 65.46 | 831 | 837 | 190.4 |
| C | 13 | 61 | 5861 | 26.39 | 831 | 837 | 190.4 |
| D | 1 | 52 | 1186357 | 5639.03 | 845 | 826 | 210.2 |
| D | 2 | 234 | 22732 | 104.2 | 845 | 826 | 210.2 |
| D | 8 | 195 | 17343 | 78.56 | 845 | 826 | 210.2 |
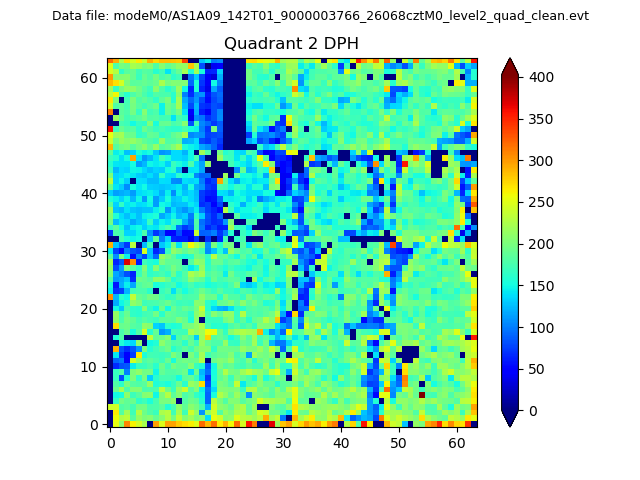
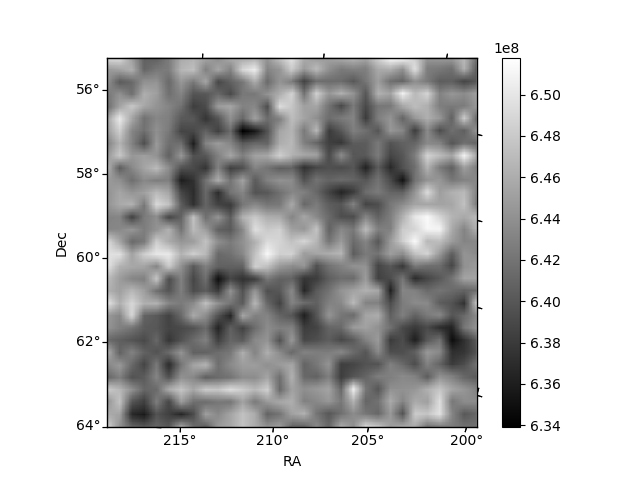
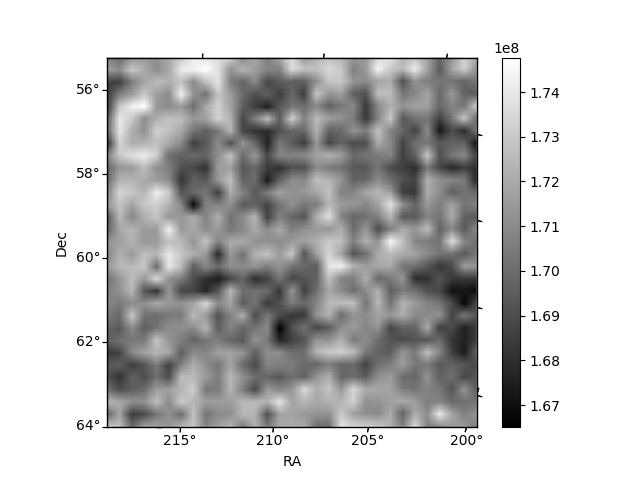
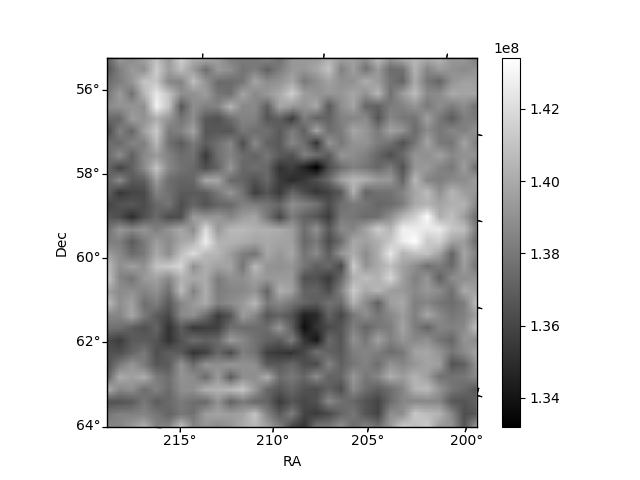
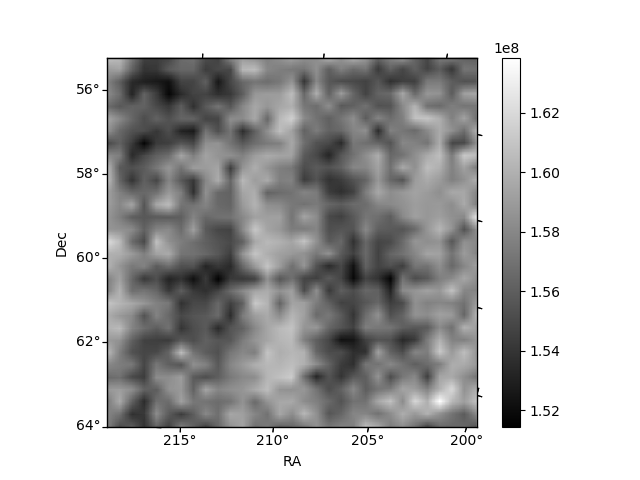
Histogram calculated using DETX and DETY for each event in the final _common_clean file
| Quadrant A | 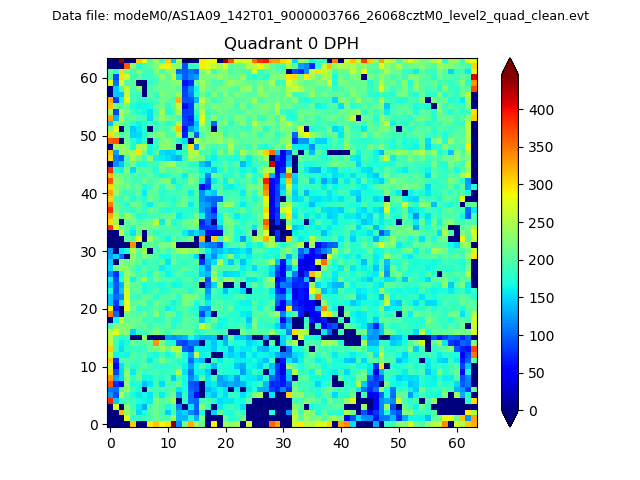 |
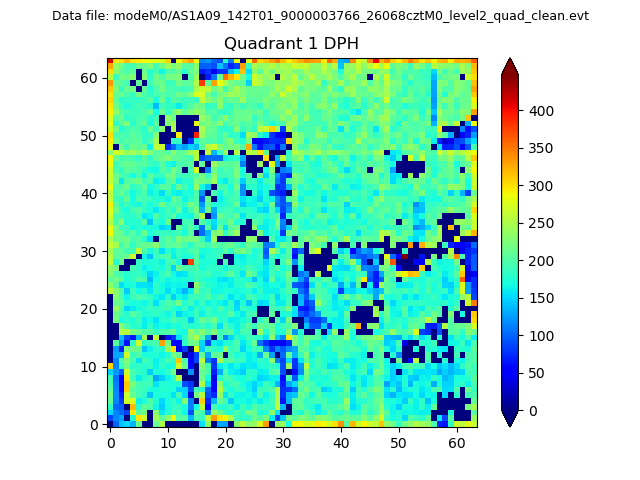 |
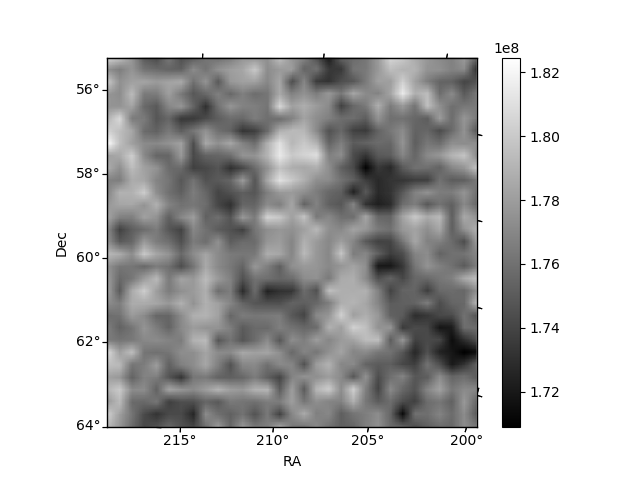
Quadrant B |
|---|---|---|---|
| Quadrant D | 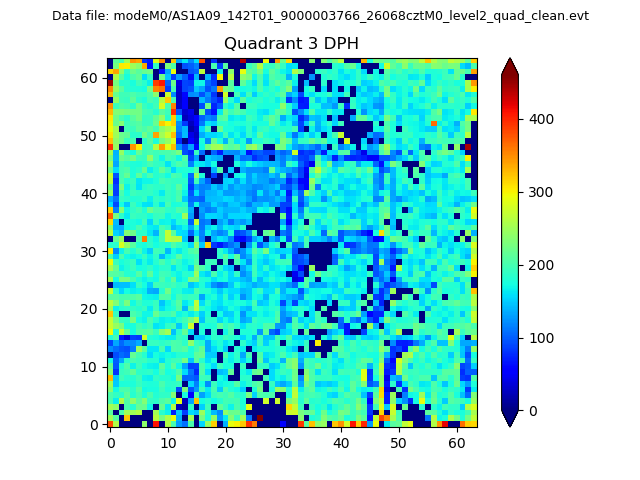 |
 |
Quadrant C |
| Plot type | Count rate plots | Images |
|---|---|---|
| Comparison with Poisson distribution Blue bars denote a histogram of data divided into 1 sec bins. Red curve is a Poisson curve with rate = median count rate of data. |
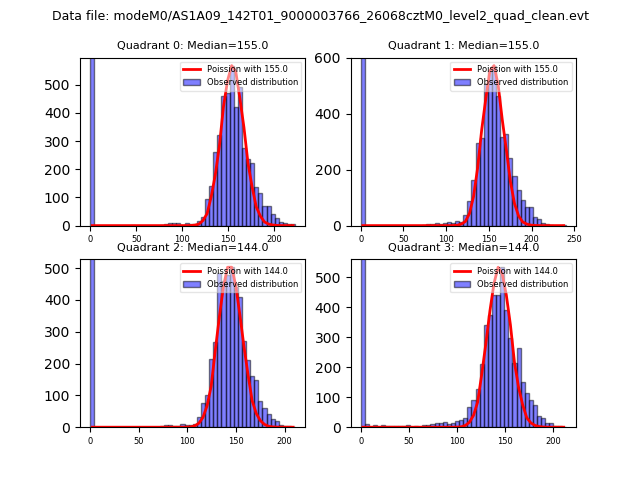 |
 |
| Quadrant-wise count rates Data is divided into 100 sec bins |
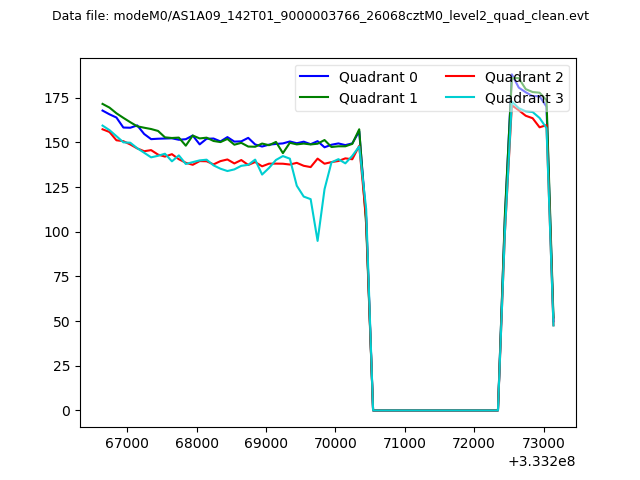 |
|
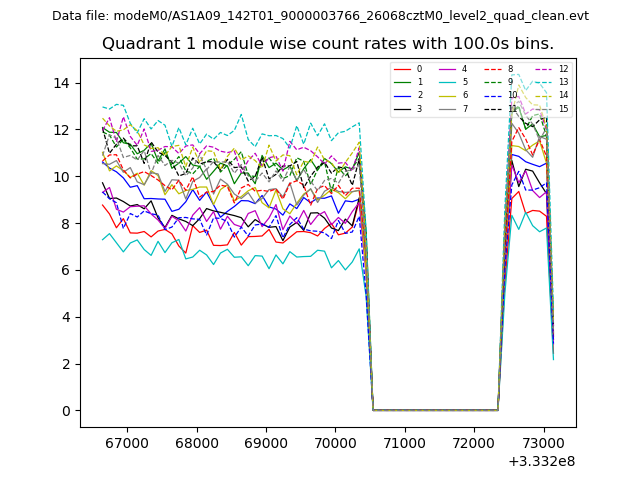
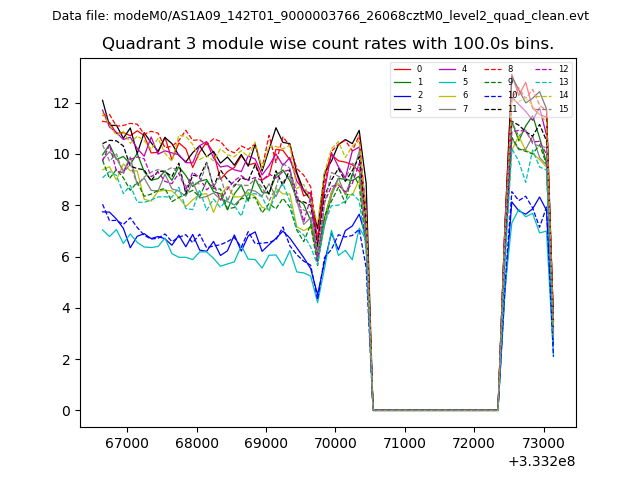
| Module-wise count rates for Quadrant A Data is divided into 100 sec bins |
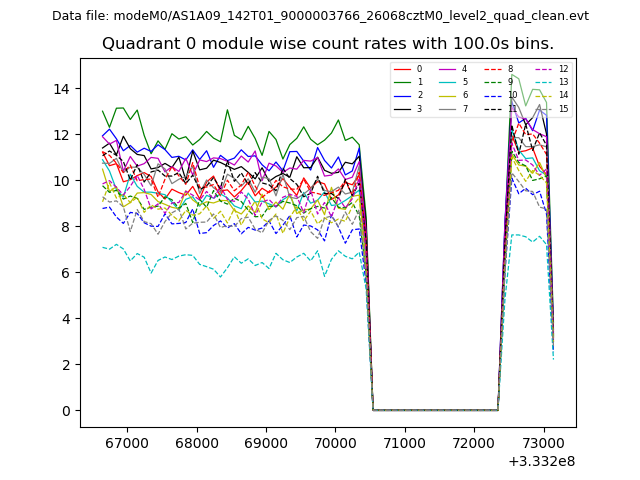 |
 |
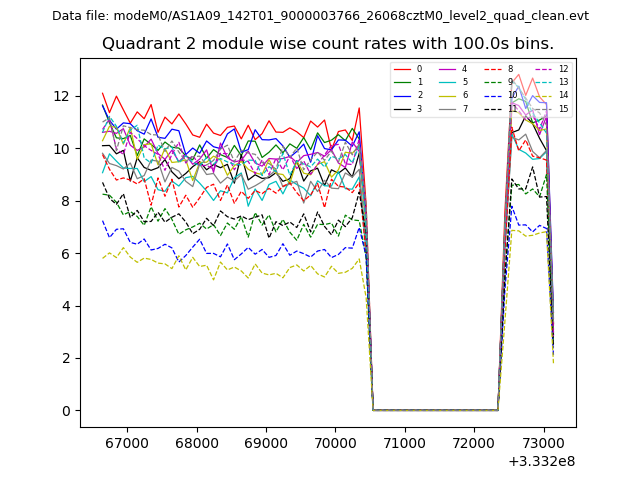
| Module-wise count rates for Quadrant B Data is divided into 100 sec bins |
 |
 |
| Module-wise count rates for Quadrant C Data is divided into 100 sec bins |
 |
 |
| Module-wise count rates for Quadrant D Data is divided into 100 sec bins |
 |
 |
| Parameter | Plot |
|---|---|
| CZT HV Monitor | 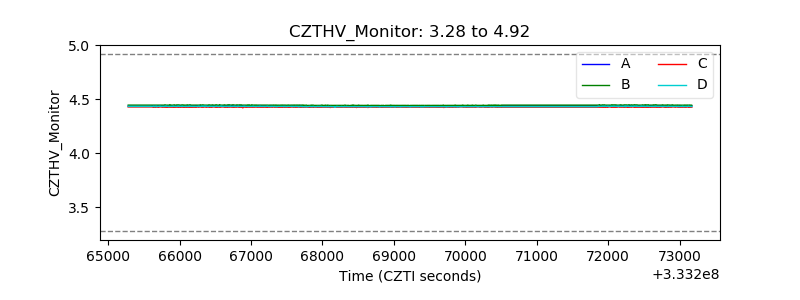 |
| D_VDD | 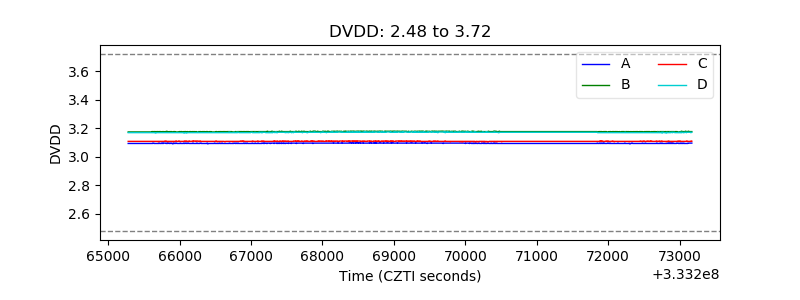 |
| Temperature 1 | 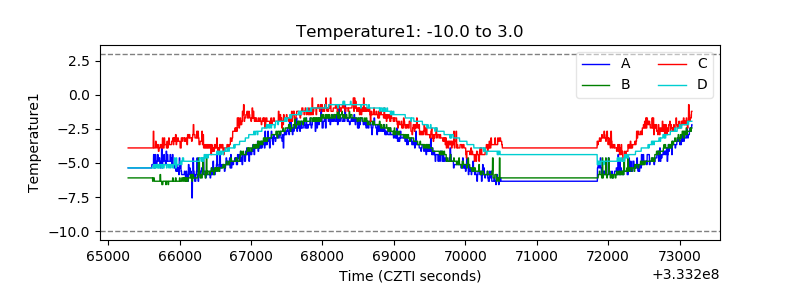 |
| Veto HV Monitor | 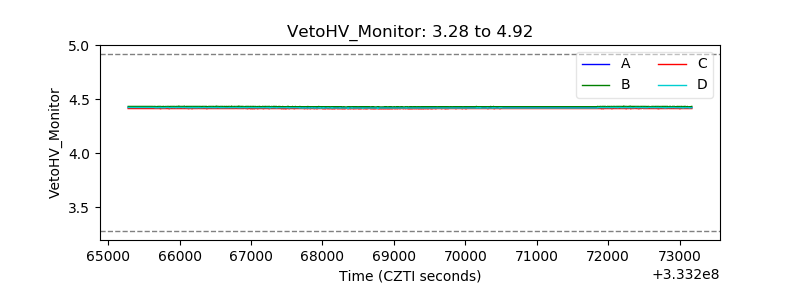 |
| Veto LLD | 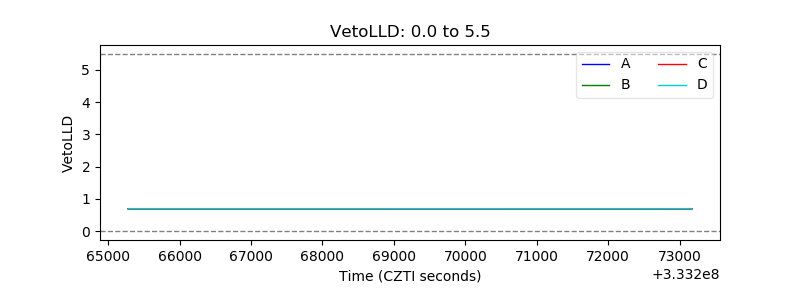 |
| Alpha Counter |  |
| _CPM_Rate | 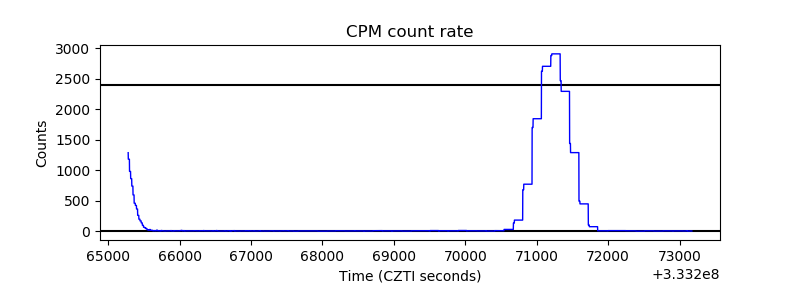 |
| CZT Counter | 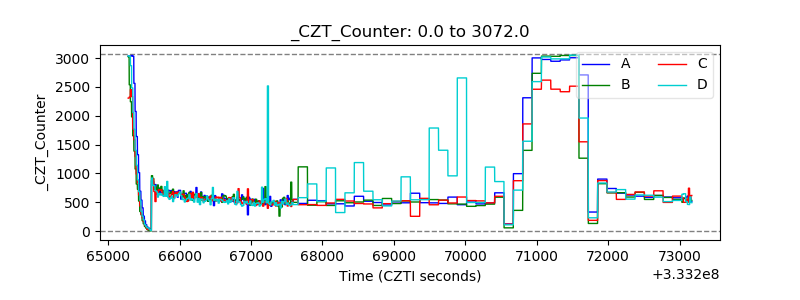 |
| +2.5 Volts monitor | 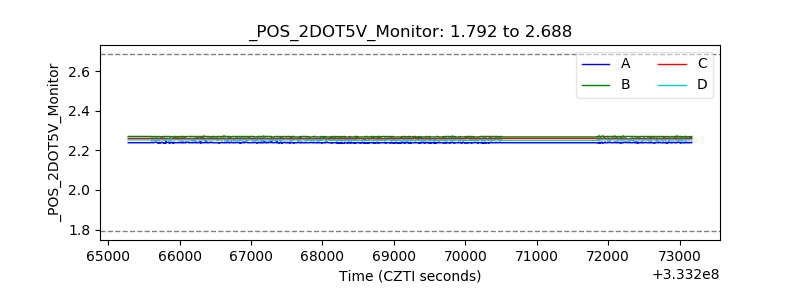 |
| +5 Volts monitor |  |
| _ROLL_ROT | 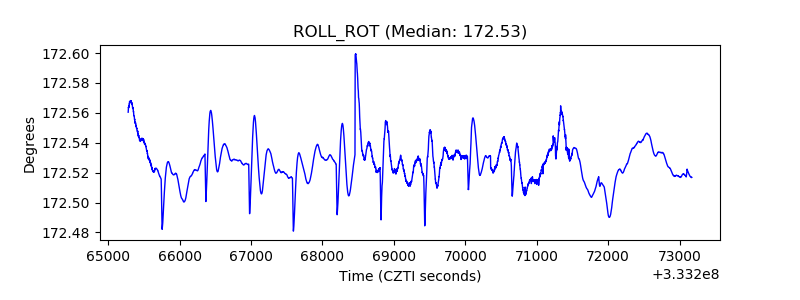 |
| _Roll_DEC | 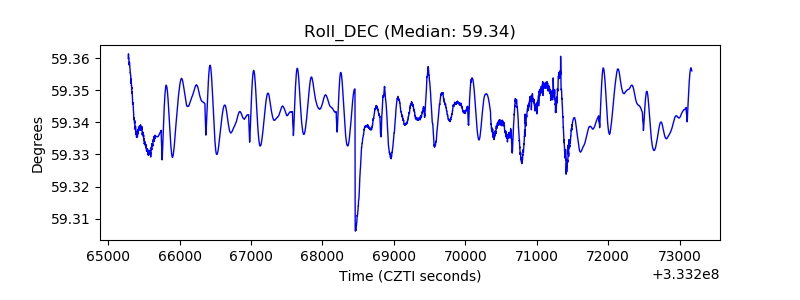 |
| _Roll_RA | 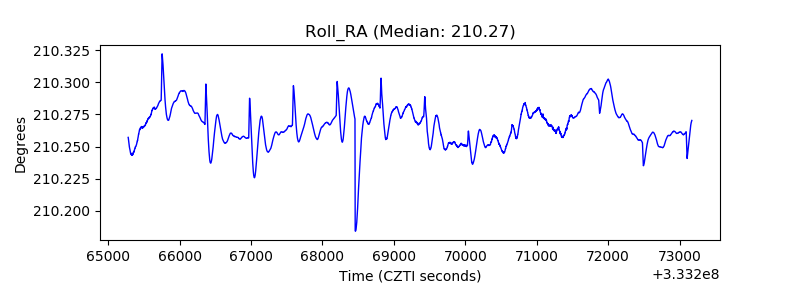 |
| Veto Counter | 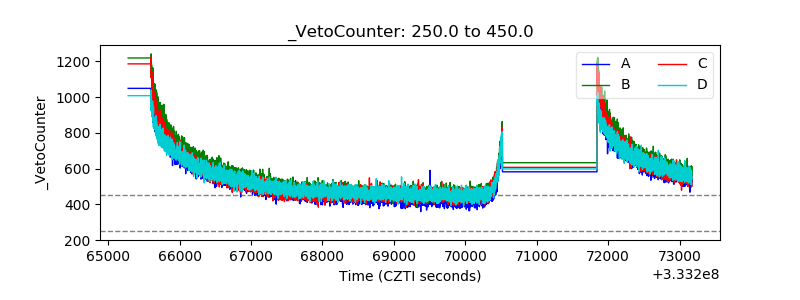 |