| Param | Original file | Final file |
|---|---|---|
| Filename | modeM0/AS1A09_142T01_9000003766_26070cztM0_level2.evt | modeM0/AS1A09_142T01_9000003766_26070cztM0_level2_quad_clean.evt |
| Size (bytes) | 456,154,560 | 124,202,880 |
| Size | 435.0 MB | 118.4 MB |
| Events in quadrant A | 3,316,863 | 857,768 |
| Events in quadrant B | 3,391,964 | 857,386 |
| Events in quadrant C | 3,244,869 | 799,229 |
| Events in quadrant D | 3,438,942 | 813,828 |
| Mode M9 | |||
|---|---|---|---|
| Quadrant | BADHDUFLAG | Total packets | Discarded packets |
| A | 0 | 13 | 0 |
| B | 0 | 13 | 0 |
| C | 0 | 13 | 0 |
| D | 0 | 13 | 0 |
| Mode M0 | |||
|---|---|---|---|
| Quadrant | BADHDUFLAG | Total packets | Discarded packets |
| A | 0 | 13629 | 0 |
| B | 0 | 13811 | 0 |
| C | 0 | 13273 | 0 |
| D | 0 | 13906 | 0 |
| Quadrant | Total seconds | Saturated seconds | Saturation percentage |
|---|---|---|---|
| A | 6215 | 111 | 1.786002% |
| B | 6215 | 118 | 1.898632% |
| C | 6216 | 126 | 2.027027% |
| D | 6215 | 97 | 1.560740% |
Noise dominated data is calculated using 1-second bins in cleaned event files. If a bin has >2000 counts, and if more than 50% of those come from <1% of pixels, then it is considered to be noise-dominated and hence unusable.
| Quadrant | # 1 sec bins | Bins with >0 counts | Bins with >2000 counts | High rate bins dominated by noise | Noise dominated (total time) | Noise dominated (detector-on time) | Marked lightcurve |
|---|---|---|---|---|---|---|---|
| A | 7545 | 6215 | 0 | 0 | 0.00% | 0.00% | 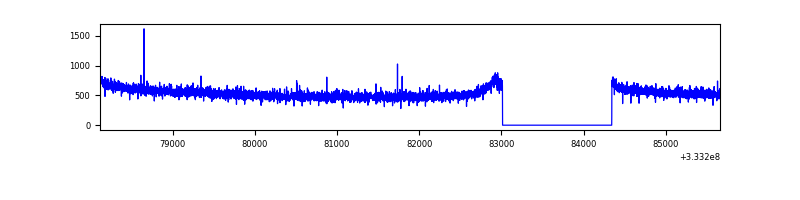 |
| B | 7545 | 6215 | 0 | 0 | 0.00% | 0.00% | 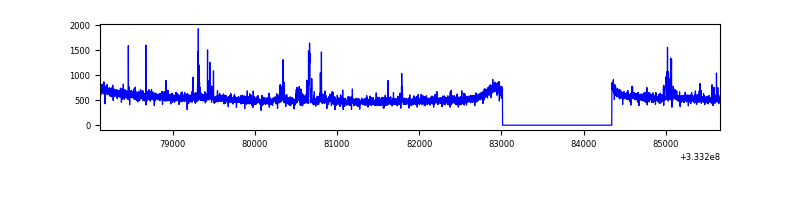 |
| C | 7546 | 6216 | 0 | 0 | 0.00% | 0.00% | 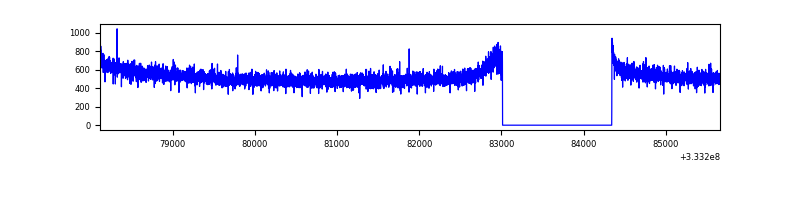 |
| D | 7545 | 6215 | 12 | 12 | 0.16% | 0.19% | 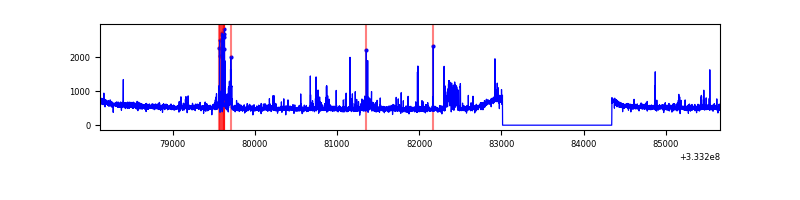 |
Top three noisy pixels from each quadrant. If the there are fewer than three noisy pixels in the level2.evt file, extra rows are filled as -1
| Pixel properties | Quadrant properties | ||||||
|---|---|---|---|---|---|---|---|
| Quadrant | DetID | PixID | Counts | Sigma | Mean | Median | Sigma |
| A | 13 | 254 | 11991 | 66.46 | 857 | 842 | 167.8 |
| A | 0 | 226 | 7584 | 40.19 | 857 | 842 | 167.8 |
| A | 6 | 16 | 7404 | 39.11 | 857 | 842 | 167.8 |
| B | 5 | 172 | 57885 | 364.56 | 837 | 820 | 156.5 |
| B | 0 | 190 | 50162 | 315.23 | 837 | 820 | 156.5 |
| B | 12 | 111 | 17768 | 108.27 | 837 | 820 | 156.5 |
| C | 14 | 238 | 131666 | 718.84 | 796 | 802 | 182.0 |
| C | 13 | 61 | 5600 | 26.35 | 796 | 802 | 182.0 |
| C | 1 | 16 | 4232 | 18.84 | 796 | 802 | 182.0 |
| D | 1 | 52 | 154813 | 760.25 | 827 | 807 | 202.6 |
| D | 12 | 233 | 89837 | 439.5 | 827 | 807 | 202.6 |
| D | 8 | 195 | 34338 | 165.53 | 827 | 807 | 202.6 |
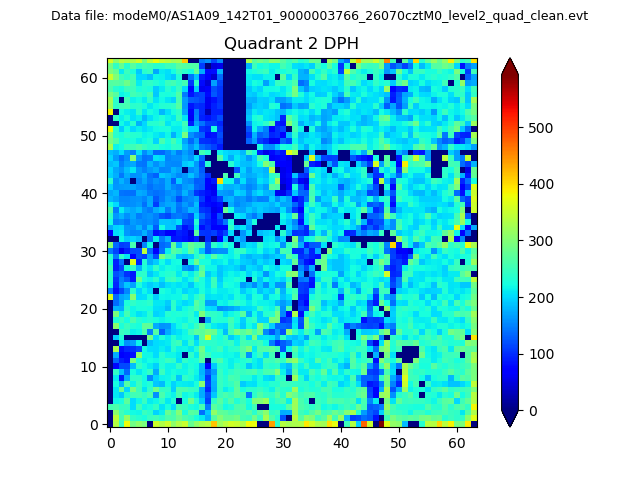
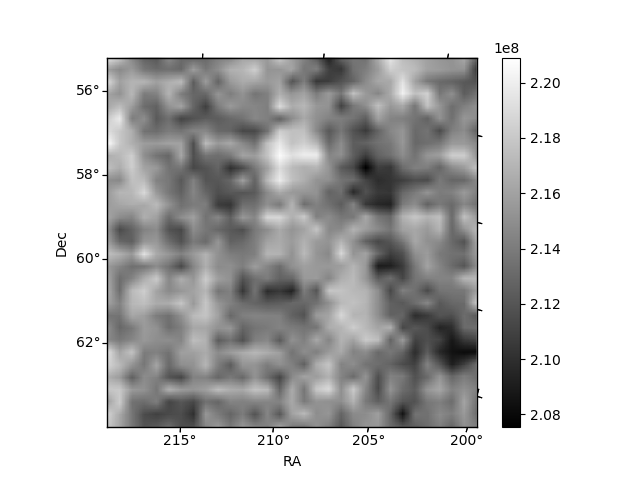
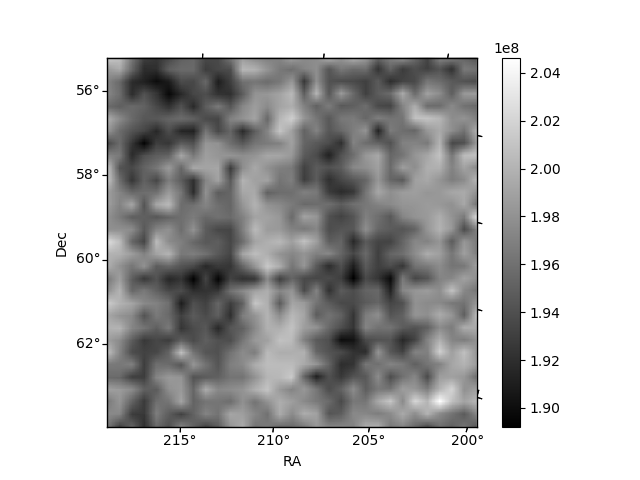
Histogram calculated using DETX and DETY for each event in the final _common_clean file
| Quadrant A | 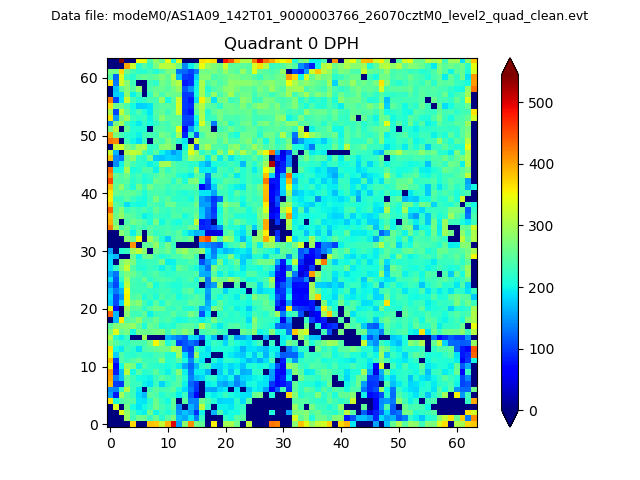 |
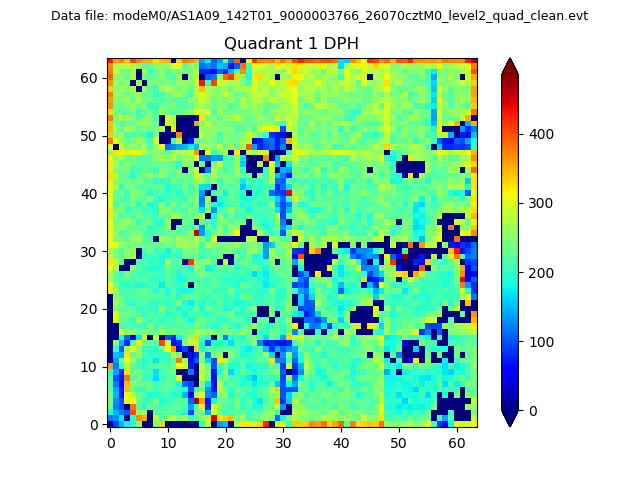 |
Quadrant B |
|---|---|---|---|
| Quadrant D | 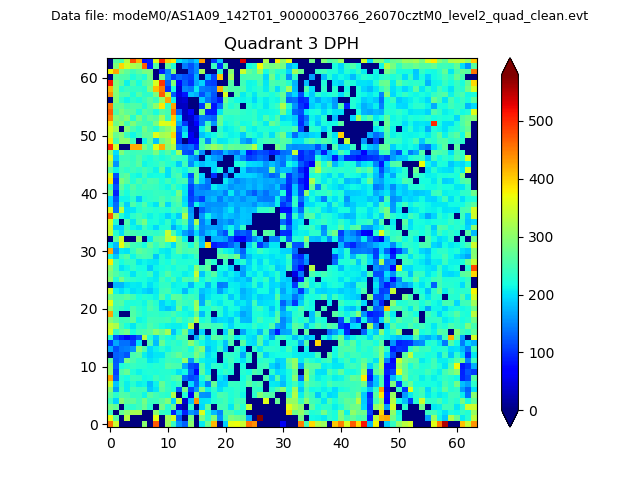 |
 |
Quadrant C |
| Plot type | Count rate plots | Images |
|---|---|---|
| Comparison with Poisson distribution Blue bars denote a histogram of data divided into 1 sec bins. Red curve is a Poisson curve with rate = median count rate of data. |
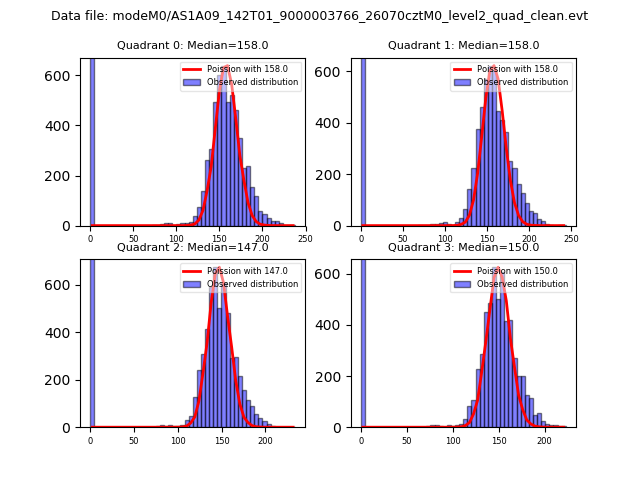 |
 |
| Quadrant-wise count rates Data is divided into 100 sec bins |
 |
|
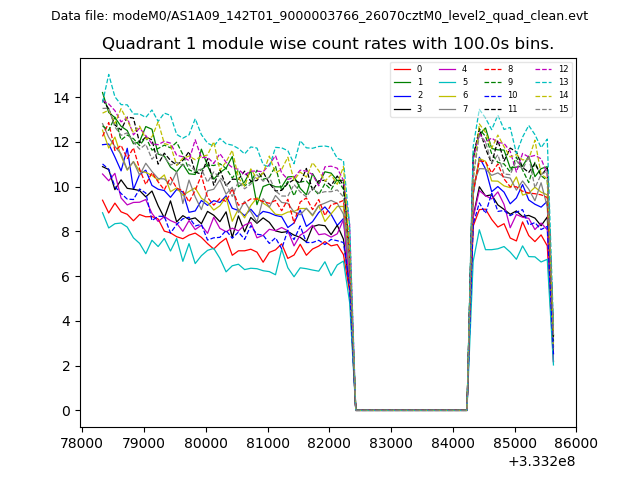
| Module-wise count rates for Quadrant A Data is divided into 100 sec bins |
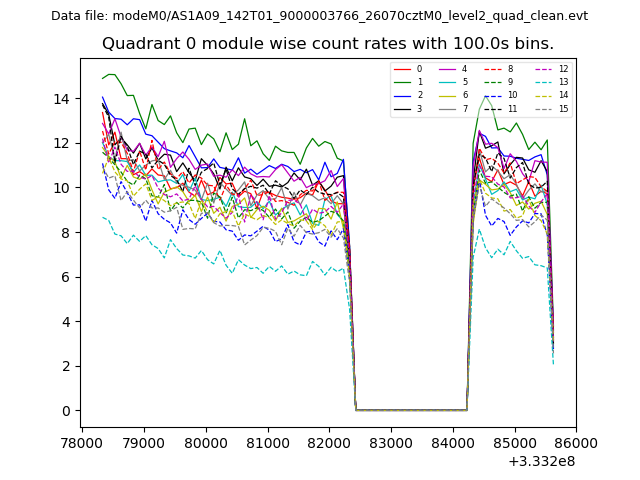 |
 |
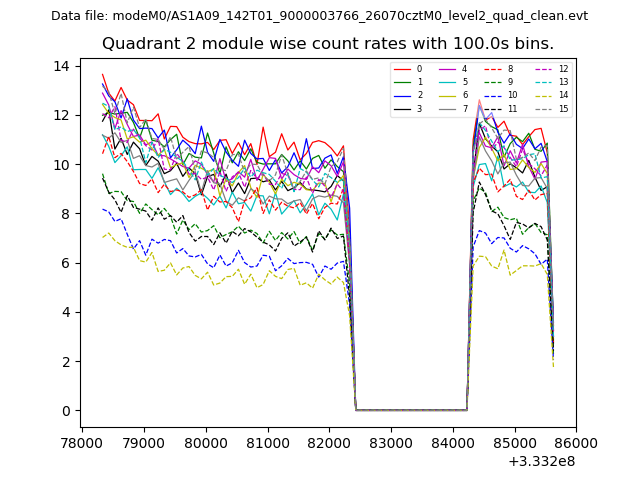
| Module-wise count rates for Quadrant B Data is divided into 100 sec bins |
 |
 |
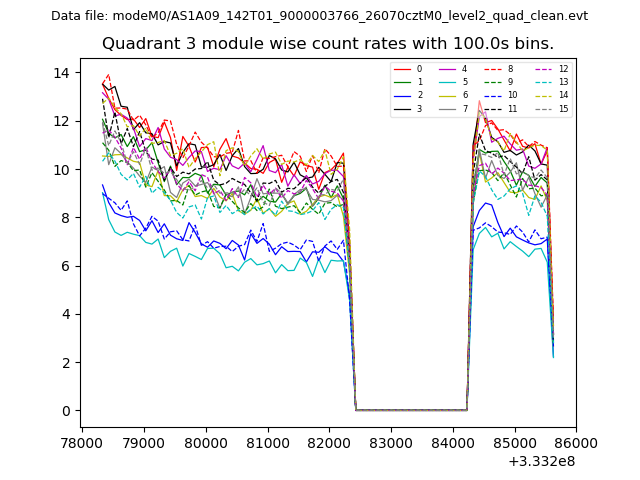
| Module-wise count rates for Quadrant C Data is divided into 100 sec bins |
 |
 |
| Module-wise count rates for Quadrant D Data is divided into 100 sec bins |
 |
 |
| Parameter | Plot |
|---|---|
| CZT HV Monitor | 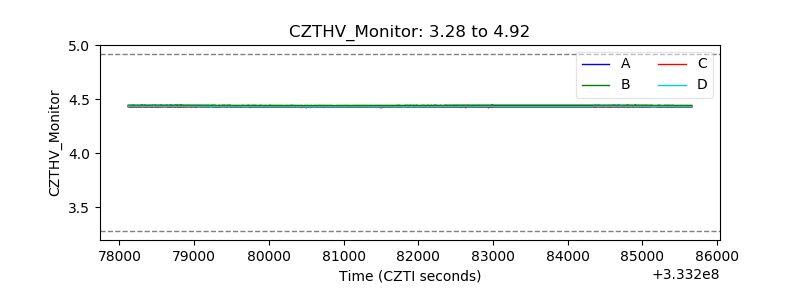 |
| D_VDD | 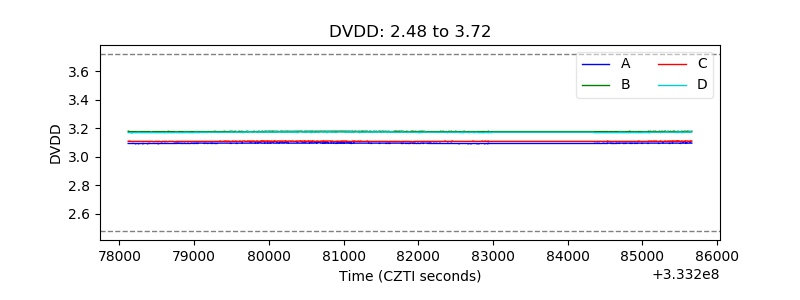 |
| Temperature 1 | 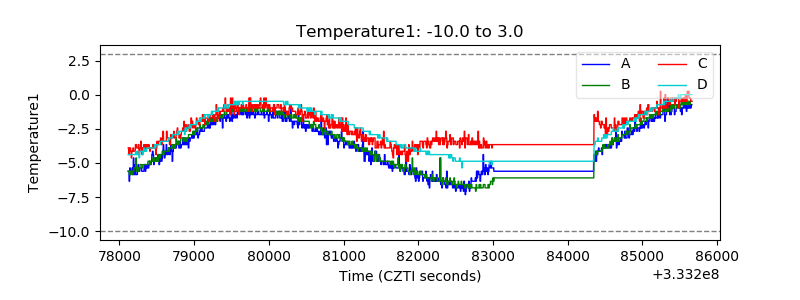 |
| Veto HV Monitor | 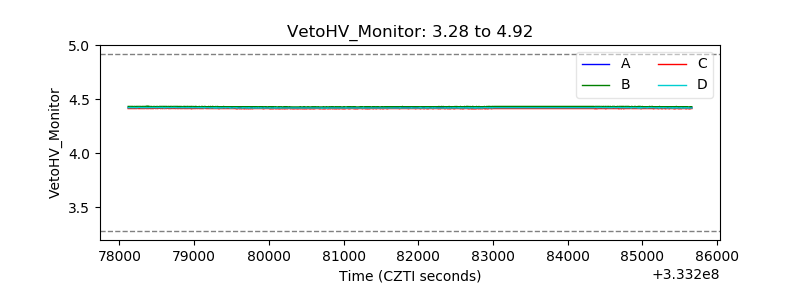 |
| Veto LLD | 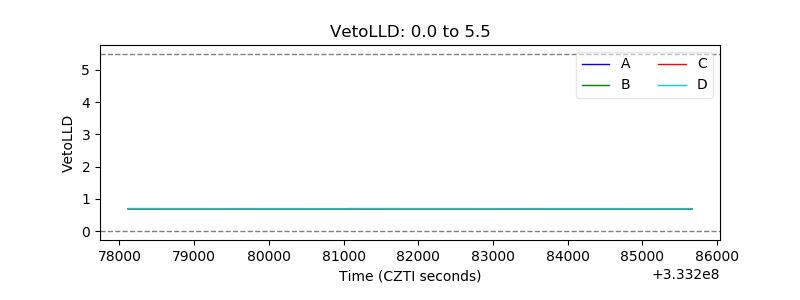 |
| Alpha Counter | 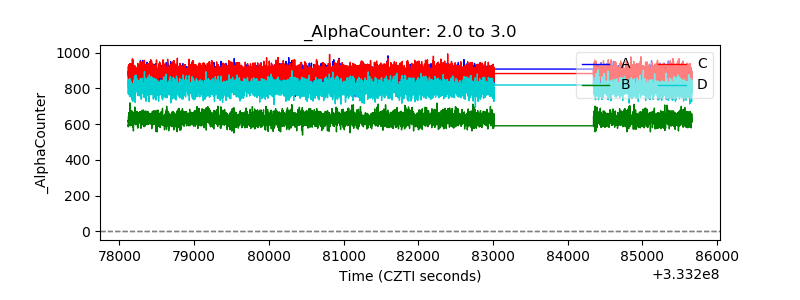 |
| _CPM_Rate |  |
| CZT Counter | 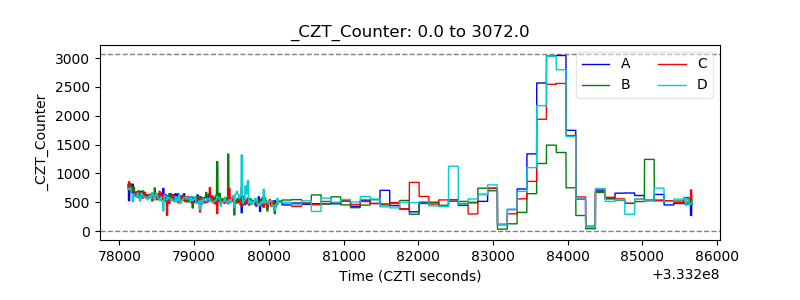 |
| +2.5 Volts monitor | 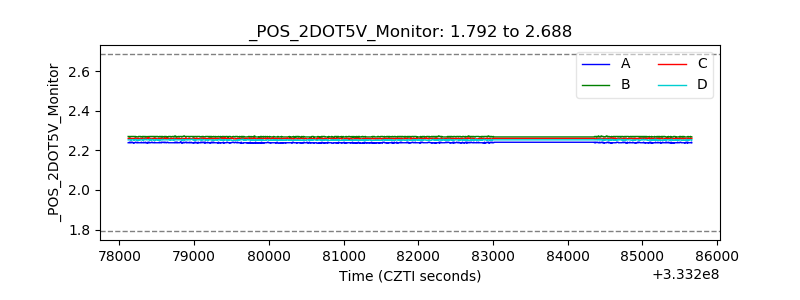 |
| +5 Volts monitor |  |
| _ROLL_ROT | 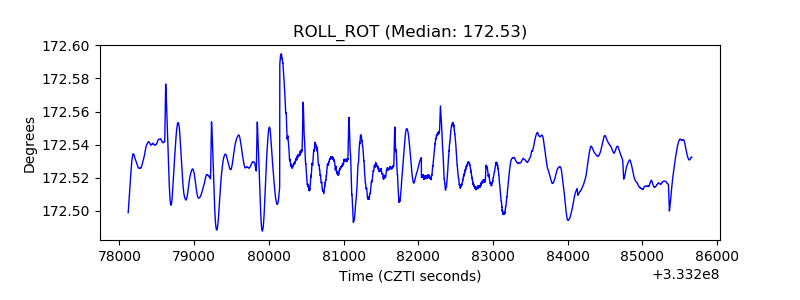 |
| _Roll_DEC | 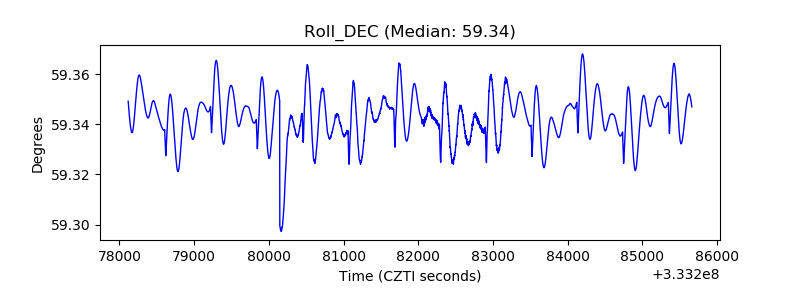 |
| _Roll_RA | 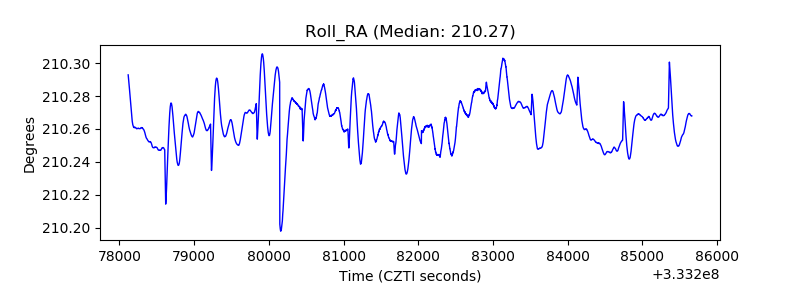 |
| Veto Counter | 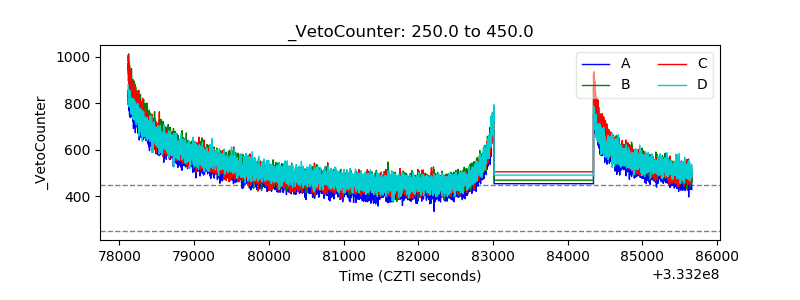 |