| Param | Original file | Final file |
|---|---|---|
| Filename | modeM0/AS1A09_142T01_9000003766_26071cztM0_level2.evt | modeM0/AS1A09_142T01_9000003766_26071cztM0_level2_quad_clean.evt |
| Size (bytes) | 483,425,280 | 119,062,080 |
| Size | 461.0 MB | 113.5 MB |
| Events in quadrant A | 3,366,558 | 809,319 |
| Events in quadrant B | 3,575,974 | 801,003 |
| Events in quadrant C | 3,363,751 | 759,663 |
| Events in quadrant D | 3,877,411 | 767,128 |
| Mode M9 | |||
|---|---|---|---|
| Quadrant | BADHDUFLAG | Total packets | Discarded packets |
| A | 0 | 10 | 0 |
| B | 0 | 10 | 0 |
| C | 0 | 10 | 0 |
| D | 0 | 10 | 0 |
| Mode M0 | |||
|---|---|---|---|
| Quadrant | BADHDUFLAG | Total packets | Discarded packets |
| A | 0 | 14020 | 0 |
| B | 0 | 14644 | 0 |
| C | 0 | 13948 | 0 |
| D | 0 | 15568 | 0 |
| Quadrant | Total seconds | Saturated seconds | Saturation percentage |
|---|---|---|---|
| A | 6723 | 95 | 1.413060% |
| B | 6723 | 119 | 1.770043% |
| C | 6723 | 111 | 1.651049% |
| D | 6723 | 128 | 1.903912% |
Noise dominated data is calculated using 1-second bins in cleaned event files. If a bin has >2000 counts, and if more than 50% of those come from <1% of pixels, then it is considered to be noise-dominated and hence unusable.
| Quadrant | # 1 sec bins | Bins with >0 counts | Bins with >2000 counts | High rate bins dominated by noise | Noise dominated (total time) | Noise dominated (detector-on time) | Marked lightcurve |
|---|---|---|---|---|---|---|---|
| A | 7803 | 6723 | 0 | 0 | 0.00% | 0.00% | 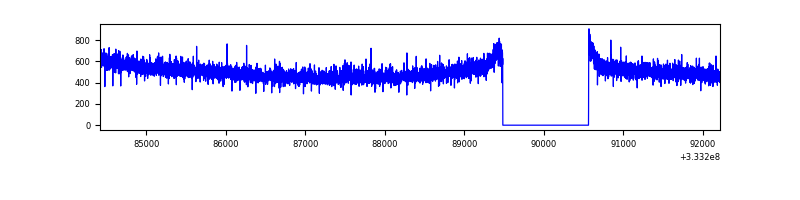 |
| B | 7803 | 6723 | 26 | 26 | 0.33% | 0.39% | 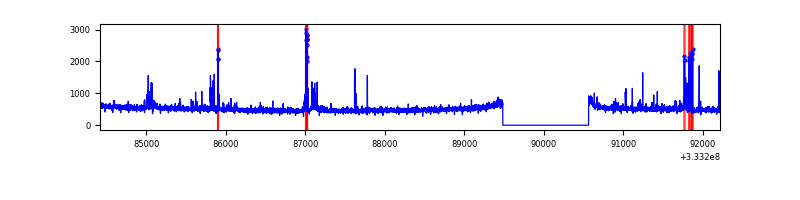 |
| C | 7803 | 6723 | 1 | 1 | 0.01% | 0.01% | 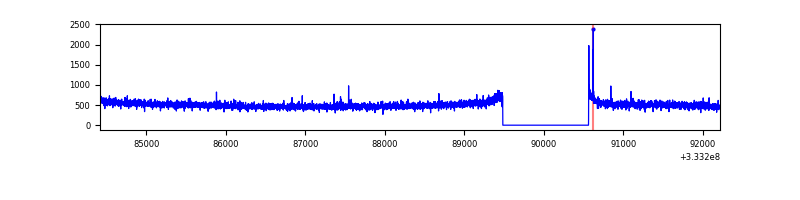 |
| D | 7803 | 6723 | 55 | 55 | 0.70% | 0.82% | 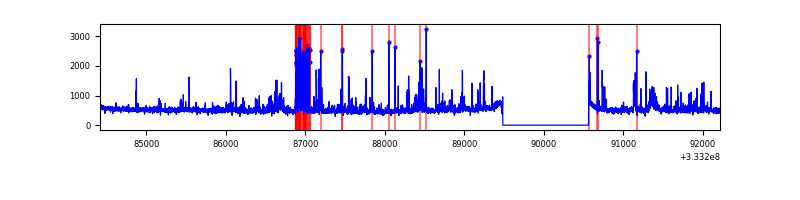 |
Top three noisy pixels from each quadrant. If the there are fewer than three noisy pixels in the level2.evt file, extra rows are filled as -1
| Pixel properties | Quadrant properties | ||||||
|---|---|---|---|---|---|---|---|
| Quadrant | DetID | PixID | Counts | Sigma | Mean | Median | Sigma |
| A | 13 | 254 | 13379 | 72.9 | 870 | 853 | 171.8 |
| A | 0 | 226 | 7735 | 40.05 | 870 | 853 | 171.8 |
| A | 3 | 137 | 7347 | 37.79 | 870 | 853 | 171.8 |
| B | 5 | 172 | 152221 | 956.18 | 850 | 834 | 158.3 |
| B | 0 | 190 | 71939 | 449.11 | 850 | 834 | 158.3 |
| B | 12 | 111 | 18278 | 110.18 | 850 | 834 | 158.3 |
| C | 14 | 238 | 133213 | 701.65 | 819 | 825 | 188.7 |
| C | 3 | 233 | 16145 | 81.2 | 819 | 825 | 188.7 |
| C | 2 | 16 | 12916 | 64.08 | 819 | 825 | 188.7 |
| D | 1 | 52 | 424876 | 1976.53 | 842 | 821 | 214.5 |
| D | 12 | 233 | 96724 | 447.01 | 842 | 821 | 214.5 |
| D | 8 | 195 | 45938 | 210.29 | 842 | 821 | 214.5 |
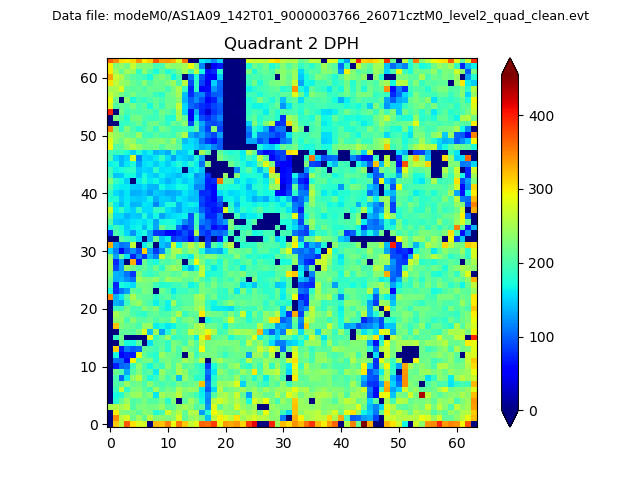
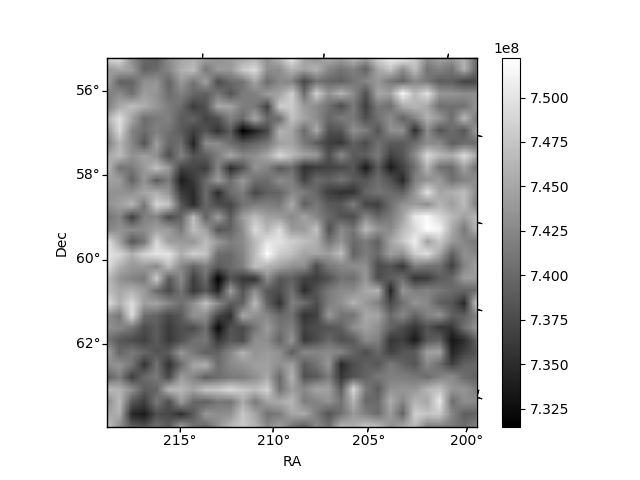
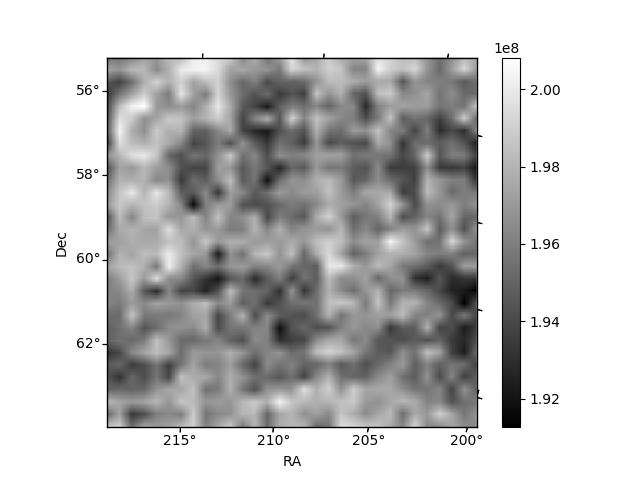
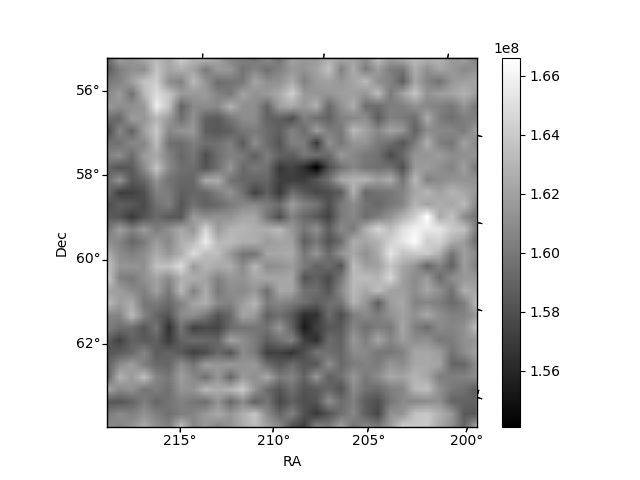
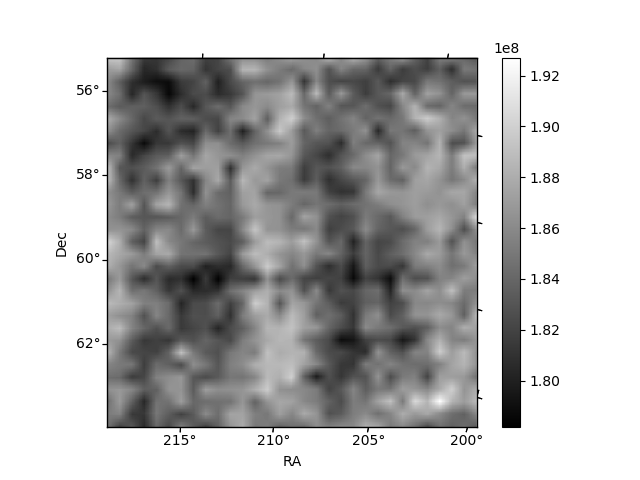
Histogram calculated using DETX and DETY for each event in the final _common_clean file
| Quadrant A | 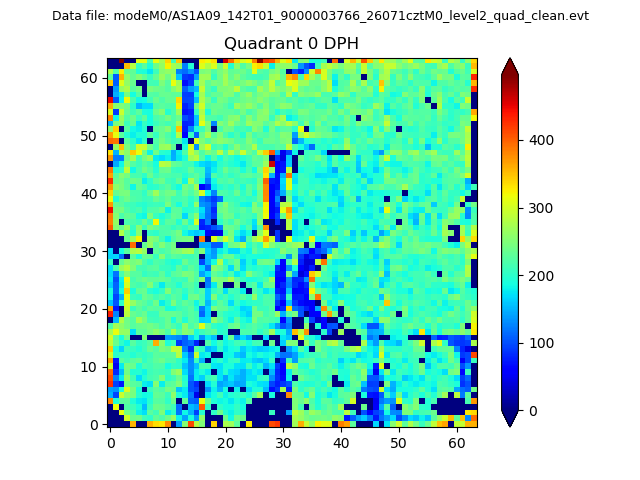 |
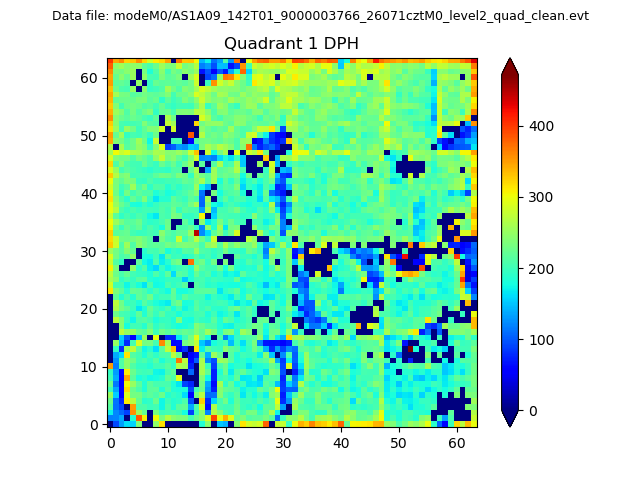 |
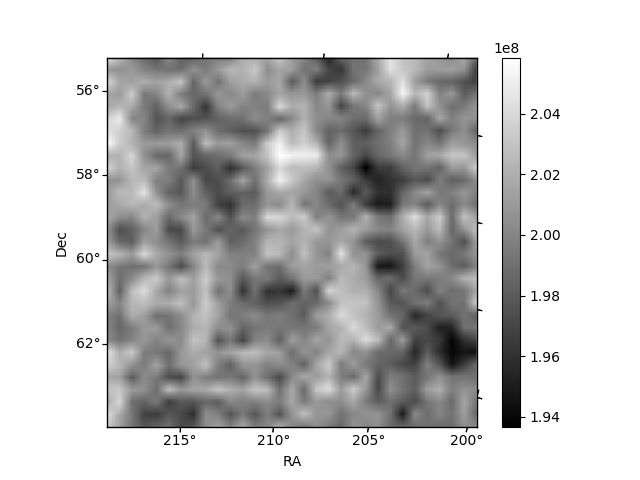
Quadrant B |
|---|---|---|---|
| Quadrant D | 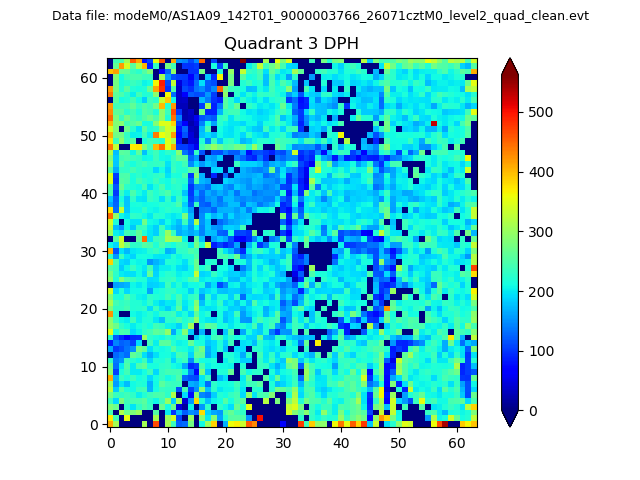 |
 |
Quadrant C |
| Plot type | Count rate plots | Images |
|---|---|---|
| Comparison with Poisson distribution Blue bars denote a histogram of data divided into 1 sec bins. Red curve is a Poisson curve with rate = median count rate of data. |
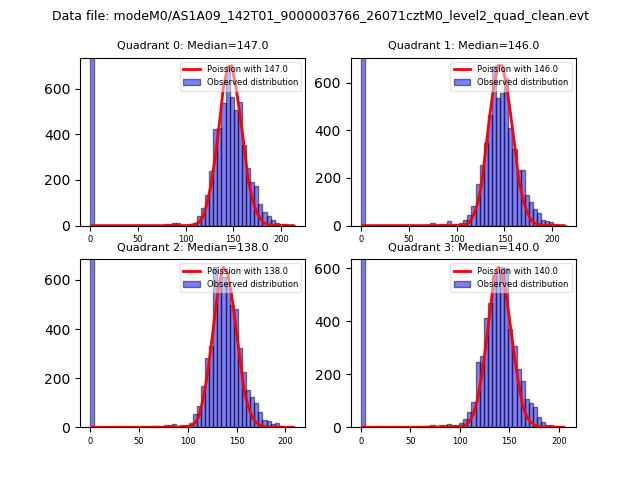 |
 |
| Quadrant-wise count rates Data is divided into 100 sec bins |
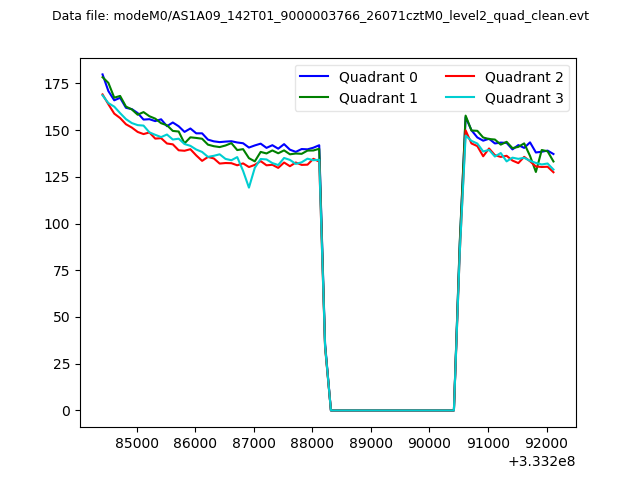 |
|
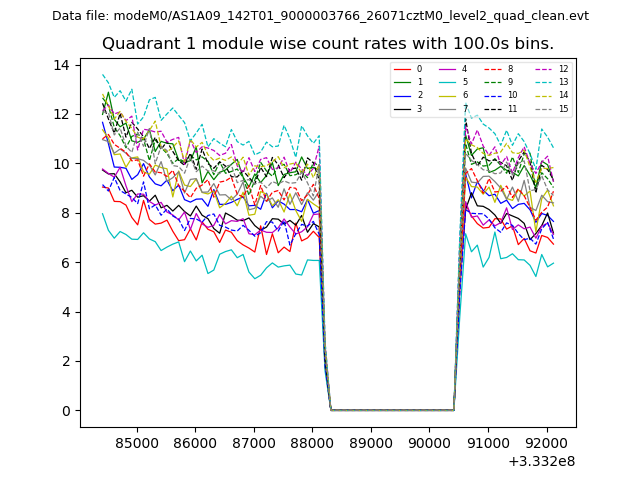
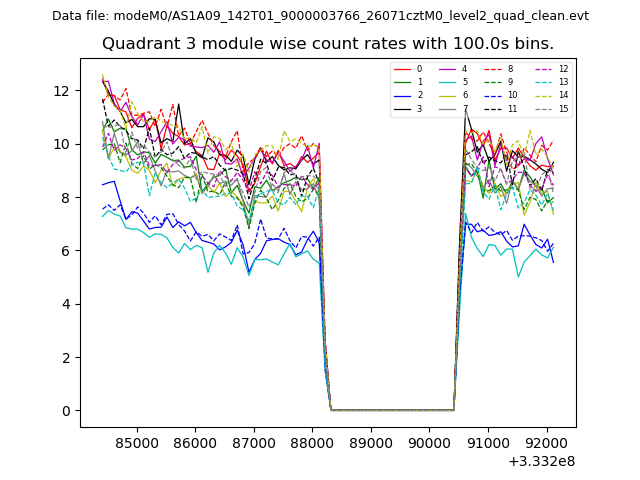
| Module-wise count rates for Quadrant A Data is divided into 100 sec bins |
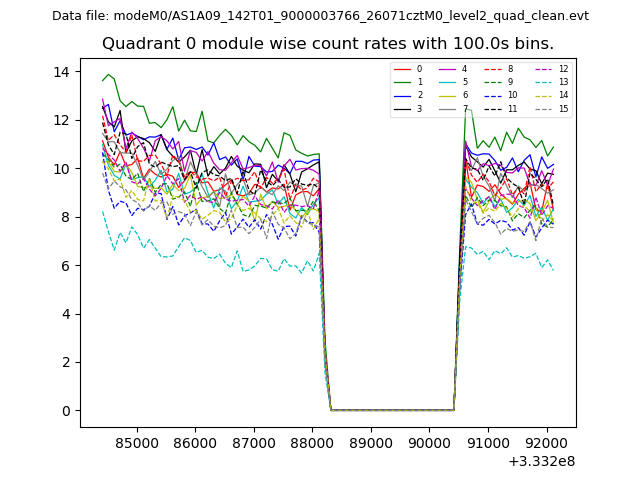 |
 |
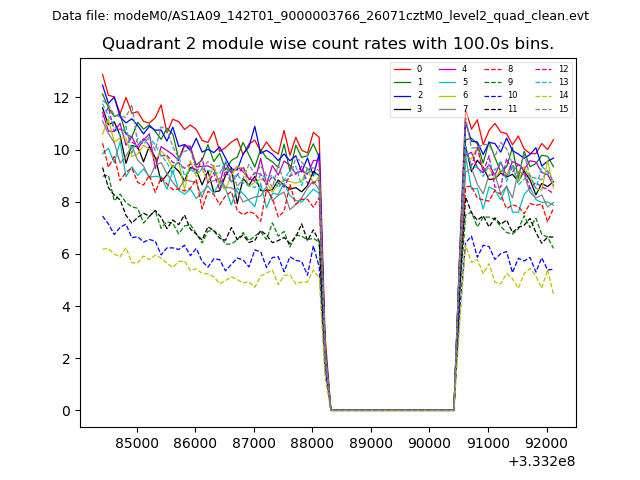
| Module-wise count rates for Quadrant B Data is divided into 100 sec bins |
 |
 |
| Module-wise count rates for Quadrant C Data is divided into 100 sec bins |
 |
 |
| Module-wise count rates for Quadrant D Data is divided into 100 sec bins |
 |
 |
| Parameter | Plot |
|---|---|
| CZT HV Monitor | 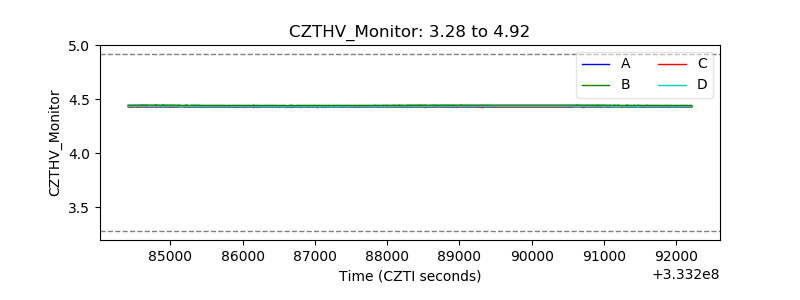 |
| D_VDD | 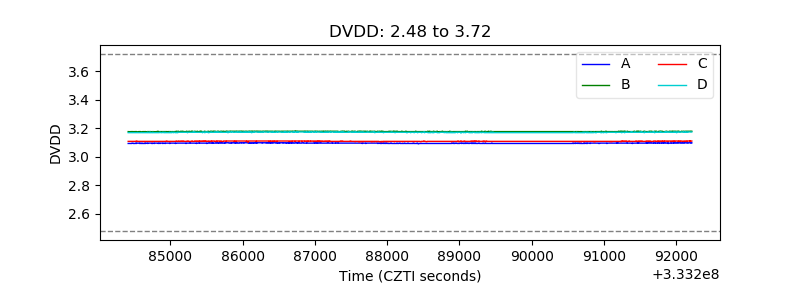 |
| Temperature 1 | 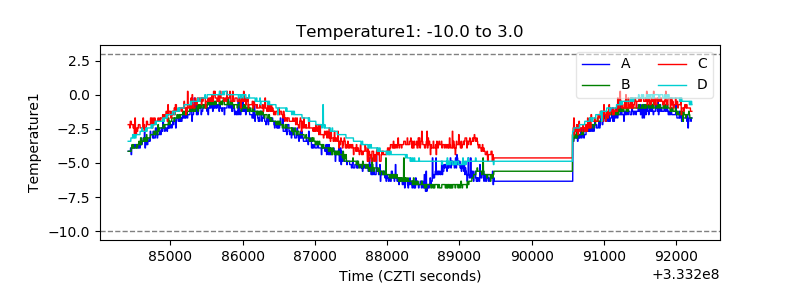 |
| Veto HV Monitor | 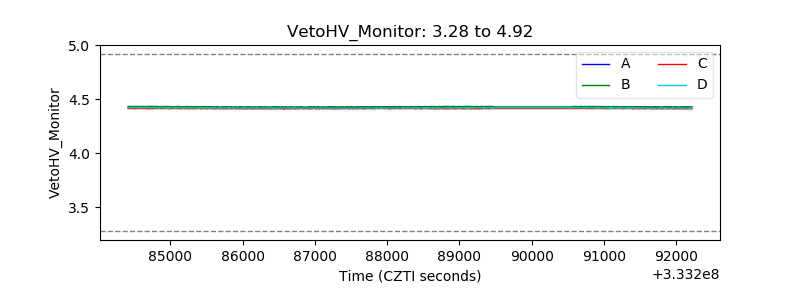 |
| Veto LLD | 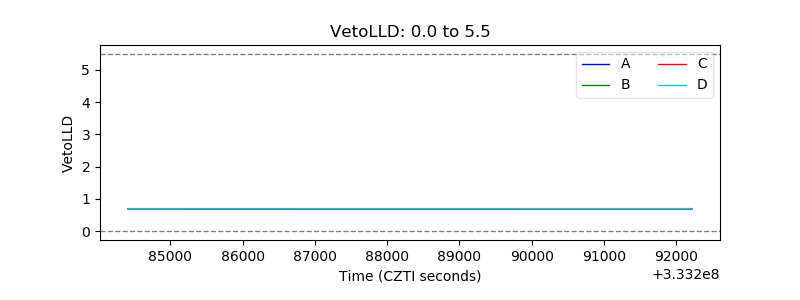 |
| Alpha Counter | 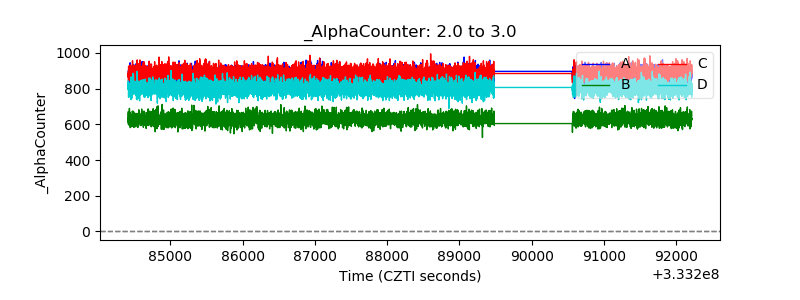 |
| _CPM_Rate | 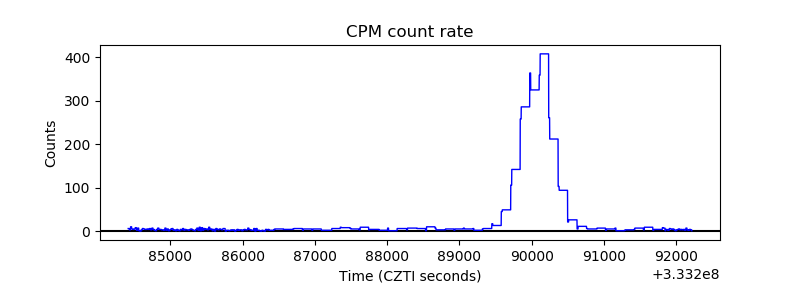 |
| CZT Counter | 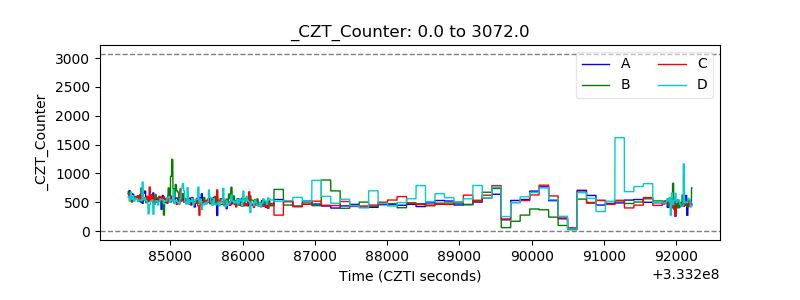 |
| +2.5 Volts monitor | 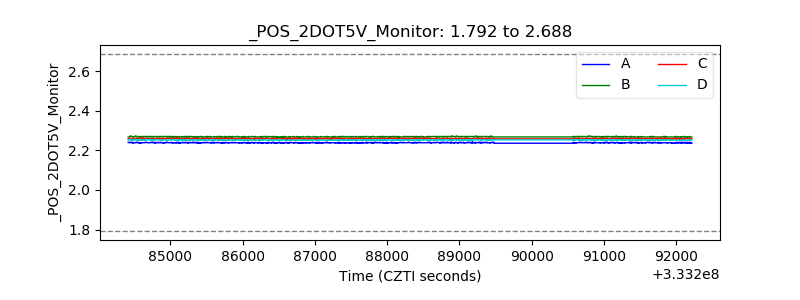 |
| +5 Volts monitor | 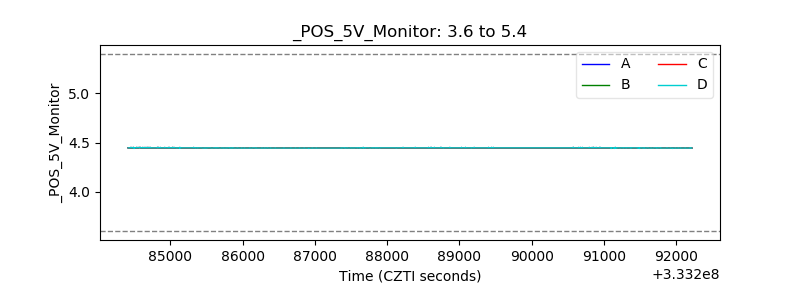 |
| _ROLL_ROT | 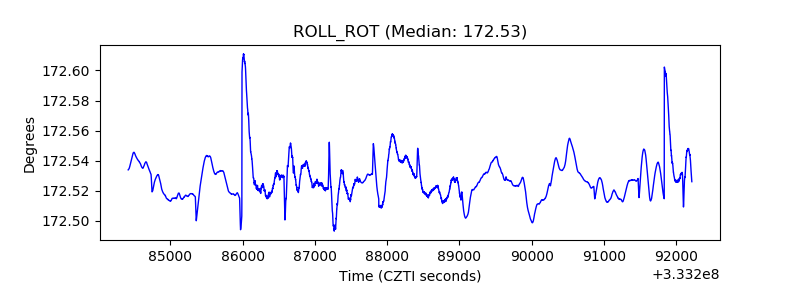 |
| _Roll_DEC | 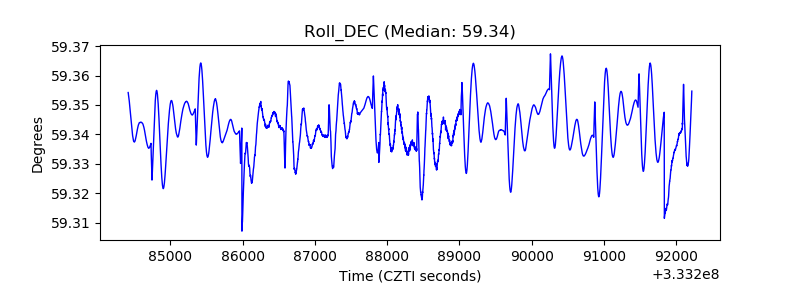 |
| _Roll_RA | 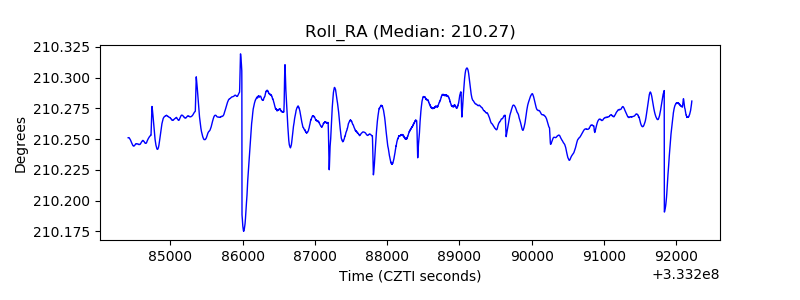 |
| Veto Counter | 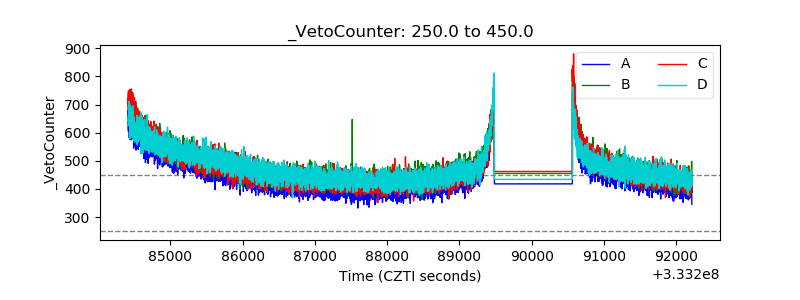 |