| Param | Original file | Final file |
|---|---|---|
| Filename | modeM0/AS1A09_113T01_9000003768cztM0_level2.fits | modeM0/AS1A09_113T01_9000003768cztM0_level2_quad_clean.evt |
| Size (bytes) | 403,807,680 | 401,486,400 |
| Size | 385.1 MB | 382.9 MB |
| Events in quadrant A | 2,474,838 | 2,429,636 |
| Events in quadrant B | 2,368,448 | 2,424,435 |
| Events in quadrant C | 2,388,420 | 2,298,848 |
| Events in quadrant D | 2,116,066 | 2,124,277 |
| Mode SS | |||
|---|---|---|---|
| Quadrant | BADHDUFLAG | Total packets | Discarded packets |
| A | 0 | 860 | 0 |
| B | 0 | 860 | 0 |
| C | 0 | 860 | 0 |
| D | 0 | 860 | 0 |
| Mode M9 | |||
|---|---|---|---|
| Quadrant | BADHDUFLAG | Total packets | Discarded packets |
| A | 0 | 48 | 0 |
| B | 0 | 48 | 0 |
| C | 0 | 48 | 0 |
| D | 0 | 48 | 0 |
| Mode M0 | |||
|---|---|---|---|
| Quadrant | BADHDUFLAG | Total packets | Discarded packets |
| A | 0 | 87266 | 0 |
| B | 0 | 87920 | 0 |
| C | 0 | 86668 | 0 |
| D | 0 | 95747 | 0 |
| Quadrant | Total seconds | Saturated seconds | Saturation percentage |
|---|---|---|---|
| A | 41966 | 394 | 0.938855% |
| B | 41966 | 447 | 1.065148% |
| C | 41966 | 536 | 1.277224% |
| D | 41966 | 728 | 1.734738% |
Noise dominated data is calculated using 1-second bins in cleaned event files. If a bin has >2000 counts, and if more than 50% of those come from <1% of pixels, then it is considered to be noise-dominated and hence unusable.
| Quadrant | # 1 sec bins | Bins with >0 counts | Bins with >2000 counts | High rate bins dominated by noise | Noise dominated (total time) | Noise dominated (detector-on time) | Marked lightcurve |
|---|---|---|---|---|---|---|---|
| A | 46916 | 41962 | 0 | 0 | 0.00% | 0.00% |  |
| B | 46916 | 41960 | 0 | 0 | 0.00% | 0.00% | 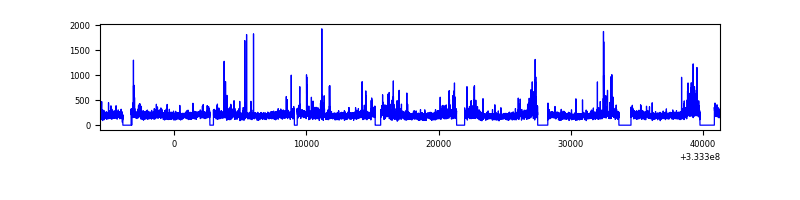 |
| C | 46916 | 41962 | 0 | 0 | 0.00% | 0.00% |  |
| D | 46916 | 41960 | 0 | 0 | 0.00% | 0.00% |  |
Top three noisy pixels from each quadrant. If the there are fewer than three noisy pixels in the level2.evt file, extra rows are filled as -1
| Pixel properties | Quadrant properties | ||||||
|---|---|---|---|---|---|---|---|
| Quadrant | DetID | PixID | Counts | Sigma | Mean | Median | Sigma |
| A | 0 | 29 | 2027 | 8.83 | 645 | 604 | 161.2 |
| A | 7 | 110 | 1956 | 8.39 | 645 | 604 | 161.2 |
| A | 9 | 19 | 1855 | 7.76 | 645 | 604 | 161.2 |
| B | 2 | 9 | 1787 | 9.88 | 624 | 597 | 120.5 |
| B | 14 | 254 | 1619 | 8.48 | 624 | 597 | 120.5 |
| B | 5 | 255 | 1556 | 7.96 | 624 | 597 | 120.5 |
| C | 12 | 241 | 1766 | 7.4 | 630 | 589 | 159.0 |
| C | 12 | 250 | 1695 | 6.96 | 630 | 589 | 159.0 |
| C | 12 | 249 | 1646 | 6.65 | 630 | 589 | 159.0 |
| D | 3 | 14 | 1580 | 6.35 | 603 | 549 | 162.4 |
| D | 15 | 46 | 1510 | 5.92 | 603 | 549 | 162.4 |
| D | 6 | 231 | 1462 | 5.62 | 603 | 549 | 162.4 |
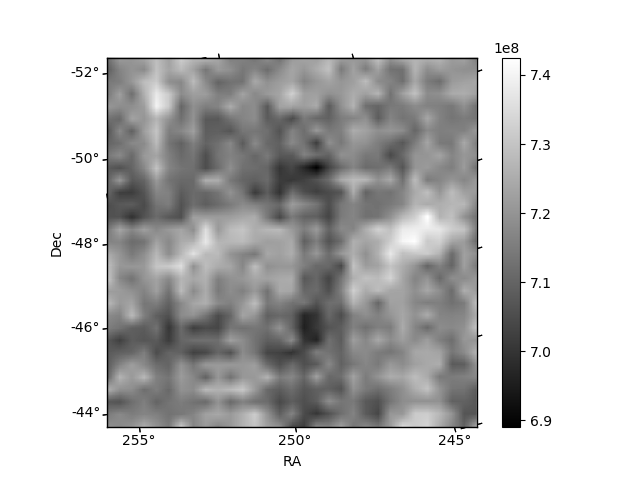
Histogram calculated using DETX and DETY for each event in the final _common_clean file
| Quadrant A | 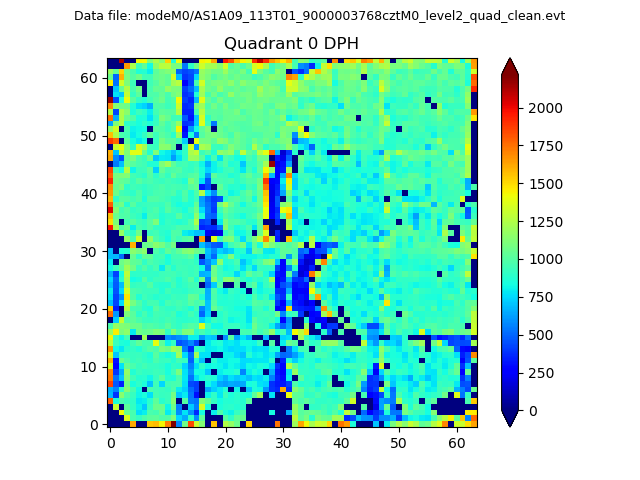 |
 |
Quadrant B |
|---|---|---|---|
| Quadrant D | 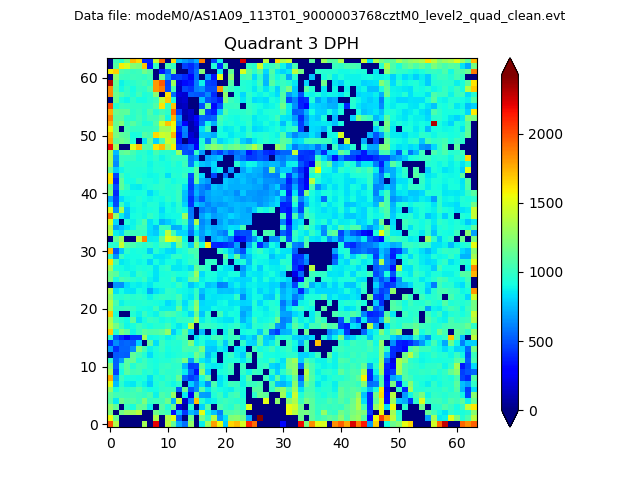 |
 |
Quadrant C |
| Plot type | Count rate plots | Images |
|---|---|---|
| Comparison with Poisson distribution Blue bars denote a histogram of data divided into 1 sec bins. Red curve is a Poisson curve with rate = median count rate of data. |
 |
 |
| Quadrant-wise count rates Data is divided into 100 sec bins |
 |
|
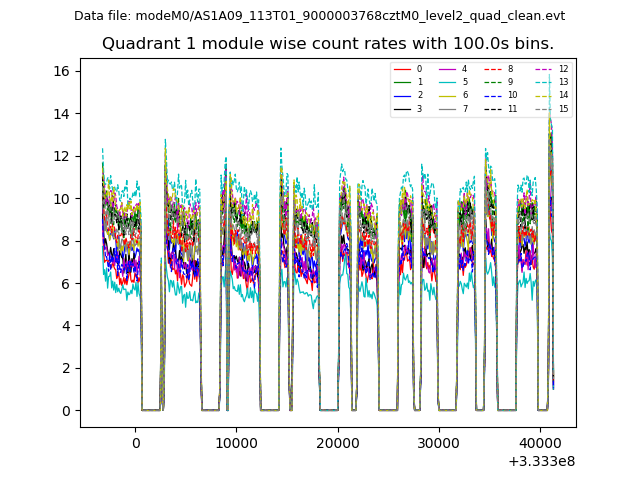
| Module-wise count rates for Quadrant A Data is divided into 100 sec bins |
 |
 |
| Module-wise count rates for Quadrant B Data is divided into 100 sec bins |
 |
 |
| Module-wise count rates for Quadrant C Data is divided into 100 sec bins |
 |
 |
| Module-wise count rates for Quadrant D Data is divided into 100 sec bins |
 |
 |
| Parameter | Plot |
|---|---|
| CZT HV Monitor |  |
| D_VDD |  |
| Temperature 1 |  |
| Veto HV Monitor |  |
| Veto LLD |  |
| Alpha Counter | 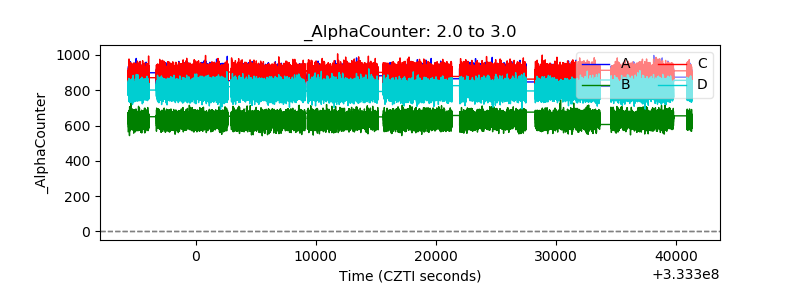 |
| _CPM_Rate | 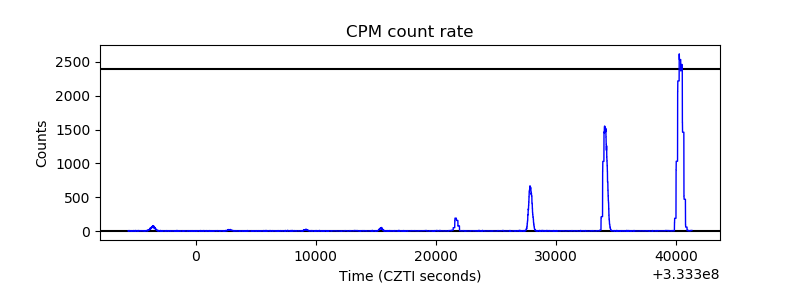 |
| CZT Counter | 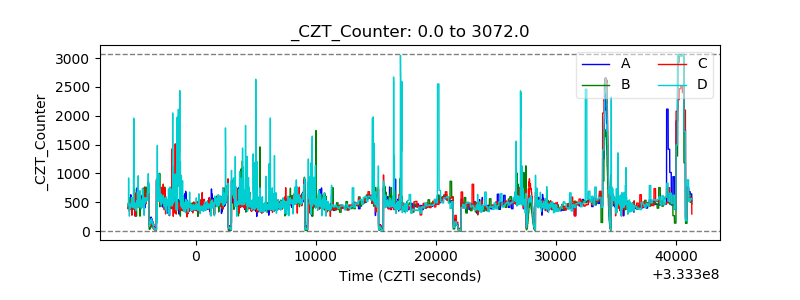 |
| +2.5 Volts monitor |  |
| +5 Volts monitor |  |
| _ROLL_ROT | 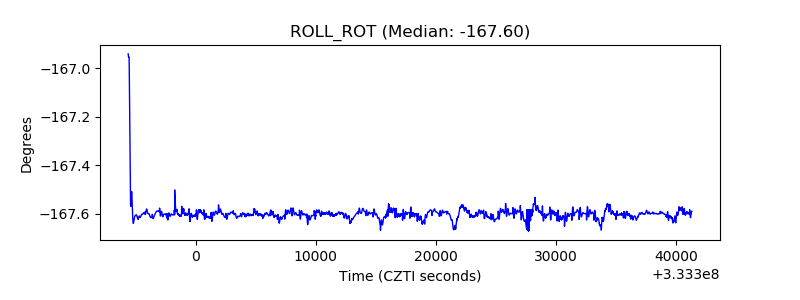 |
| _Roll_DEC | 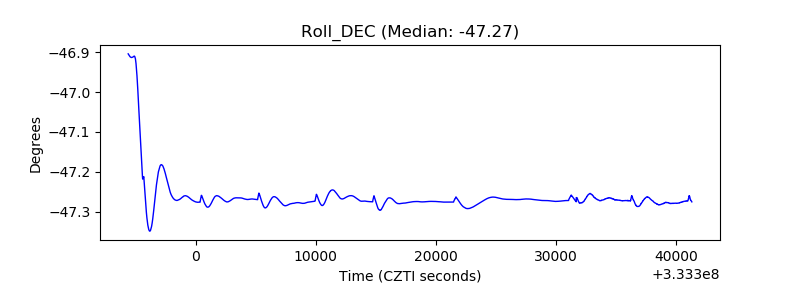 |
| _Roll_RA | 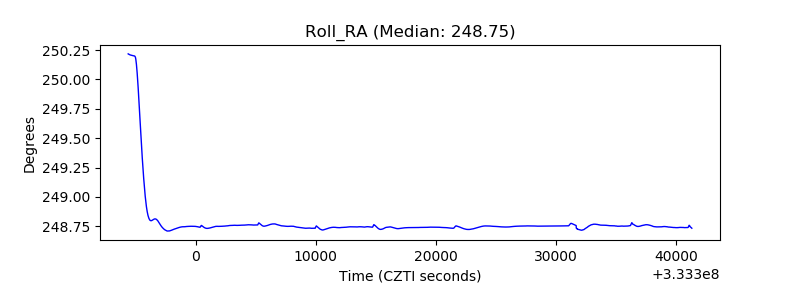 |
| Veto Counter | 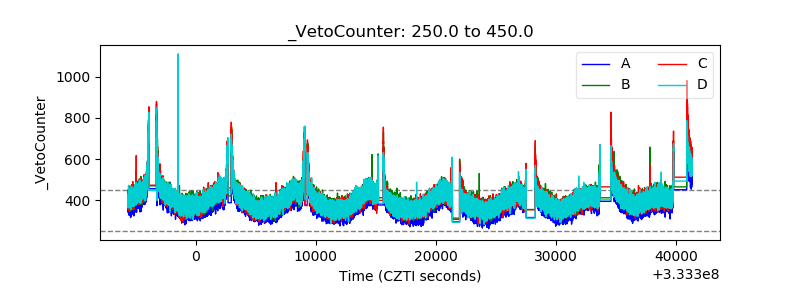 |