| Param | Original file | Final file |
|---|---|---|
| Filename | modeM0/AS1A09_113T01_9000003768_26072cztM0_level2.evt | modeM0/AS1A09_113T01_9000003768_26072cztM0_level2_quad_clean.evt |
| Size (bytes) | 236,975,040 | 40,357,440 |
| Size | 226.0 MB | 38.5 MB |
| Events in quadrant A | 1,663,720 | 252,050 |
| Events in quadrant B | 1,679,916 | 256,010 |
| Events in quadrant C | 1,686,274 | 242,553 |
| Events in quadrant D | 1,926,004 | 241,928 |
| Mode M9 | |||
|---|---|---|---|
| Quadrant | BADHDUFLAG | Total packets | Discarded packets |
| A | 0 | 7 | 0 |
| B | 0 | 7 | 0 |
| C | 0 | 7 | 0 |
| D | 0 | 7 | 0 |
| Mode M0 | |||
|---|---|---|---|
| Quadrant | BADHDUFLAG | Total packets | Discarded packets |
| A | 0 | 6831 | 0 |
| B | 0 | 6911 | 0 |
| C | 0 | 6907 | 0 |
| D | 0 | 7756 | 0 |
| Quadrant | Total seconds | Saturated seconds | Saturation percentage |
|---|---|---|---|
| A | 3231 | 127 | 3.930672% |
| B | 3231 | 141 | 4.363974% |
| C | 3231 | 150 | 4.642526% |
| D | 3231 | 165 | 5.106778% |
Noise dominated data is calculated using 1-second bins in cleaned event files. If a bin has >2000 counts, and if more than 50% of those come from <1% of pixels, then it is considered to be noise-dominated and hence unusable.
| Quadrant | # 1 sec bins | Bins with >0 counts | Bins with >2000 counts | High rate bins dominated by noise | Noise dominated (total time) | Noise dominated (detector-on time) | Marked lightcurve |
|---|---|---|---|---|---|---|---|
| A | 3876 | 3232 | 0 | 0 | 0.00% | 0.00% | 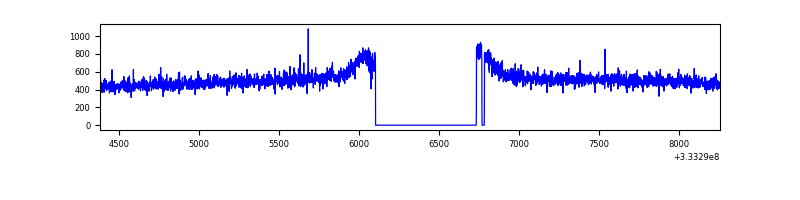 |
| B | 3876 | 3232 | 0 | 0 | 0.00% | 0.00% | 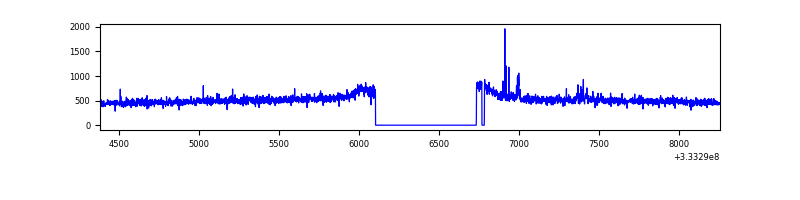 |
| C | 3876 | 3232 | 1 | 1 | 0.03% | 0.03% | 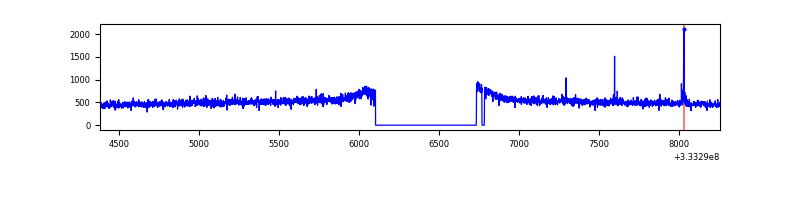 |
| D | 3876 | 3232 | 50 | 50 | 1.29% | 1.55% | 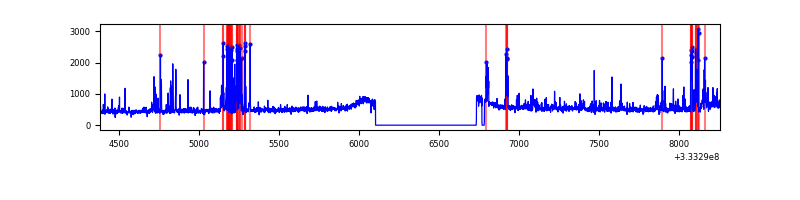 |
Top three noisy pixels from each quadrant. If the there are fewer than three noisy pixels in the level2.evt file, extra rows are filled as -1
| Pixel properties | Quadrant properties | ||||||
|---|---|---|---|---|---|---|---|
| Quadrant | DetID | PixID | Counts | Sigma | Mean | Median | Sigma |
| A | 13 | 254 | 5943 | 63.05 | 428 | 418 | 87.6 |
| A | 0 | 13 | 5343 | 56.2 | 428 | 418 | 87.6 |
| A | 3 | 137 | 4025 | 41.16 | 428 | 418 | 87.6 |
| B | 0 | 230 | 13822 | 162.27 | 423 | 412 | 82.6 |
| B | 12 | 111 | 10072 | 116.9 | 423 | 412 | 82.6 |
| B | 11 | 111 | 9122 | 105.4 | 423 | 412 | 82.6 |
| C | 14 | 238 | 65727 | 676.91 | 410 | 412 | 96.5 |
| C | 2 | 16 | 9552 | 94.72 | 410 | 412 | 96.5 |
| C | 8 | 128 | 3767 | 34.77 | 410 | 412 | 96.5 |
| D | 1 | 52 | 233016 | 2243.07 | 417 | 405 | 103.7 |
| D | 13 | 168 | 57712 | 552.61 | 417 | 405 | 103.7 |
| D | 12 | 233 | 28986 | 275.61 | 417 | 405 | 103.7 |
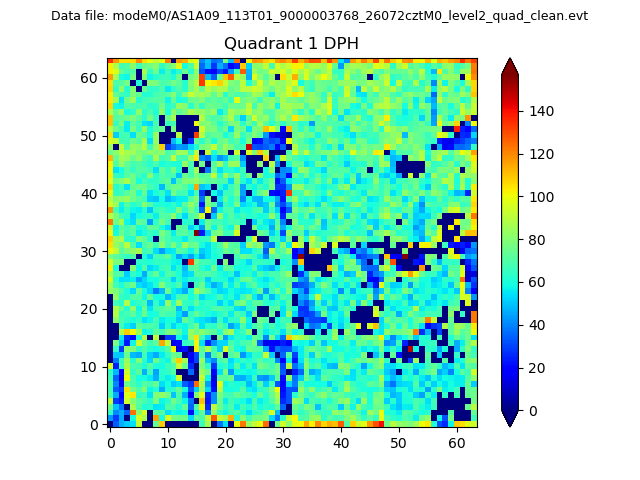
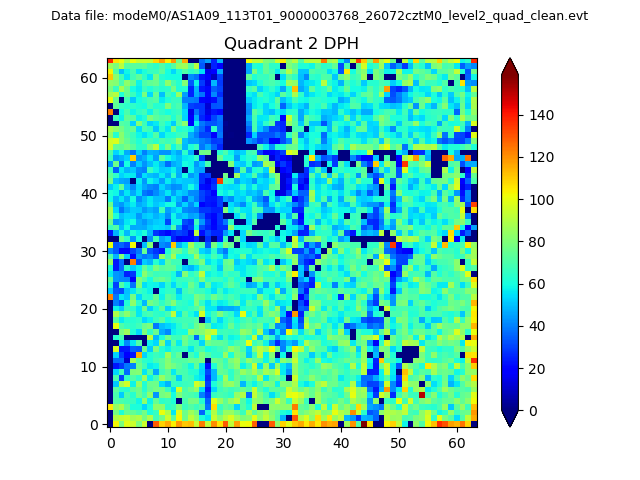
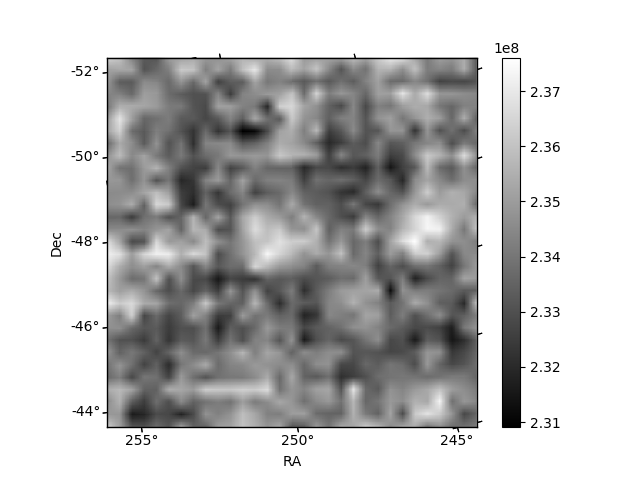
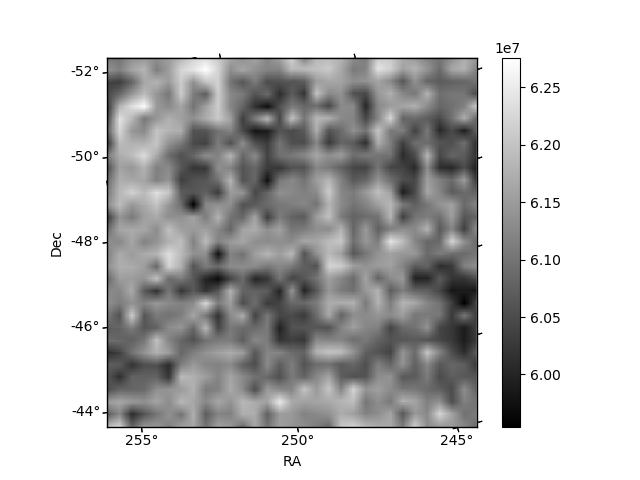
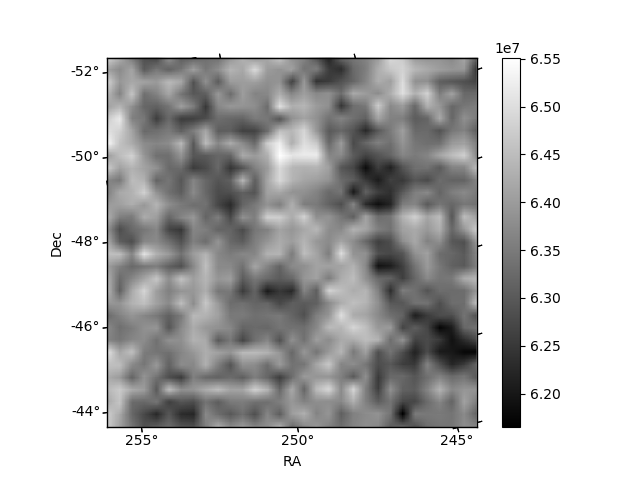
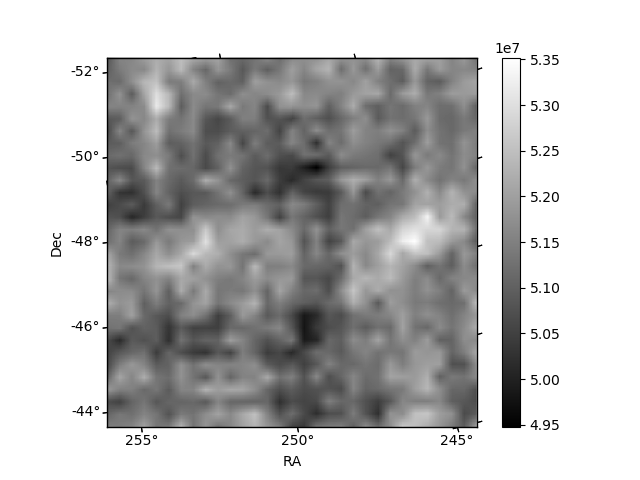
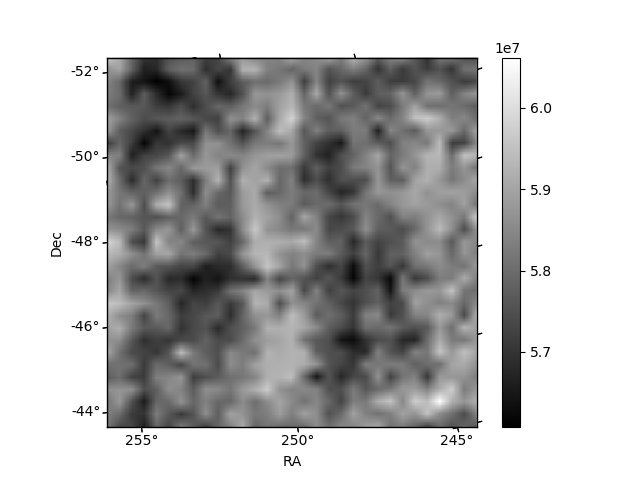
Histogram calculated using DETX and DETY for each event in the final _common_clean file
| Quadrant A |  |
 |
Quadrant B |
|---|---|---|---|
| Quadrant D | 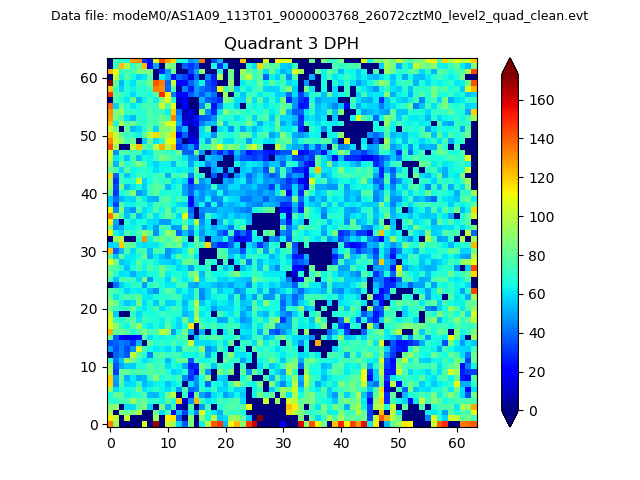 |
 |
Quadrant C |
| Plot type | Count rate plots | Images |
|---|---|---|
| Comparison with Poisson distribution Blue bars denote a histogram of data divided into 1 sec bins. Red curve is a Poisson curve with rate = median count rate of data. |
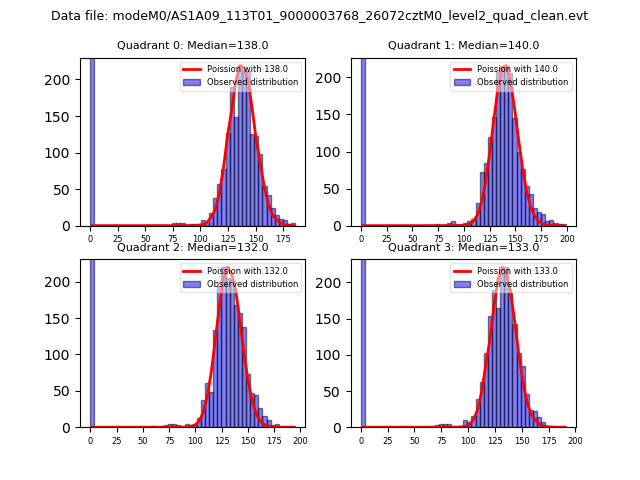 |
 |
| Quadrant-wise count rates Data is divided into 100 sec bins |
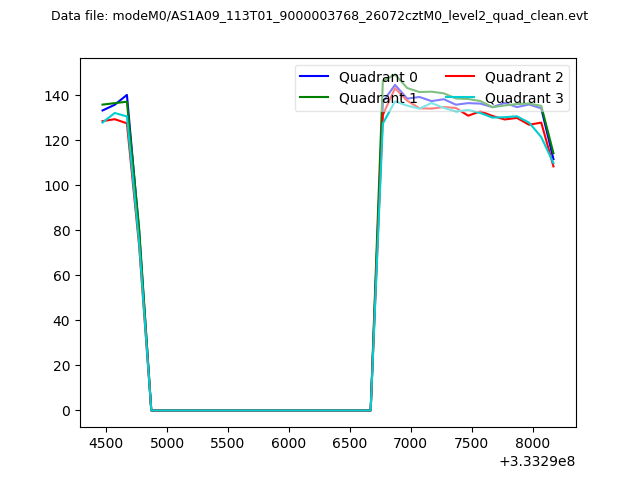 |
|
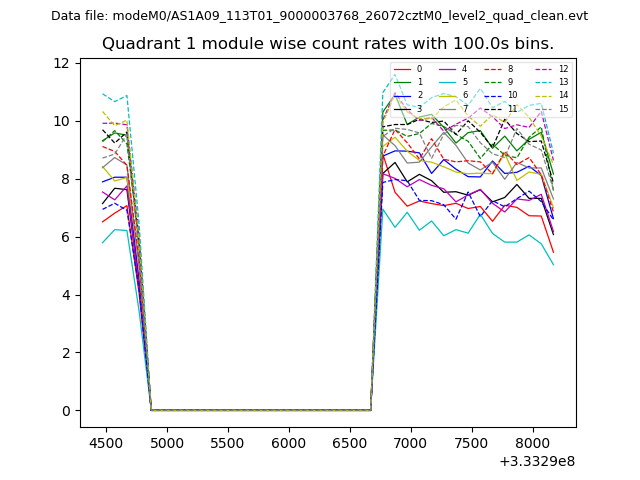
| Module-wise count rates for Quadrant A Data is divided into 100 sec bins |
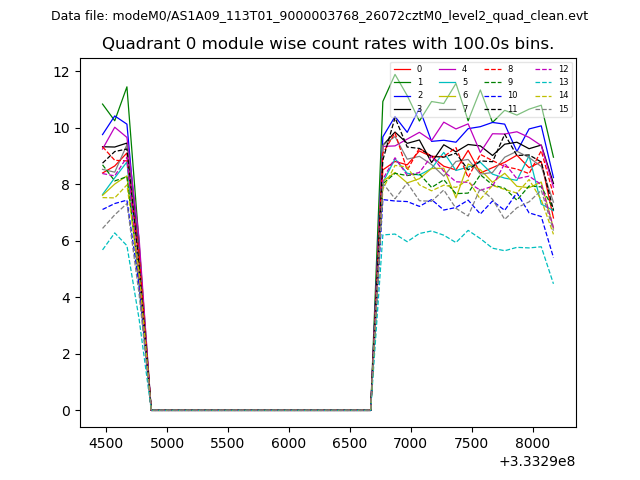 |
 |
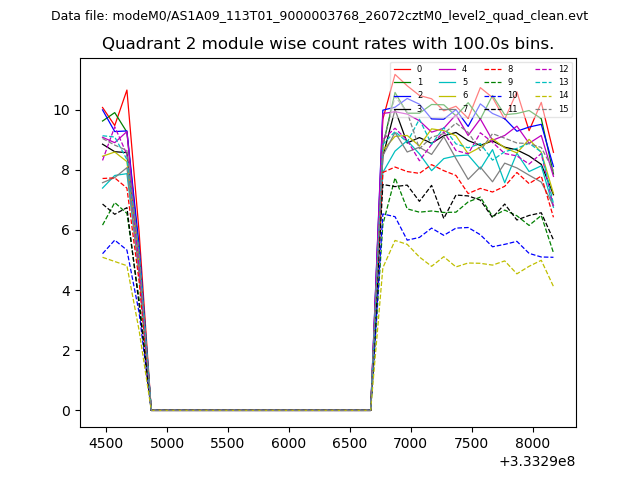
| Module-wise count rates for Quadrant B Data is divided into 100 sec bins |
 |
 |
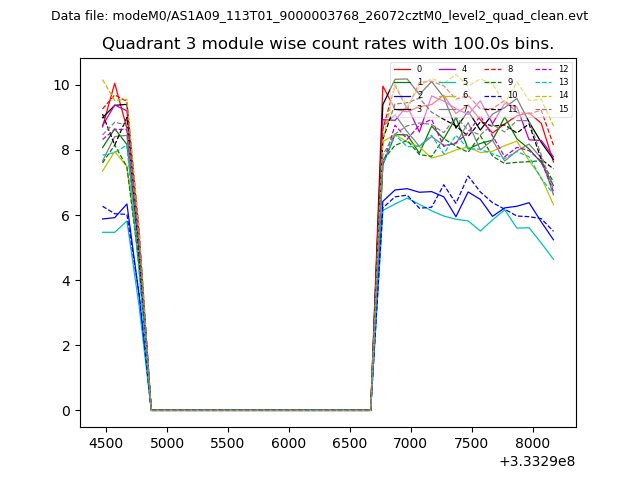
| Module-wise count rates for Quadrant C Data is divided into 100 sec bins |
 |
 |
| Module-wise count rates for Quadrant D Data is divided into 100 sec bins |
 |
 |
| Parameter | Plot |
|---|---|
| CZT HV Monitor | 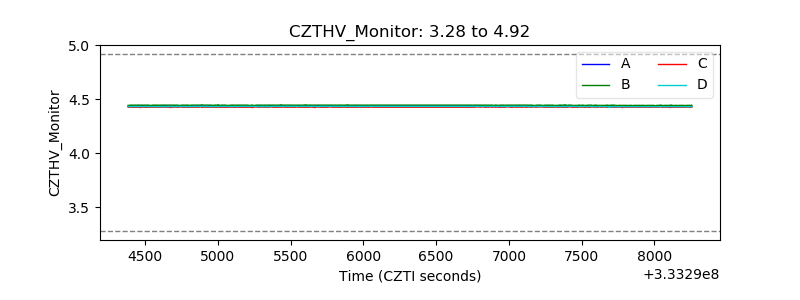 |
| D_VDD | 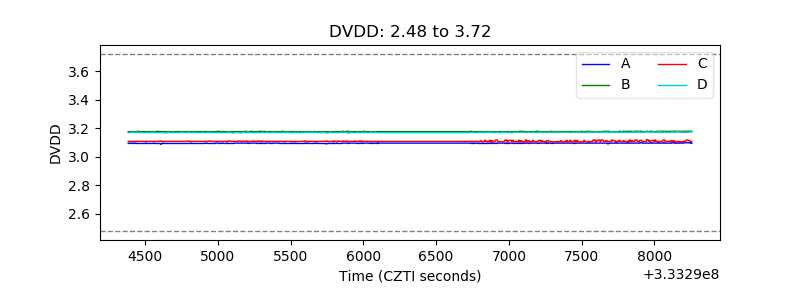 |
| Temperature 1 | 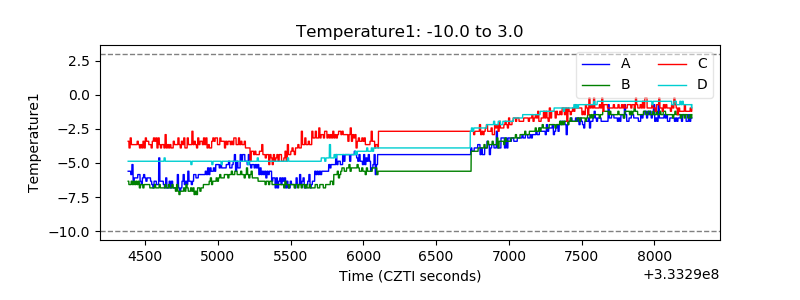 |
| Veto HV Monitor | 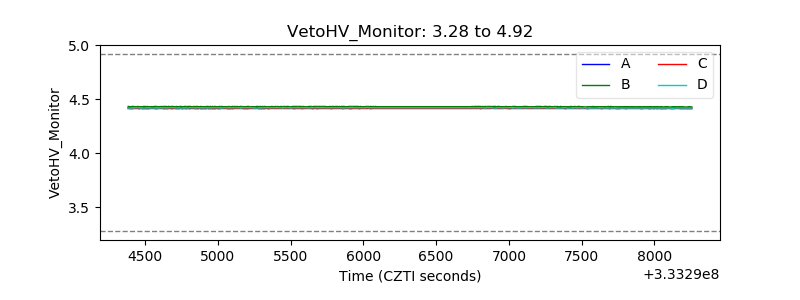 |
| Veto LLD | 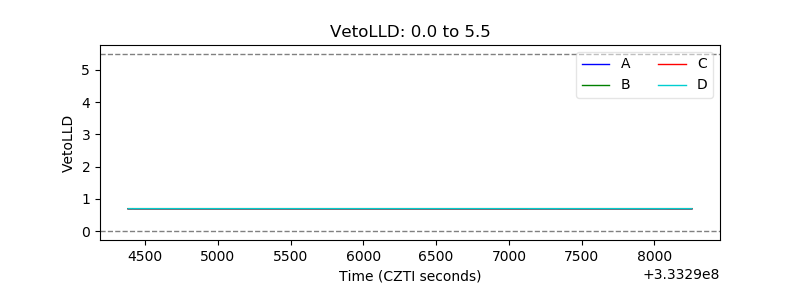 |
| Alpha Counter | 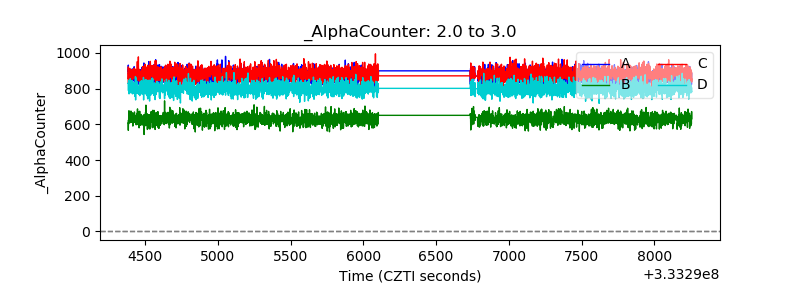 |
| _CPM_Rate |  |
| CZT Counter | 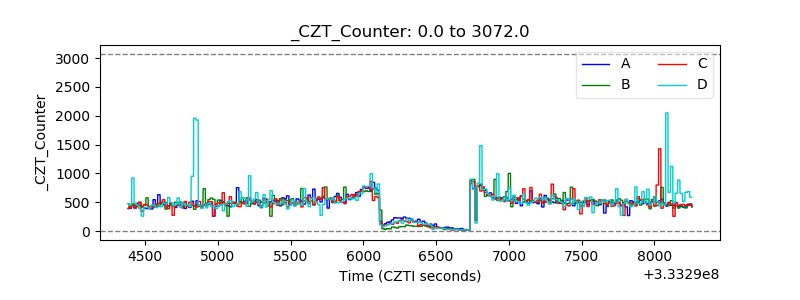 |
| +2.5 Volts monitor |  |
| +5 Volts monitor | 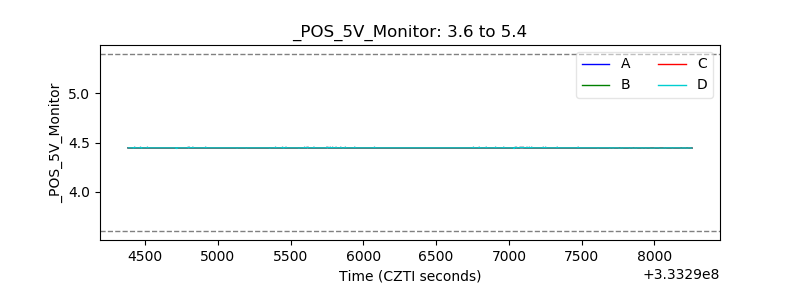 |
| _ROLL_ROT | 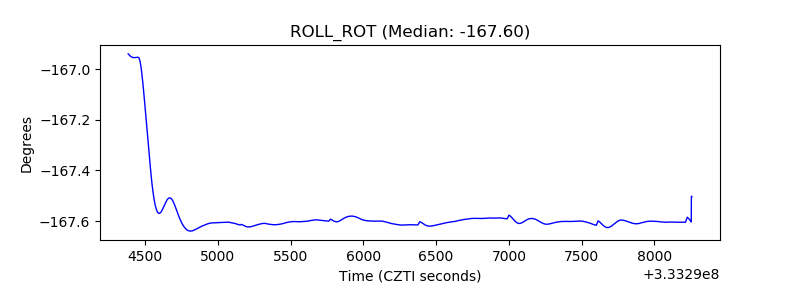 |
| _Roll_DEC |  |
| _Roll_RA |  |
| Veto Counter | 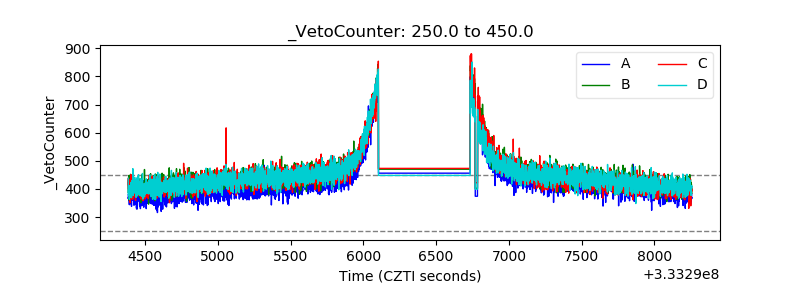 |