| Param | Original file | Final file |
|---|---|---|
| Filename | modeM0/AS1A09_113T01_9000003768_26073cztM0_level2.evt | modeM0/AS1A09_113T01_9000003768_26073cztM0_level2_quad_clean.evt |
| Size (bytes) | 484,073,280 | 102,441,600 |
| Size | 461.6 MB | 97.7 MB |
| Events in quadrant A | 3,398,026 | 668,643 |
| Events in quadrant B | 3,400,025 | 670,475 |
| Events in quadrant C | 3,366,126 | 639,377 |
| Events in quadrant D | 4,020,943 | 636,721 |
| Mode M9 | |||
|---|---|---|---|
| Quadrant | BADHDUFLAG | Total packets | Discarded packets |
| A | 0 | 2 | 0 |
| B | 0 | 2 | 0 |
| C | 0 | 2 | 0 |
| D | 0 | 2 | 0 |
| Mode M0 | |||
|---|---|---|---|
| Quadrant | BADHDUFLAG | Total packets | Discarded packets |
| A | 0 | 14480 | 0 |
| B | 0 | 14487 | 0 |
| C | 0 | 14528 | 0 |
| D | 0 | 16606 | 0 |
| Quadrant | Total seconds | Saturated seconds | Saturation percentage |
|---|---|---|---|
| A | 6987 | 63 | 0.901675% |
| B | 6988 | 81 | 1.159130% |
| C | 6988 | 106 | 1.516886% |
| D | 6988 | 91 | 1.302232% |
Noise dominated data is calculated using 1-second bins in cleaned event files. If a bin has >2000 counts, and if more than 50% of those come from <1% of pixels, then it is considered to be noise-dominated and hence unusable.
| Quadrant | # 1 sec bins | Bins with >0 counts | Bins with >2000 counts | High rate bins dominated by noise | Noise dominated (total time) | Noise dominated (detector-on time) | Marked lightcurve |
|---|---|---|---|---|---|---|---|
| A | 7262 | 6988 | 0 | 0 | 0.00% | 0.00% | 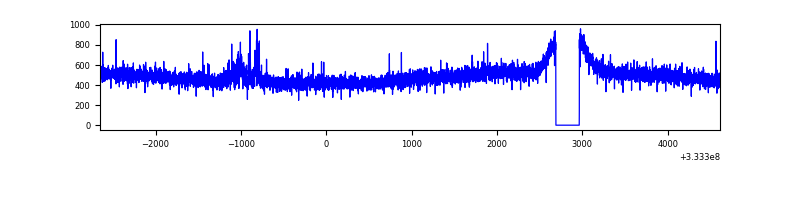 |
| B | 7263 | 6989 | 0 | 0 | 0.00% | 0.00% | 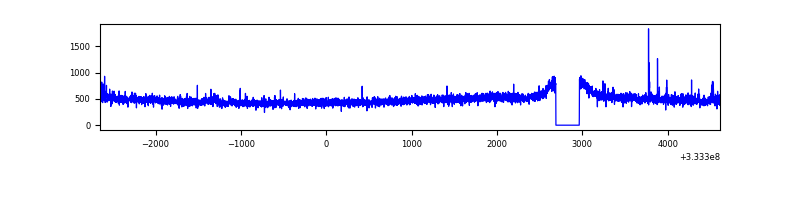 |
| C | 7263 | 6989 | 4 | 4 | 0.06% | 0.06% | 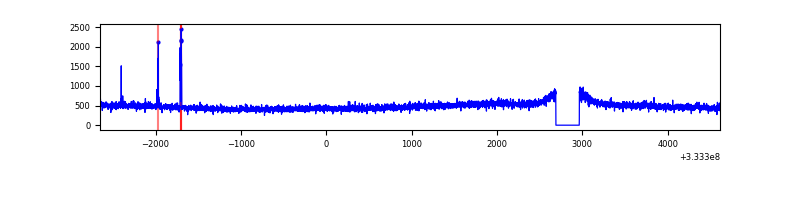 |
| D | 7263 | 6989 | 66 | 66 | 0.91% | 0.94% | 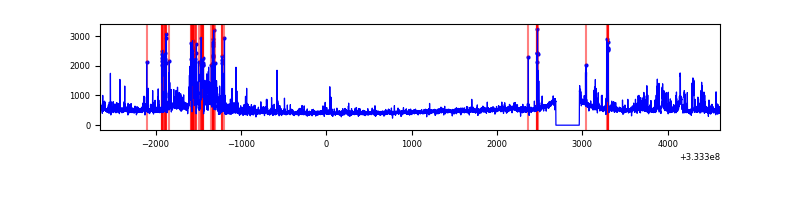 |
Top three noisy pixels from each quadrant. If the there are fewer than three noisy pixels in the level2.evt file, extra rows are filled as -1
| Pixel properties | Quadrant properties | ||||||
|---|---|---|---|---|---|---|---|
| Quadrant | DetID | PixID | Counts | Sigma | Mean | Median | Sigma |
| A | 0 | 13 | 51545 | 293.99 | 866 | 850 | 172.4 |
| A | 13 | 254 | 12540 | 67.79 | 866 | 850 | 172.4 |
| A | 3 | 137 | 7948 | 41.16 | 866 | 850 | 172.4 |
| B | 0 | 190 | 31670 | 186.87 | 855 | 834 | 165.0 |
| B | 12 | 111 | 19832 | 115.13 | 855 | 834 | 165.0 |
| B | 11 | 111 | 17697 | 102.19 | 855 | 834 | 165.0 |
| C | 14 | 238 | 130765 | 680.37 | 816 | 819 | 191.0 |
| C | 14 | 225 | 22769 | 114.93 | 816 | 819 | 191.0 |
| C | 2 | 16 | 10242 | 49.34 | 816 | 819 | 191.0 |
| D | 1 | 52 | 348094 | 1661.06 | 830 | 807 | 209.1 |
| D | 7 | 38 | 238752 | 1138.08 | 830 | 807 | 209.1 |
| D | 13 | 168 | 163176 | 776.6 | 830 | 807 | 209.1 |
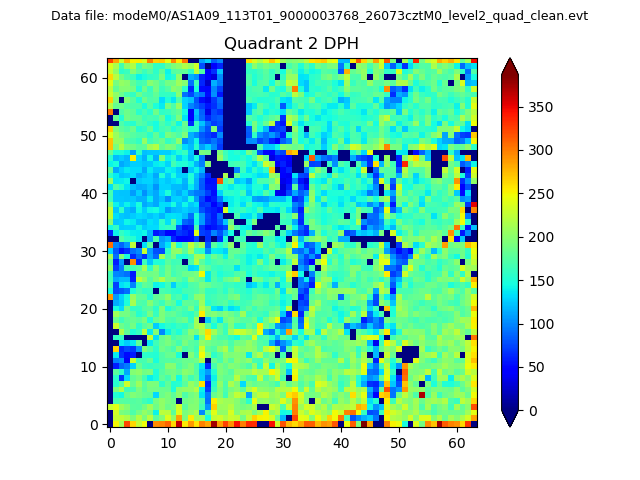
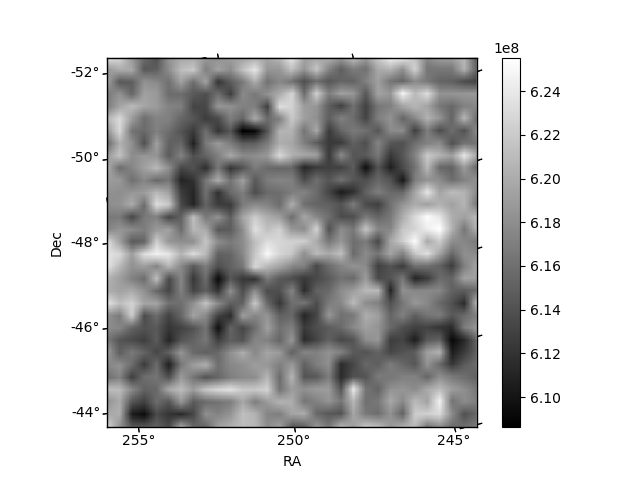
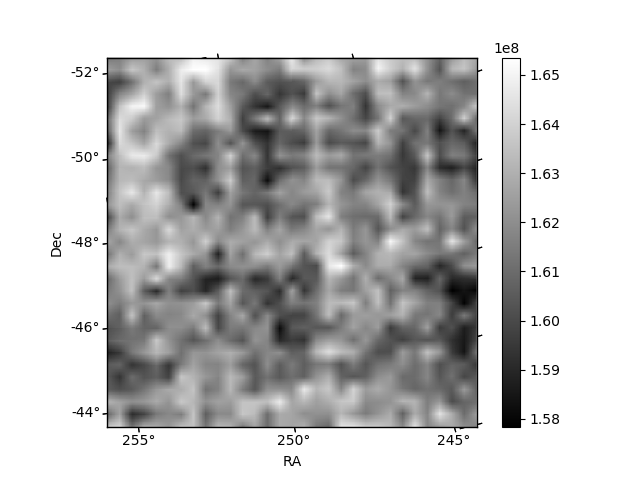
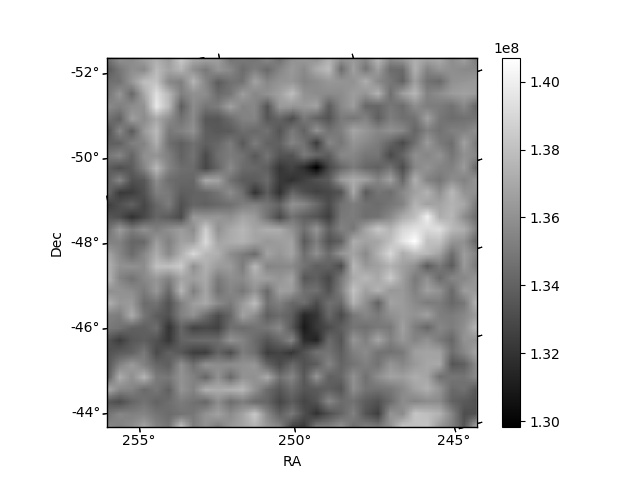
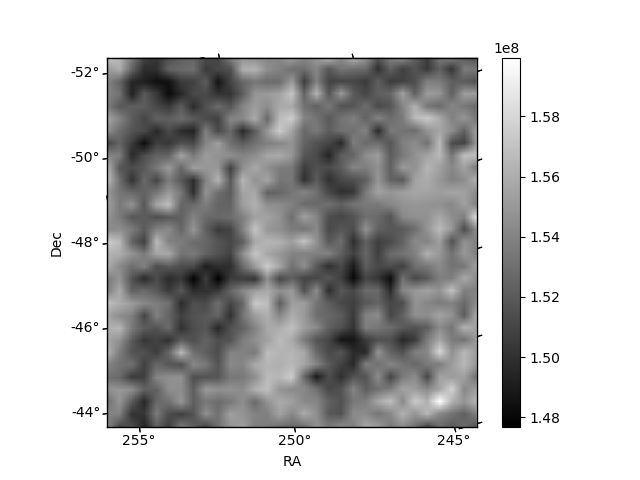
Histogram calculated using DETX and DETY for each event in the final _common_clean file
| Quadrant A | 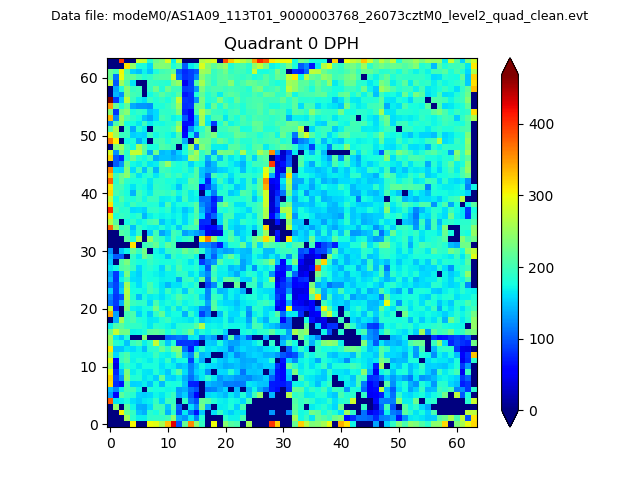 |
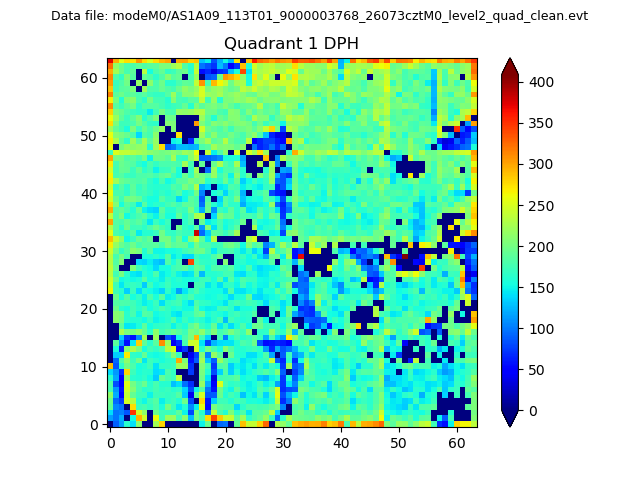 |
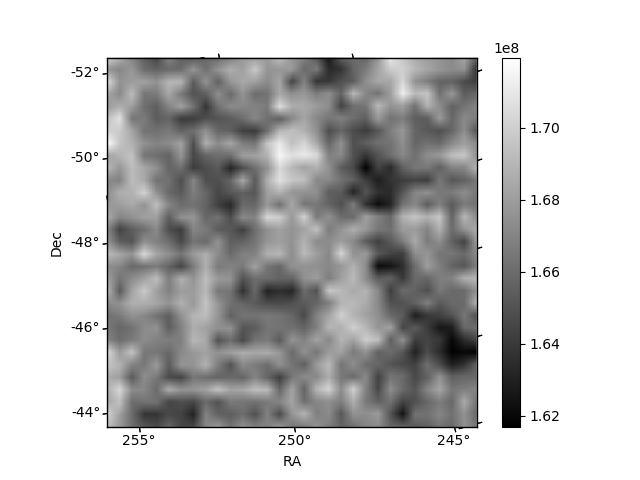
Quadrant B |
|---|---|---|---|
| Quadrant D | 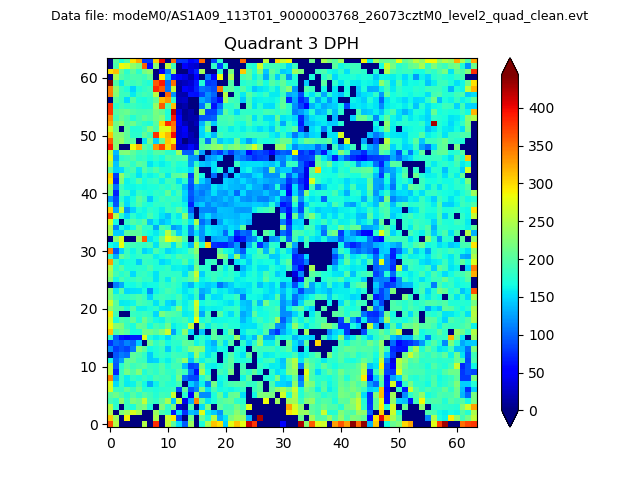 |
 |
Quadrant C |
| Plot type | Count rate plots | Images |
|---|---|---|
| Comparison with Poisson distribution Blue bars denote a histogram of data divided into 1 sec bins. Red curve is a Poisson curve with rate = median count rate of data. |
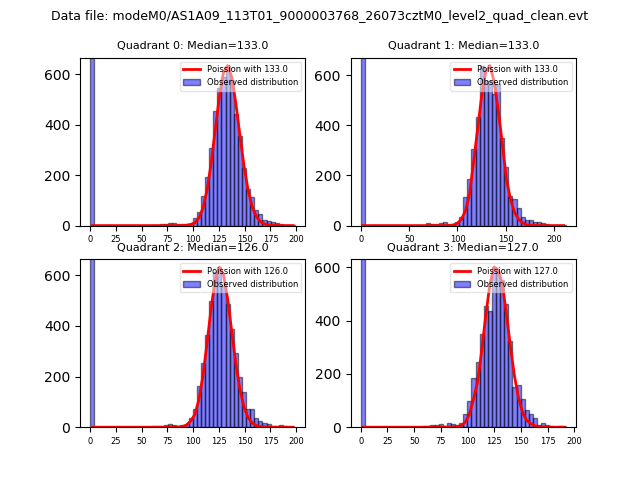 |
 |
| Quadrant-wise count rates Data is divided into 100 sec bins |
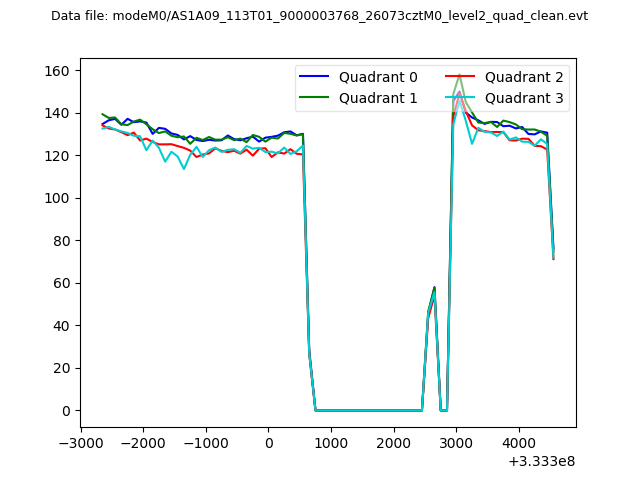 |
|
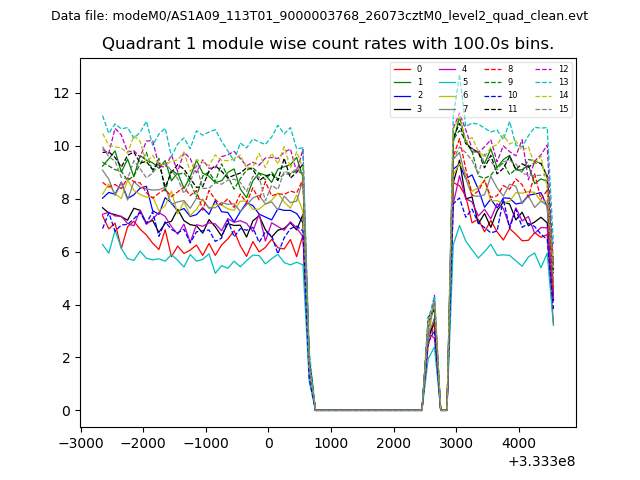
| Module-wise count rates for Quadrant A Data is divided into 100 sec bins |
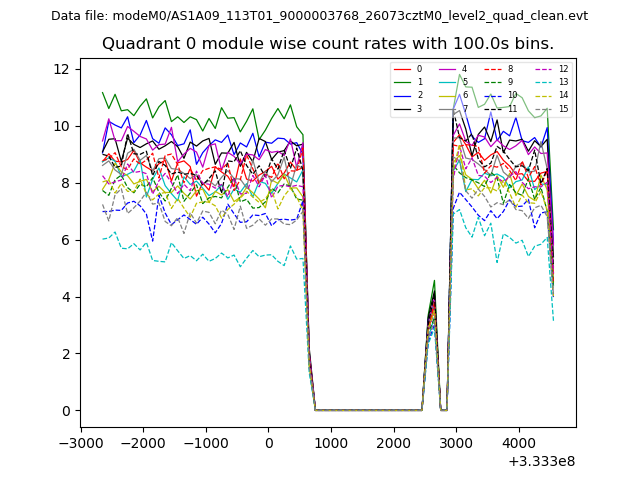 |
 |
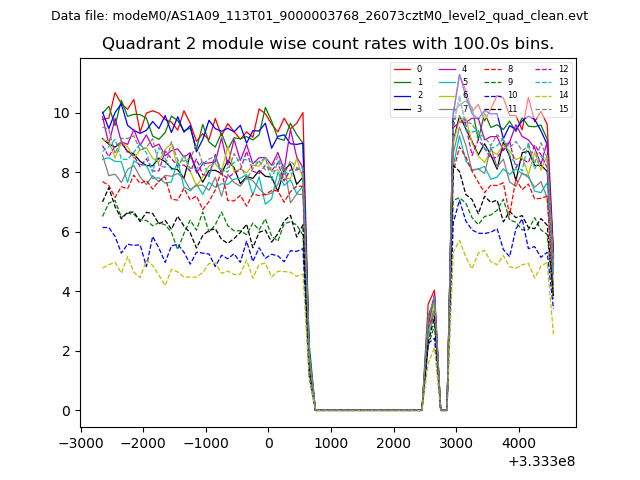
| Module-wise count rates for Quadrant B Data is divided into 100 sec bins |
 |
 |
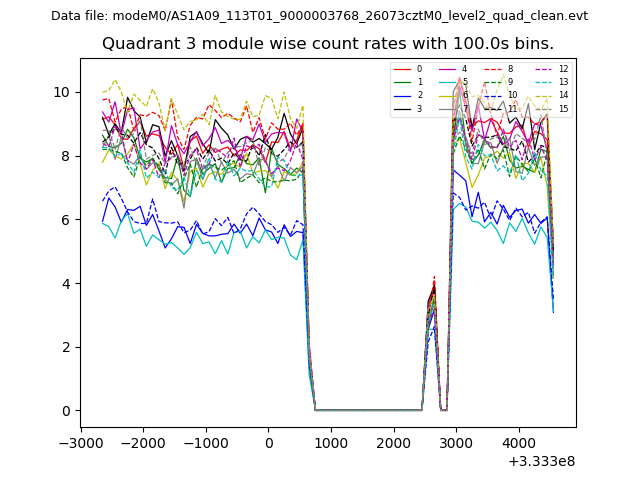
| Module-wise count rates for Quadrant C Data is divided into 100 sec bins |
 |
 |
| Module-wise count rates for Quadrant D Data is divided into 100 sec bins |
 |
 |
| Parameter | Plot |
|---|---|
| CZT HV Monitor | 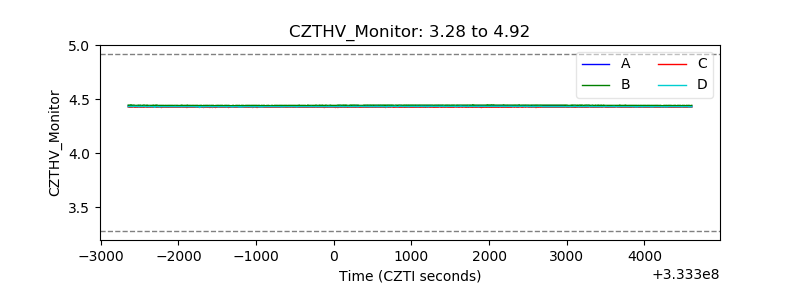 |
| D_VDD | 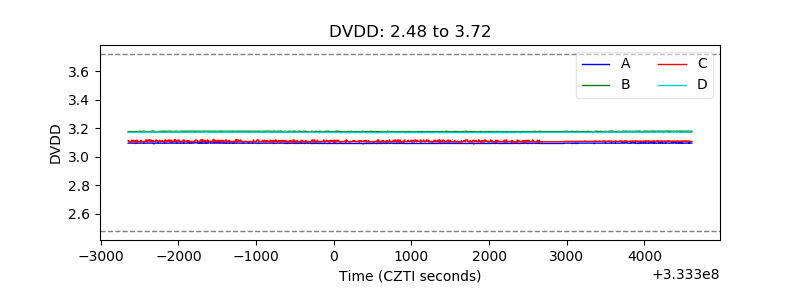 |
| Temperature 1 | 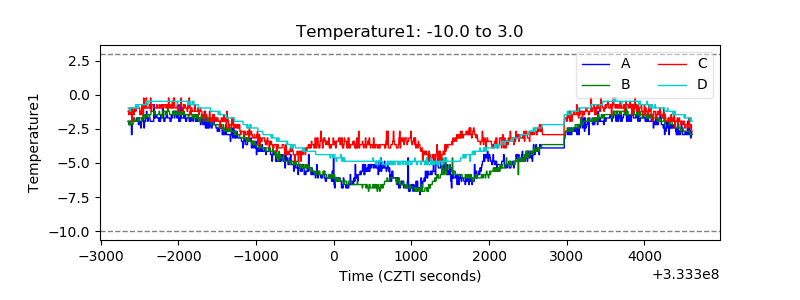 |
| Veto HV Monitor | 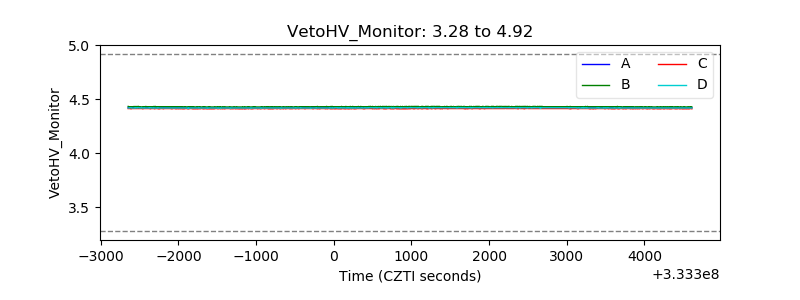 |
| Veto LLD | 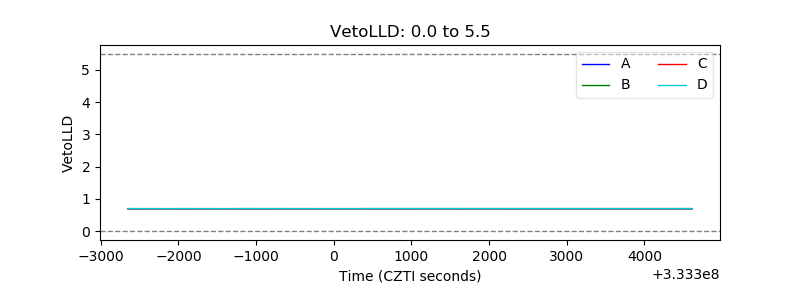 |
| Alpha Counter | 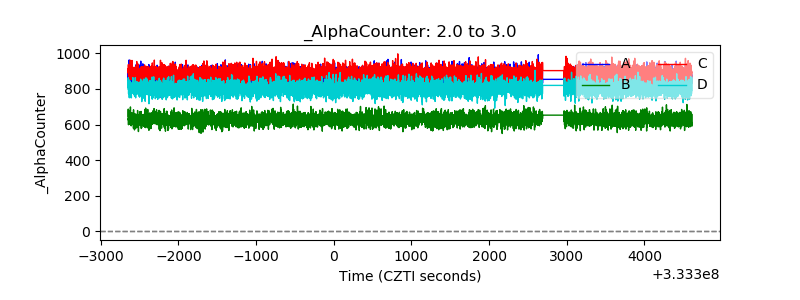 |
| _CPM_Rate | 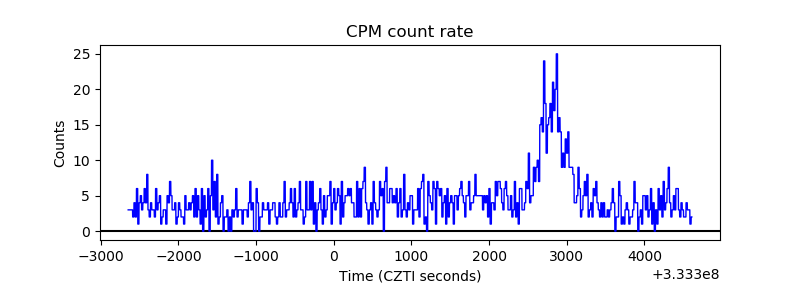 |
| CZT Counter |  |
| +2.5 Volts monitor |  |
| +5 Volts monitor |  |
| _ROLL_ROT |  |
| _Roll_DEC | 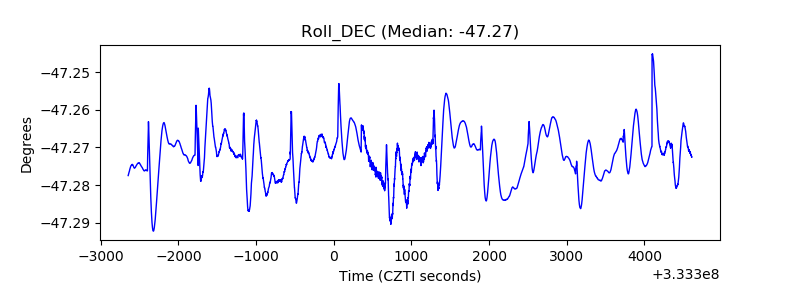 |
| _Roll_RA | 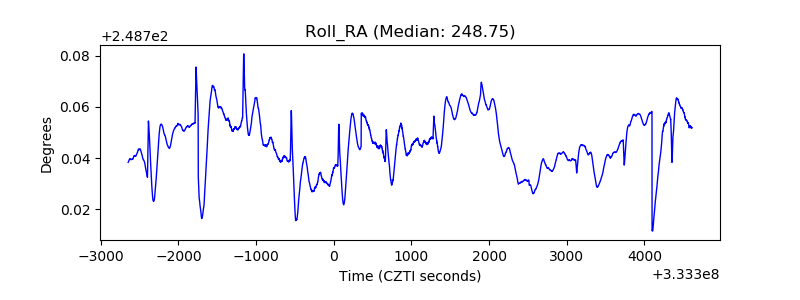 |
| Veto Counter | 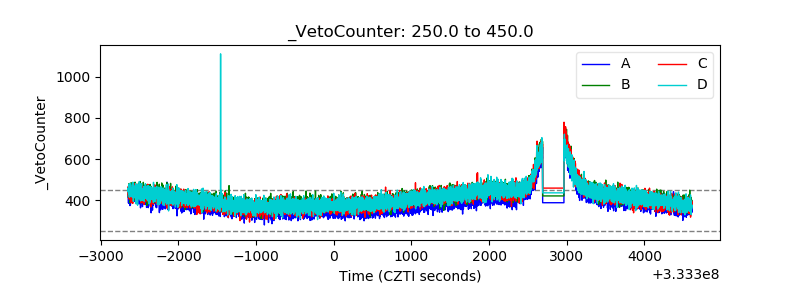 |