| Param | Original file | Final file |
|---|---|---|
| Filename | modeM0/AS1A09_113T01_9000003768_26074cztM0_level2.evt | modeM0/AS1A09_113T01_9000003768_26074cztM0_level2_quad_clean.evt |
| Size (bytes) | 498,502,080 | 107,622,720 |
| Size | 475.4 MB | 102.6 MB |
| Events in quadrant A | 3,503,971 | 701,862 |
| Events in quadrant B | 3,584,904 | 704,313 |
| Events in quadrant C | 3,441,977 | 675,919 |
| Events in quadrant D | 4,070,208 | 668,788 |
| Mode M9 | |||
|---|---|---|---|
| Quadrant | BADHDUFLAG | Total packets | Discarded packets |
| A | 0 | 2 | 0 |
| B | 0 | 2 | 0 |
| C | 0 | 2 | 0 |
| D | 0 | 2 | 0 |
| Mode M0 | |||
|---|---|---|---|
| Quadrant | BADHDUFLAG | Total packets | Discarded packets |
| A | 0 | 15154 | 0 |
| B | 0 | 15309 | 0 |
| C | 0 | 15048 | 0 |
| D | 0 | 16856 | 0 |
| Quadrant | Total seconds | Saturated seconds | Saturation percentage |
|---|---|---|---|
| A | 7305 | 58 | 0.793977% |
| B | 7306 | 83 | 1.136053% |
| C | 7306 | 82 | 1.122365% |
| D | 7306 | 68 | 0.930742% |
Noise dominated data is calculated using 1-second bins in cleaned event files. If a bin has >2000 counts, and if more than 50% of those come from <1% of pixels, then it is considered to be noise-dominated and hence unusable.
| Quadrant | # 1 sec bins | Bins with >0 counts | Bins with >2000 counts | High rate bins dominated by noise | Noise dominated (total time) | Noise dominated (detector-on time) | Marked lightcurve |
|---|---|---|---|---|---|---|---|
| A | 7525 | 7306 | 0 | 0 | 0.00% | 0.00% | 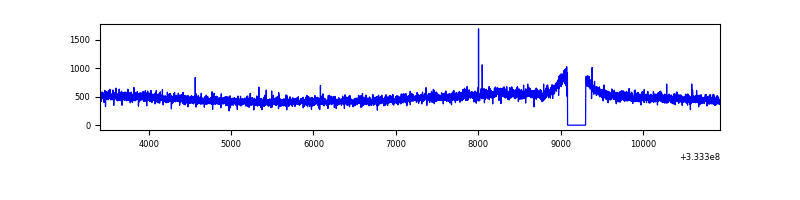 |
| B | 7526 | 7306 | 4 | 4 | 0.05% | 0.05% | 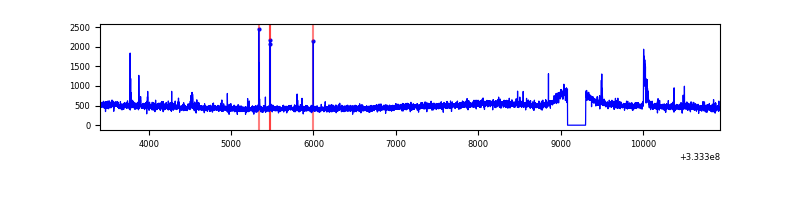 |
| C | 7526 | 7307 | 0 | 0 | 0.00% | 0.00% | 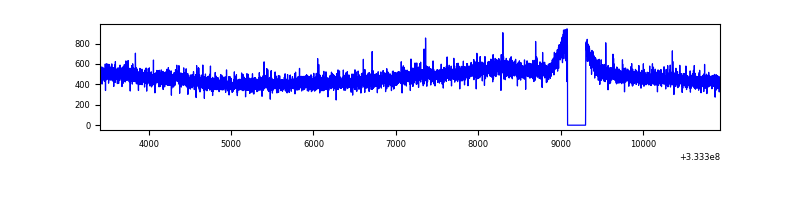 |
| D | 7526 | 7307 | 46 | 46 | 0.61% | 0.63% | 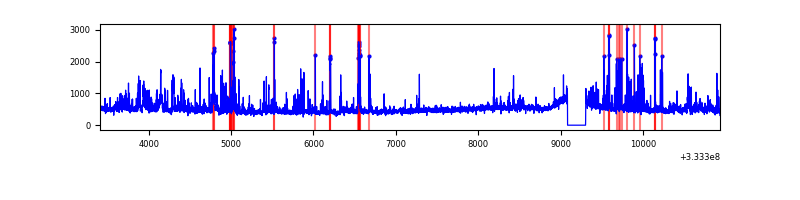 |
Top three noisy pixels from each quadrant. If the there are fewer than three noisy pixels in the level2.evt file, extra rows are filled as -1
| Pixel properties | Quadrant properties | ||||||
|---|---|---|---|---|---|---|---|
| Quadrant | DetID | PixID | Counts | Sigma | Mean | Median | Sigma |
| A | 0 | 13 | 42759 | 232.17 | 895 | 876 | 180.4 |
| A | 13 | 254 | 13440 | 69.64 | 895 | 876 | 180.4 |
| A | 3 | 137 | 8287 | 41.08 | 895 | 876 | 180.4 |
| B | 15 | 33 | 45885 | 265.95 | 886 | 865 | 169.3 |
| B | 0 | 190 | 30281 | 173.77 | 886 | 865 | 169.3 |
| B | 12 | 111 | 20634 | 116.78 | 886 | 865 | 169.3 |
| C | 14 | 238 | 135476 | 673.4 | 845 | 851 | 199.9 |
| C | 3 | 233 | 6785 | 29.68 | 845 | 851 | 199.9 |
| C | 13 | 61 | 5976 | 25.64 | 845 | 851 | 199.9 |
| D | 1 | 52 | 589961 | 2676.88 | 858 | 834 | 220.1 |
| D | 12 | 233 | 126785 | 572.3 | 858 | 834 | 220.1 |
| D | 8 | 195 | 46958 | 209.58 | 858 | 834 | 220.1 |
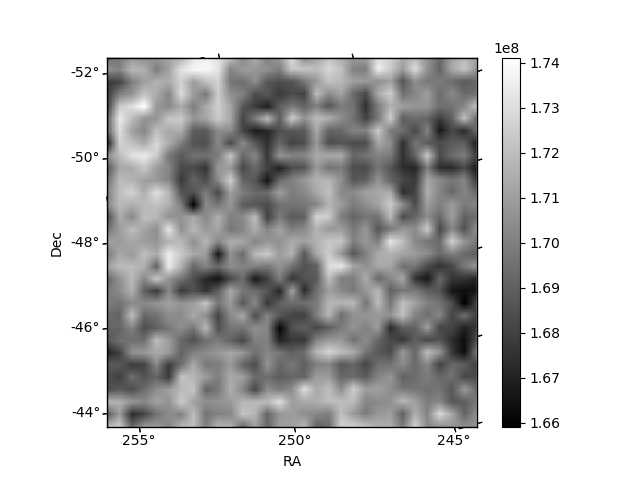
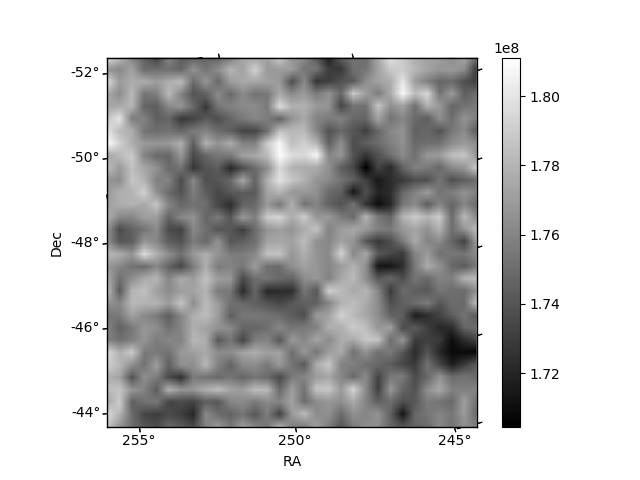
Histogram calculated using DETX and DETY for each event in the final _common_clean file
| Quadrant A | 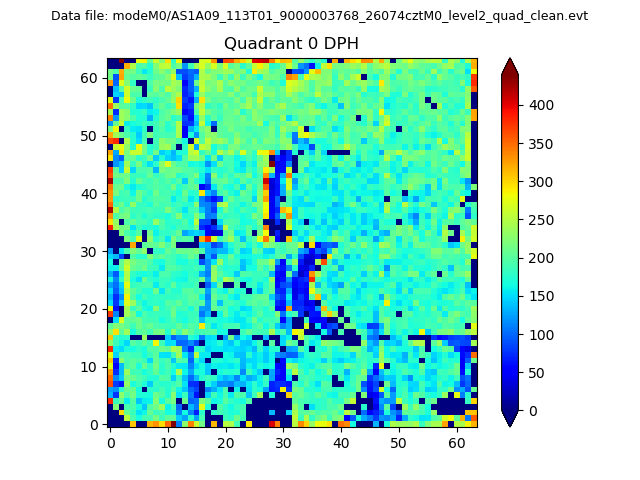 |
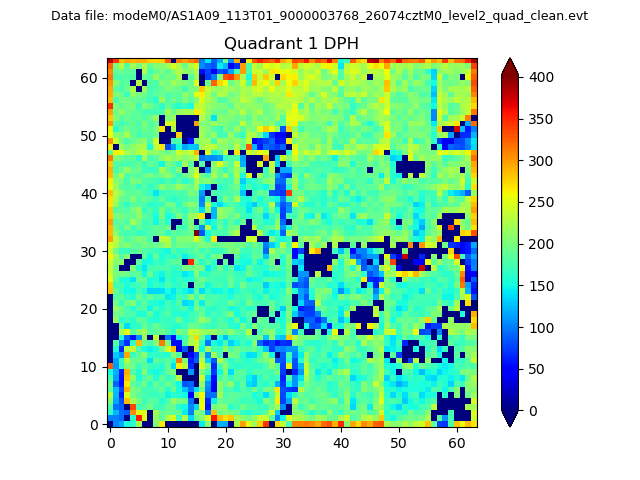 |
Quadrant B |
|---|---|---|---|
| Quadrant D | 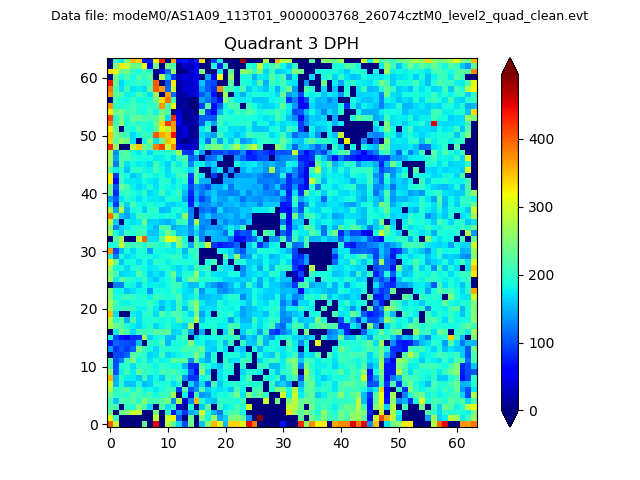 |
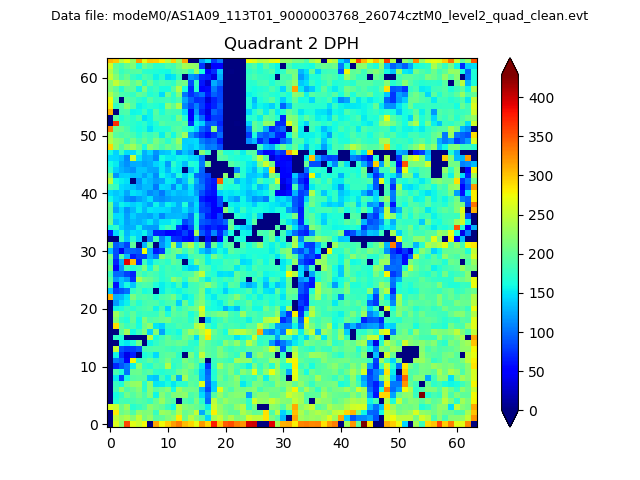 |
Quadrant C |
| Plot type | Count rate plots | Images |
|---|---|---|
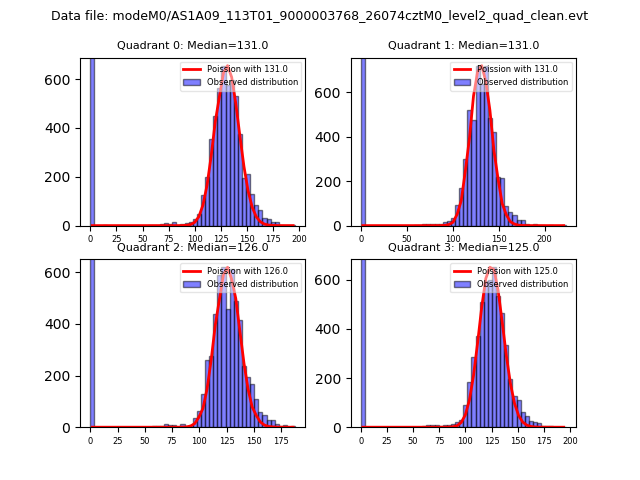
| Comparison with Poisson distribution Blue bars denote a histogram of data divided into 1 sec bins. Red curve is a Poisson curve with rate = median count rate of data. |
 |
 |
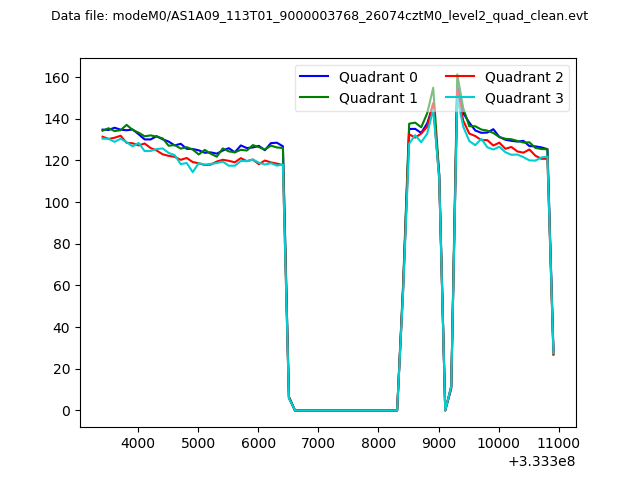
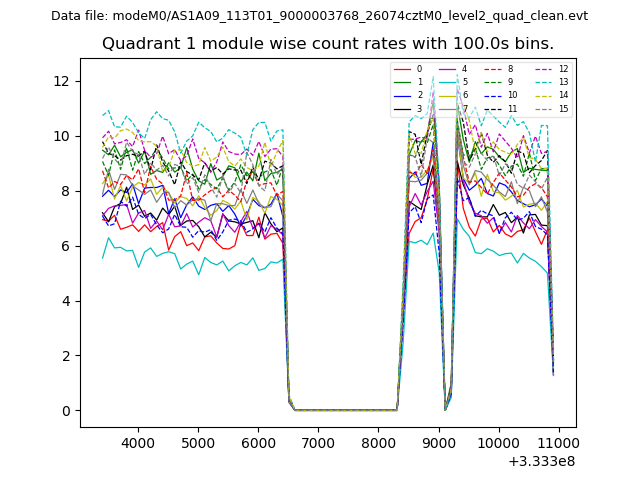
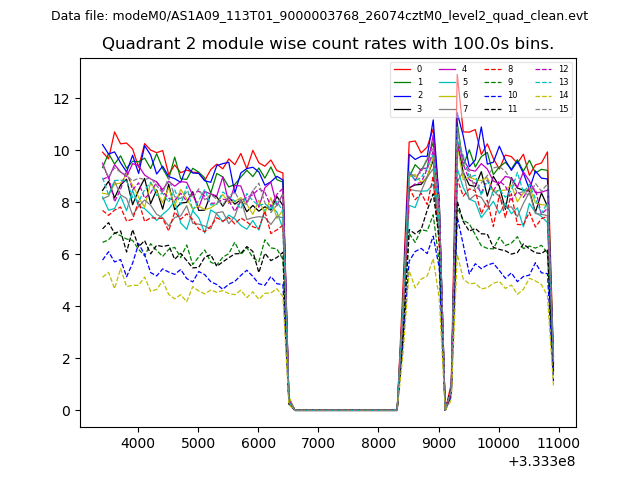
| Quadrant-wise count rates Data is divided into 100 sec bins |
 |
|
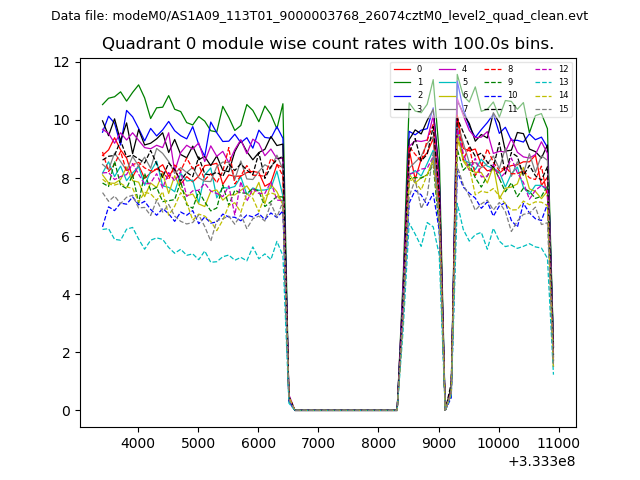
| Module-wise count rates for Quadrant A Data is divided into 100 sec bins |
 |
 |
| Module-wise count rates for Quadrant B Data is divided into 100 sec bins |
 |
 |
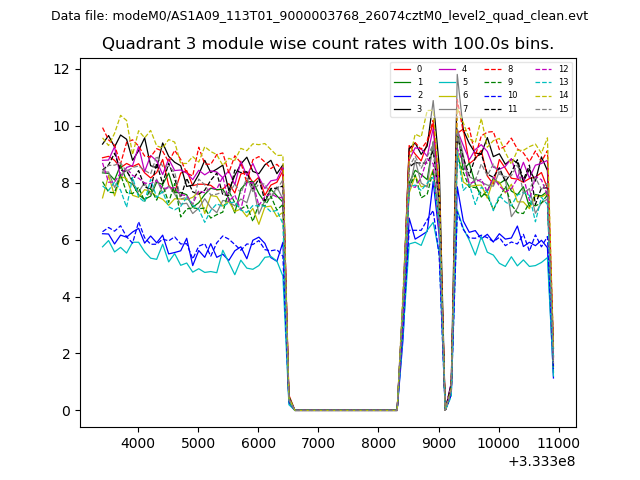
| Module-wise count rates for Quadrant C Data is divided into 100 sec bins |
 |
 |
| Module-wise count rates for Quadrant D Data is divided into 100 sec bins |
 |
 |
| Parameter | Plot |
|---|---|
| CZT HV Monitor | 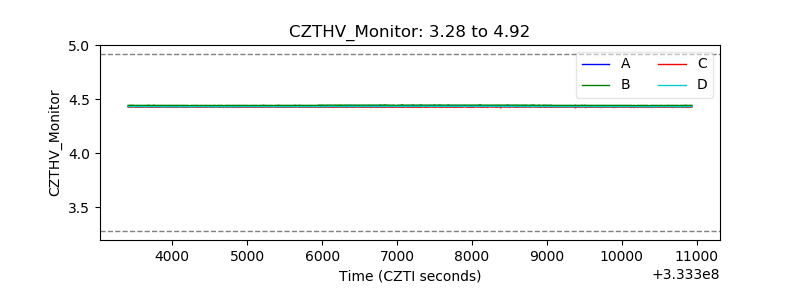 |
| D_VDD | 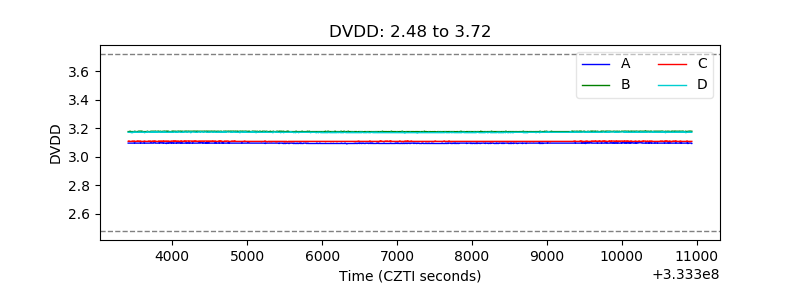 |
| Temperature 1 | 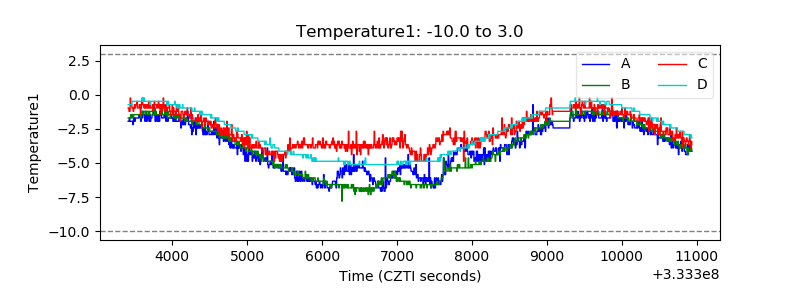 |
| Veto HV Monitor | 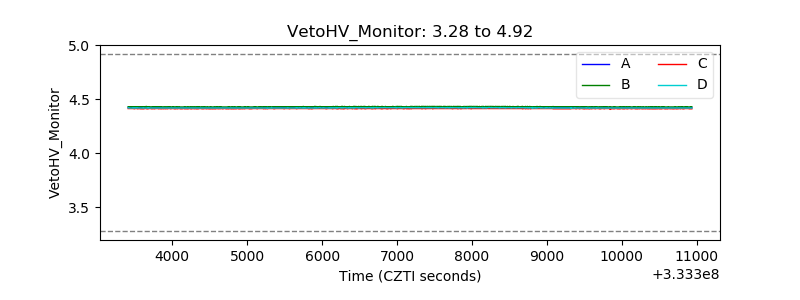 |
| Veto LLD | 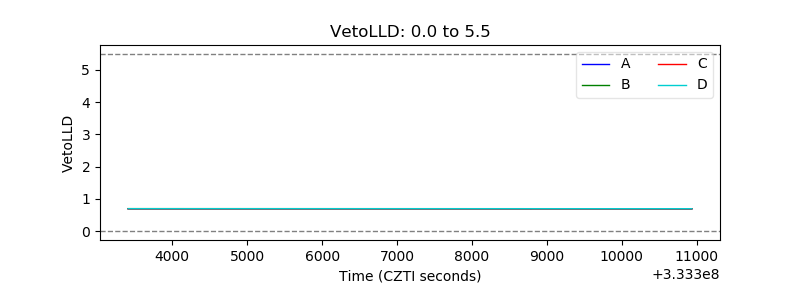 |
| Alpha Counter | 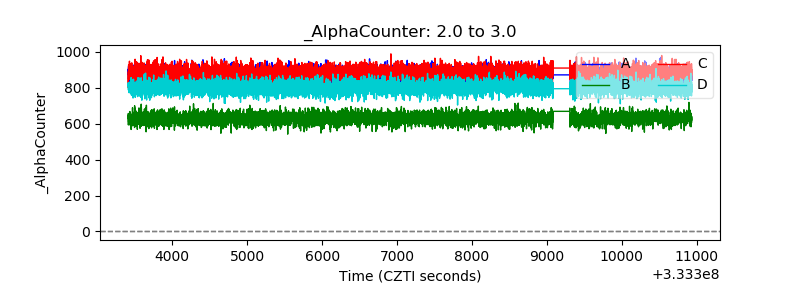 |
| _CPM_Rate | 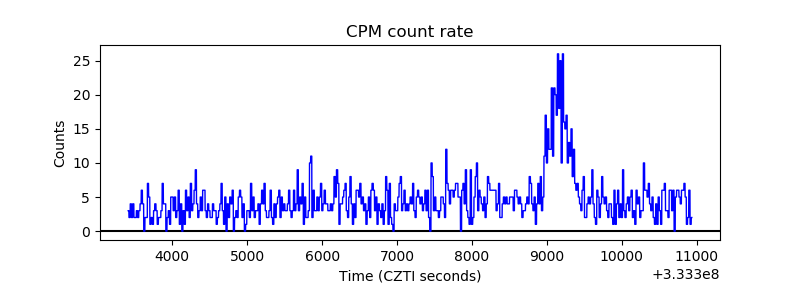 |
| CZT Counter | 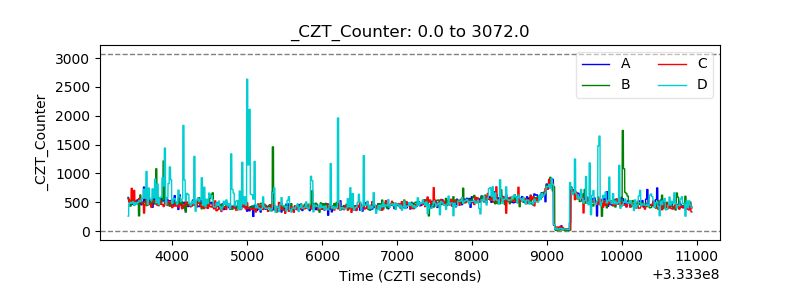 |
| +2.5 Volts monitor |  |
| +5 Volts monitor |  |
| _ROLL_ROT | 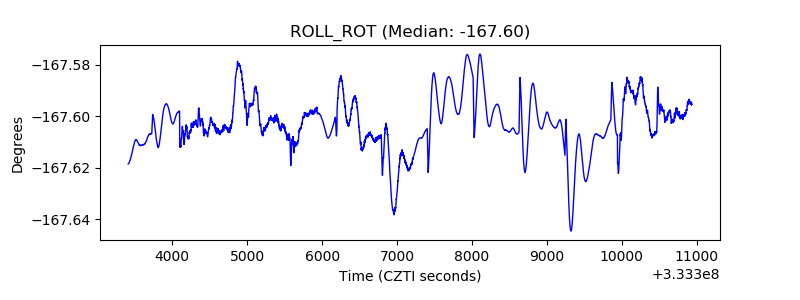 |
| _Roll_DEC |  |
| _Roll_RA | 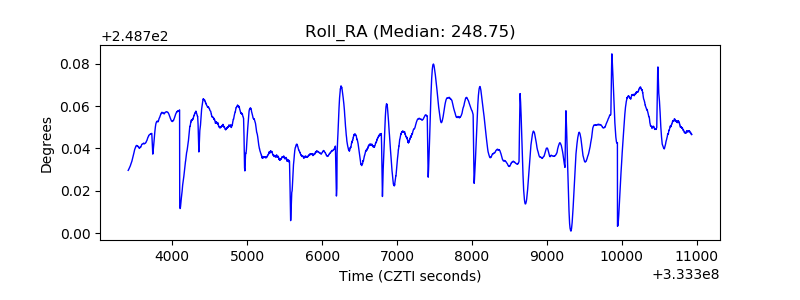 |
| Veto Counter | 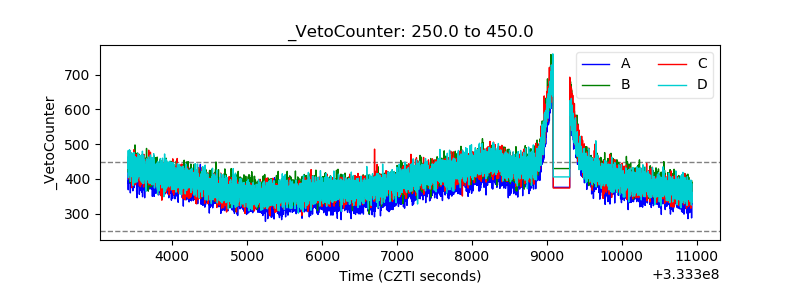 |