| Param | Original file | Final file |
|---|---|---|
| Filename | modeM0/AS1A09_113T01_9000003768_26075cztM0_level2.evt | modeM0/AS1A09_113T01_9000003768_26075cztM0_level2_quad_clean.evt |
| Size (bytes) | 513,169,920 | 110,856,960 |
| Size | 489.4 MB | 105.7 MB |
| Events in quadrant A | 3,550,255 | 725,424 |
| Events in quadrant B | 3,693,626 | 728,077 |
| Events in quadrant C | 3,512,538 | 697,516 |
| Events in quadrant D | 4,277,396 | 686,127 |
| Mode M9 | |||
|---|---|---|---|
| Quadrant | BADHDUFLAG | Total packets | Discarded packets |
| A | 0 | 4 | 0 |
| B | 0 | 4 | 0 |
| C | 0 | 4 | 0 |
| D | 0 | 4 | 0 |
| Mode M0 | |||
|---|---|---|---|
| Quadrant | BADHDUFLAG | Total packets | Discarded packets |
| A | 0 | 15472 | 0 |
| B | 0 | 15830 | 0 |
| C | 0 | 15446 | 0 |
| D | 0 | 17762 | 0 |
| Quadrant | Total seconds | Saturated seconds | Saturation percentage |
|---|---|---|---|
| A | 7474 | 15 | 0.200696% |
| B | 7475 | 37 | 0.494983% |
| C | 7475 | 59 | 0.789298% |
| D | 7475 | 146 | 1.953177% |
Noise dominated data is calculated using 1-second bins in cleaned event files. If a bin has >2000 counts, and if more than 50% of those come from <1% of pixels, then it is considered to be noise-dominated and hence unusable.
| Quadrant | # 1 sec bins | Bins with >0 counts | Bins with >2000 counts | High rate bins dominated by noise | Noise dominated (total time) | Noise dominated (detector-on time) | Marked lightcurve |
|---|---|---|---|---|---|---|---|
| A | 7889 | 7475 | 0 | 0 | 0.00% | 0.00% | 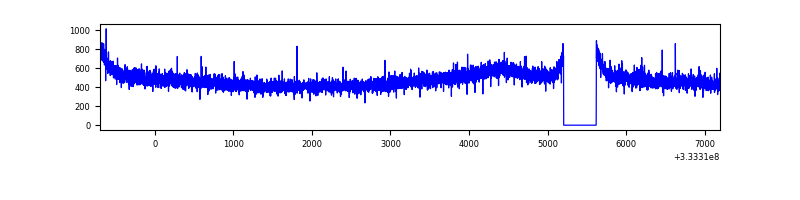 |
| B | 7890 | 7476 | 3 | 3 | 0.04% | 0.04% | 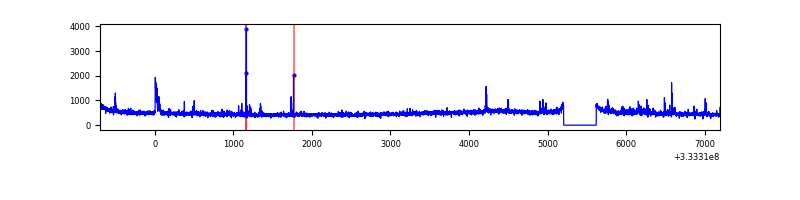 |
| C | 7890 | 7476 | 1 | 1 | 0.01% | 0.01% | 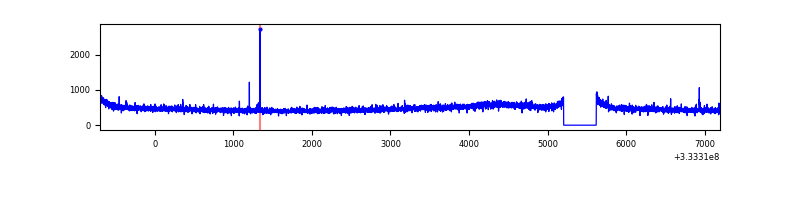 |
| D | 7890 | 7475 | 129 | 129 | 1.63% | 1.73% | 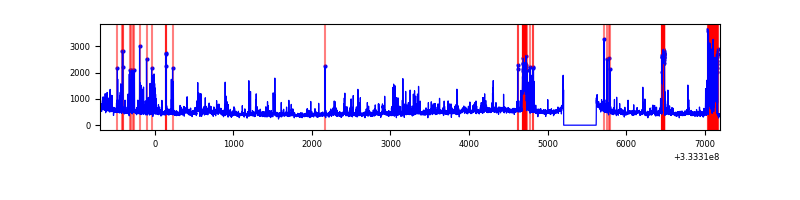 |
Top three noisy pixels from each quadrant. If the there are fewer than three noisy pixels in the level2.evt file, extra rows are filled as -1
| Pixel properties | Quadrant properties | ||||||
|---|---|---|---|---|---|---|---|
| Quadrant | DetID | PixID | Counts | Sigma | Mean | Median | Sigma |
| A | 0 | 13 | 26613 | 140.55 | 912 | 893 | 183.0 |
| A | 13 | 254 | 13717 | 70.08 | 912 | 893 | 183.0 |
| A | 3 | 137 | 8462 | 41.36 | 912 | 893 | 183.0 |
| B | 15 | 33 | 94032 | 535.81 | 903 | 881 | 173.9 |
| B | 0 | 190 | 21958 | 121.23 | 903 | 881 | 173.9 |
| B | 5 | 172 | 21220 | 116.99 | 903 | 881 | 173.9 |
| C | 14 | 238 | 138173 | 678.74 | 860 | 865 | 202.3 |
| C | 2 | 16 | 14038 | 65.12 | 860 | 865 | 202.3 |
| C | 3 | 233 | 7925 | 34.9 | 860 | 865 | 202.3 |
| D | 1 | 52 | 682165 | 3079.89 | 869 | 848 | 221.2 |
| D | 12 | 233 | 114818 | 515.2 | 869 | 848 | 221.2 |
| D | 9 | 35 | 81418 | 364.21 | 869 | 848 | 221.2 |
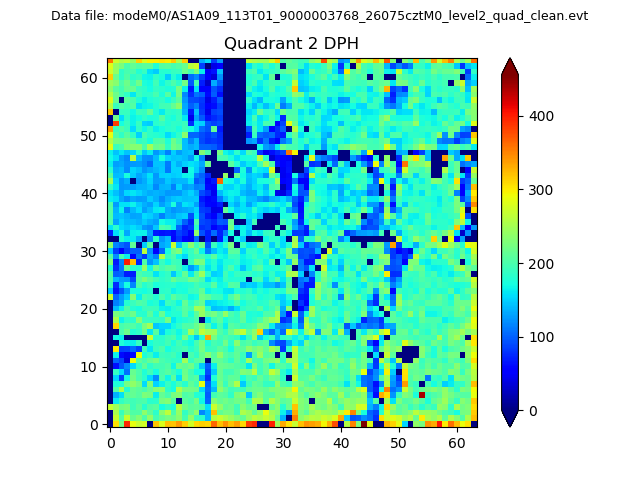
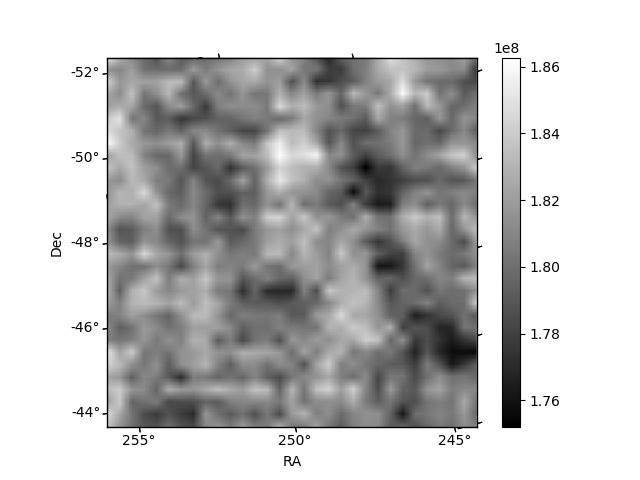
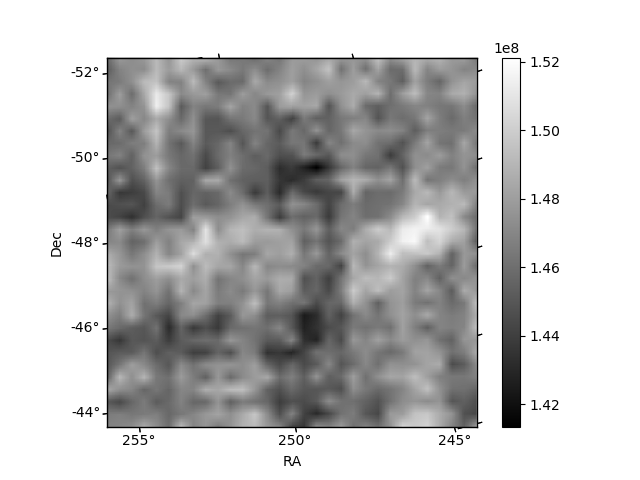
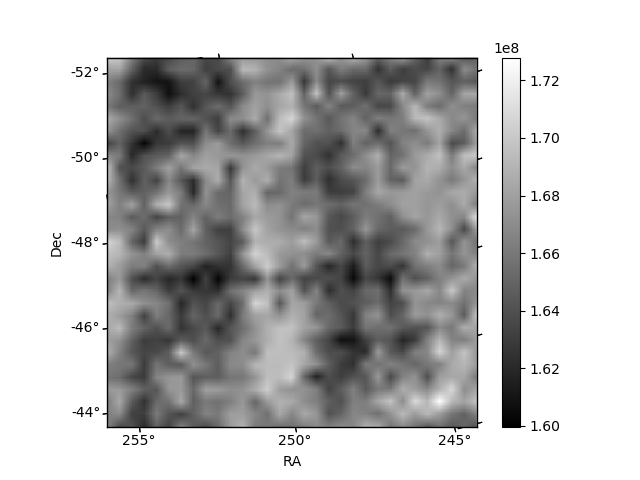
Histogram calculated using DETX and DETY for each event in the final _common_clean file
| Quadrant A | 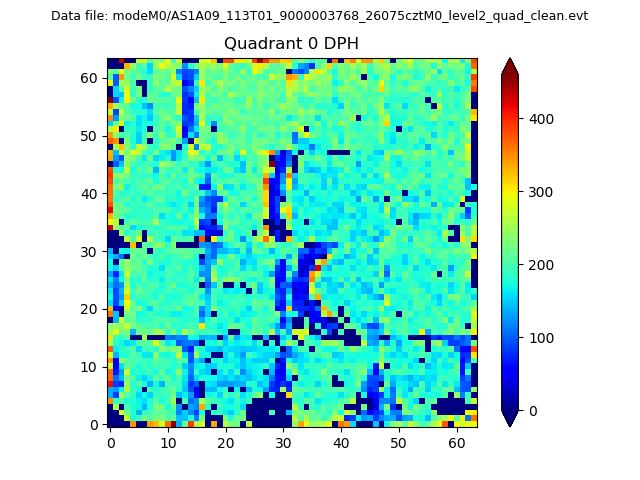 |
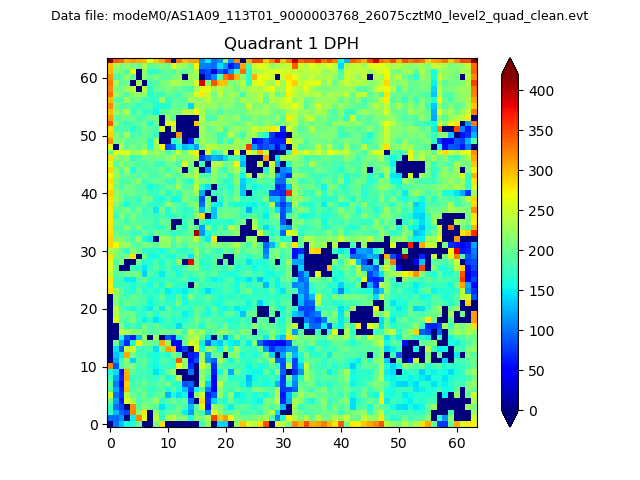 |
Quadrant B |
|---|---|---|---|
| Quadrant D | 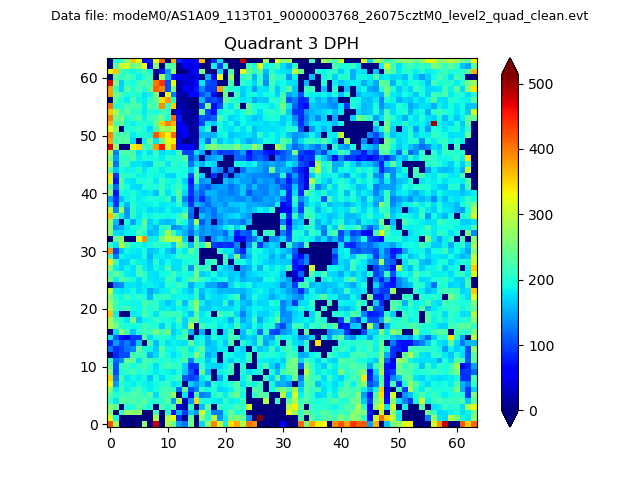 |
 |
Quadrant C |
| Plot type | Count rate plots | Images |
|---|---|---|
| Comparison with Poisson distribution Blue bars denote a histogram of data divided into 1 sec bins. Red curve is a Poisson curve with rate = median count rate of data. |
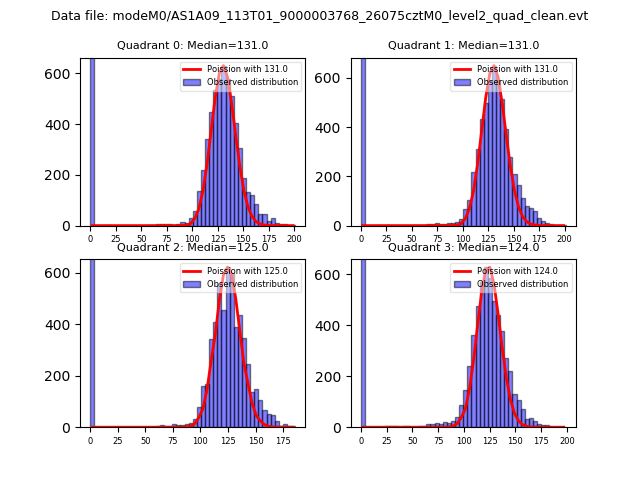 |
 |
| Quadrant-wise count rates Data is divided into 100 sec bins |
 |
|
| Module-wise count rates for Quadrant A Data is divided into 100 sec bins |
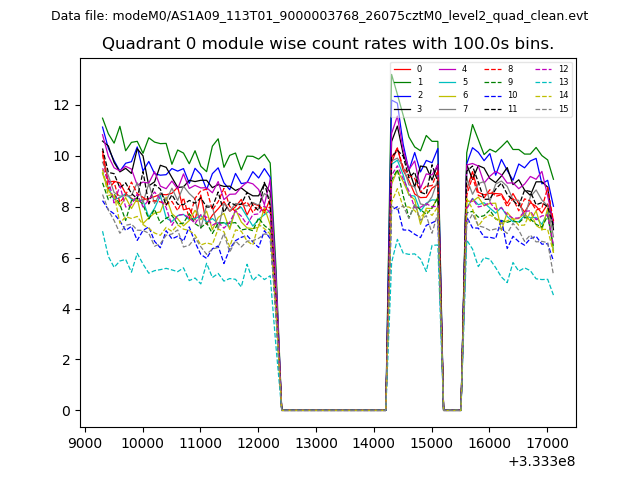 |
 |
| Module-wise count rates for Quadrant B Data is divided into 100 sec bins |
 |
 |
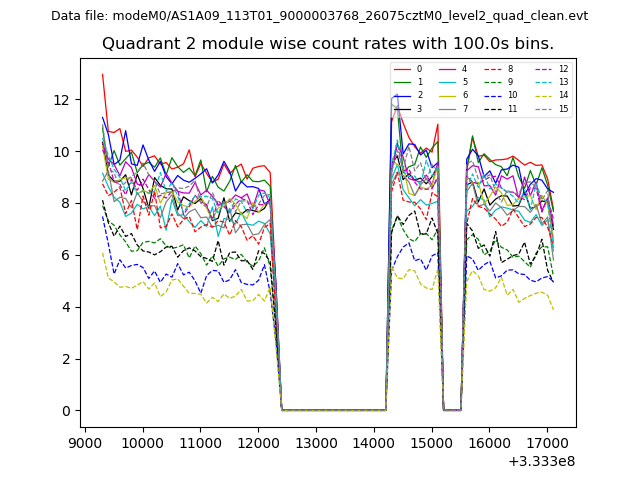
| Module-wise count rates for Quadrant C Data is divided into 100 sec bins |
 |
 |
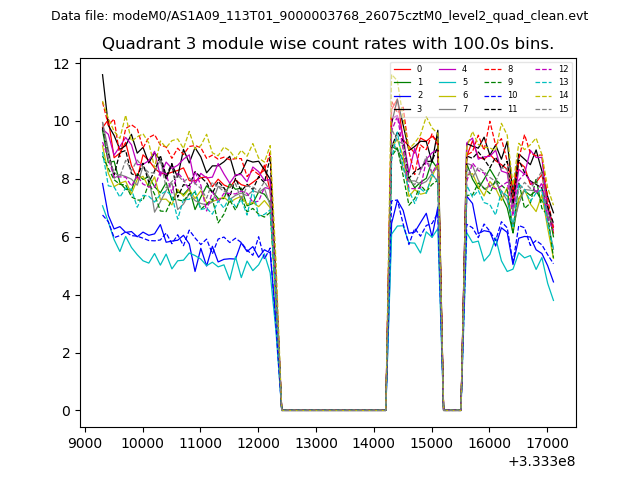
| Module-wise count rates for Quadrant D Data is divided into 100 sec bins |
 |
 |
| Parameter | Plot |
|---|---|
| CZT HV Monitor |  |
| D_VDD | 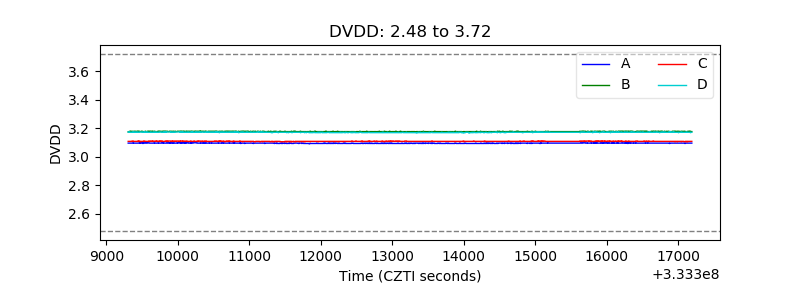 |
| Temperature 1 | 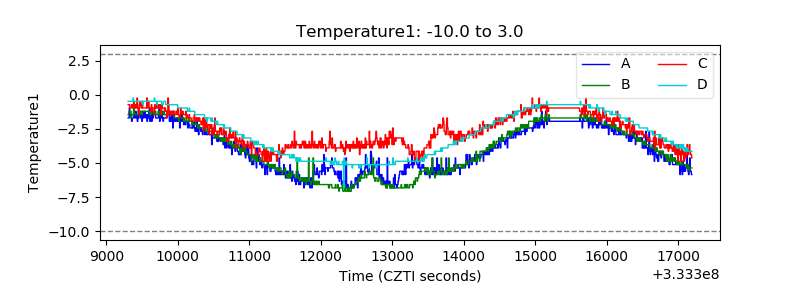 |
| Veto HV Monitor | 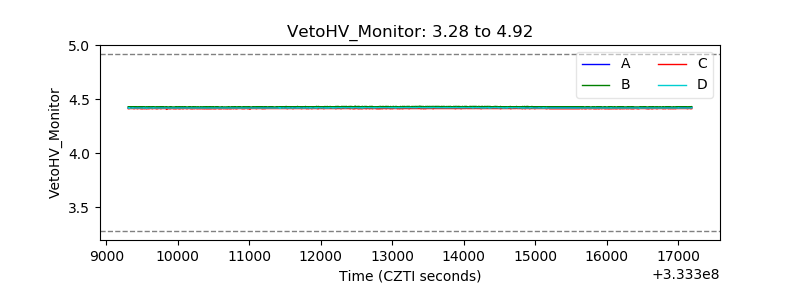 |
| Veto LLD | 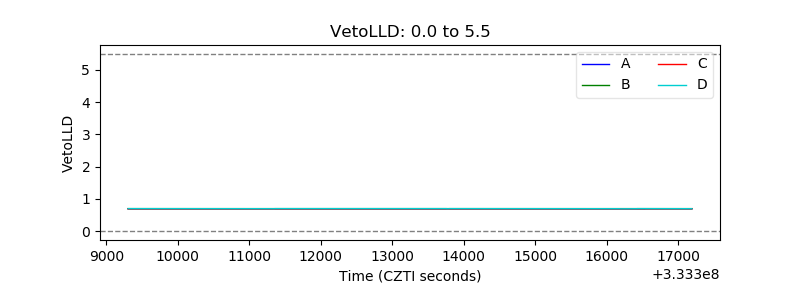 |
| Alpha Counter |  |
| _CPM_Rate |  |
| CZT Counter | 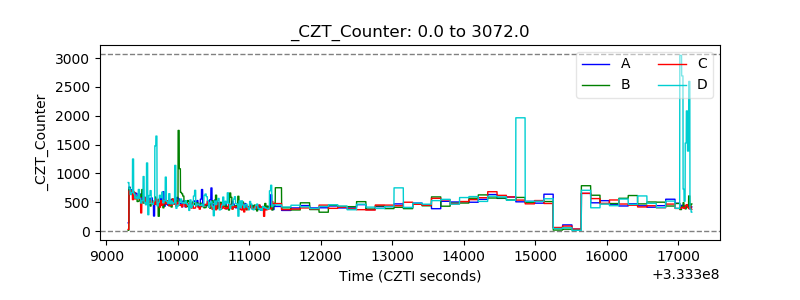 |
| +2.5 Volts monitor |  |
| +5 Volts monitor |  |
| _ROLL_ROT | 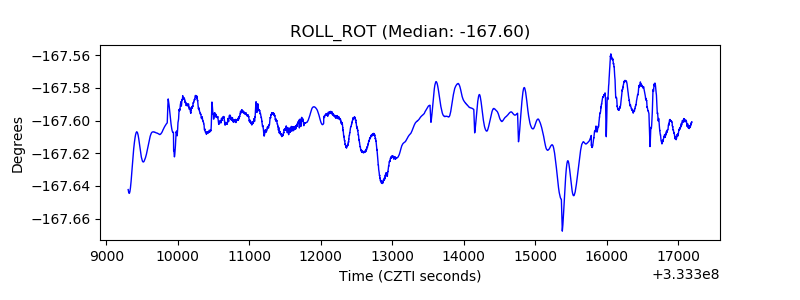 |
| _Roll_DEC | 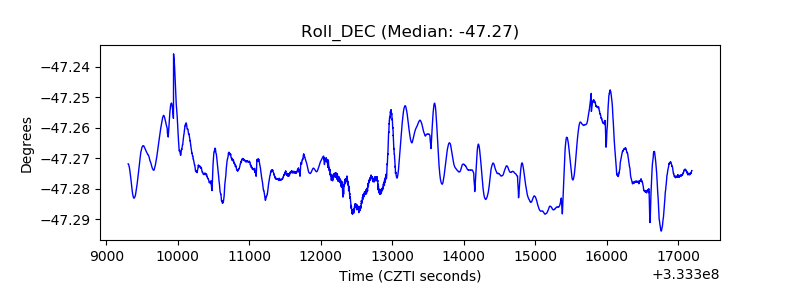 |
| _Roll_RA | 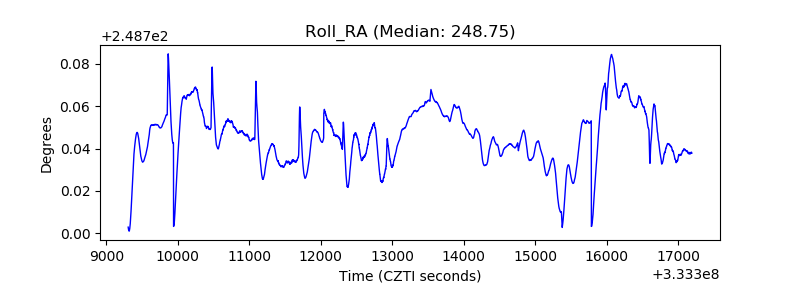 |
| Veto Counter | 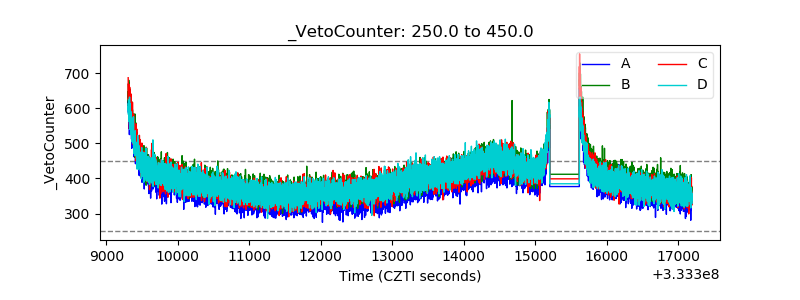 |