| Param | Original file | Final file |
|---|---|---|
| Filename | modeM0/AS1A09_113T01_9000003768_26077cztM0_level2.evt | modeM0/AS1A09_113T01_9000003768_26077cztM0_level2_quad_clean.evt |
| Size (bytes) | 850,322,880 | 179,167,680 |
| Size | 810.9 MB | 170.9 MB |
| Events in quadrant A | 5,924,534 | 1,160,990 |
| Events in quadrant B | 6,154,696 | 1,166,337 |
| Events in quadrant C | 5,953,805 | 1,113,362 |
| Events in quadrant D | 6,854,981 | 1,104,121 |
| Mode M9 | |||
|---|---|---|---|
| Quadrant | BADHDUFLAG | Total packets | Discarded packets |
| A | 0 | 16 | 0 |
| B | 0 | 17 | 0 |
| C | 0 | 17 | 0 |
| D | 0 | 17 | 0 |
| Mode M0 | |||
|---|---|---|---|
| Quadrant | BADHDUFLAG | Total packets | Discarded packets |
| A | 0 | 25997 | 0 |
| B | 0 | 26597 | 0 |
| C | 0 | 26036 | 0 |
| D | 0 | 29153 | 0 |
| Quadrant | Total seconds | Saturated seconds | Saturation percentage |
|---|---|---|---|
| A | 12756 | 17 | 0.133271% |
| B | 12756 | 43 | 0.337096% |
| C | 12756 | 87 | 0.682032% |
| D | 12755 | 274 | 2.148177% |
Noise dominated data is calculated using 1-second bins in cleaned event files. If a bin has >2000 counts, and if more than 50% of those come from <1% of pixels, then it is considered to be noise-dominated and hence unusable.
| Quadrant | # 1 sec bins | Bins with >0 counts | Bins with >2000 counts | High rate bins dominated by noise | Noise dominated (total time) | Noise dominated (detector-on time) | Marked lightcurve |
|---|---|---|---|---|---|---|---|
| A | 14136 | 12758 | 0 | 0 | 0.00% | 0.00% | 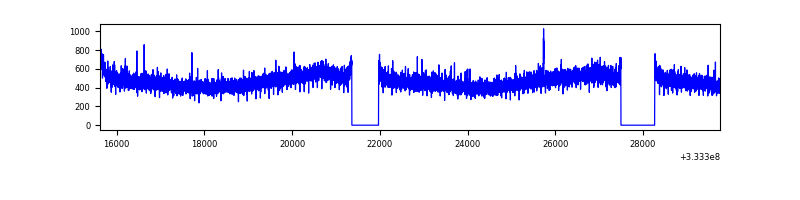 |
| B | 14136 | 12756 | 2 | 2 | 0.01% | 0.02% | 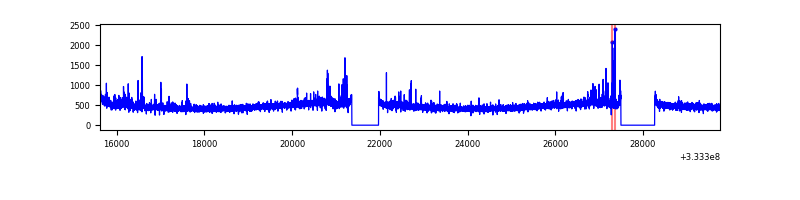 |
| C | 14136 | 12757 | 0 | 0 | 0.00% | 0.00% | 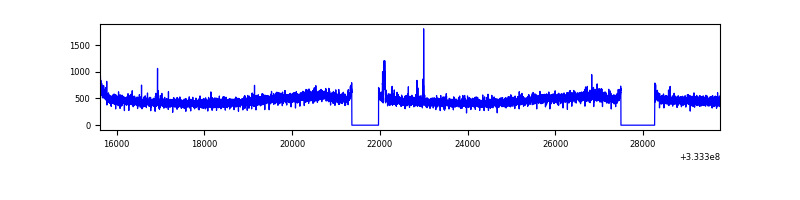 |
| D | 14135 | 12757 | 244 | 244 | 1.73% | 1.91% | 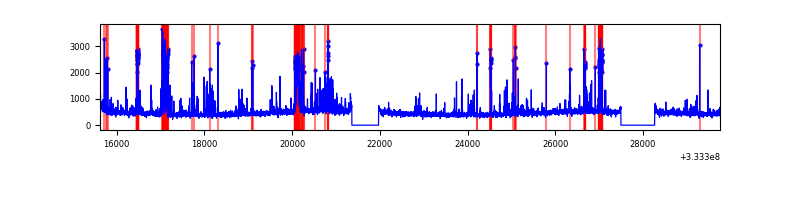 |
Top three noisy pixels from each quadrant. If the there are fewer than three noisy pixels in the level2.evt file, extra rows are filled as -1
| Pixel properties | Quadrant properties | ||||||
|---|---|---|---|---|---|---|---|
| Quadrant | DetID | PixID | Counts | Sigma | Mean | Median | Sigma |
| A | 0 | 13 | 32408 | 101.04 | 1527 | 1497 | 305.9 |
| A | 13 | 254 | 21554 | 65.56 | 1527 | 1497 | 305.9 |
| A | 3 | 137 | 14381 | 42.11 | 1527 | 1497 | 305.9 |
| B | 15 | 33 | 93865 | 317.6 | 1521 | 1483 | 290.9 |
| B | 0 | 190 | 44365 | 147.42 | 1521 | 1483 | 290.9 |
| B | 12 | 111 | 35929 | 118.42 | 1521 | 1483 | 290.9 |
| C | 14 | 238 | 231599 | 676.48 | 1449 | 1456 | 340.2 |
| C | 3 | 233 | 41602 | 118.0 | 1449 | 1456 | 340.2 |
| C | 2 | 16 | 18105 | 48.94 | 1449 | 1456 | 340.2 |
| D | 1 | 52 | 925359 | 2564.89 | 1454 | 1418 | 360.2 |
| D | 12 | 233 | 217378 | 599.51 | 1454 | 1418 | 360.2 |
| D | 9 | 35 | 80464 | 219.43 | 1454 | 1418 | 360.2 |
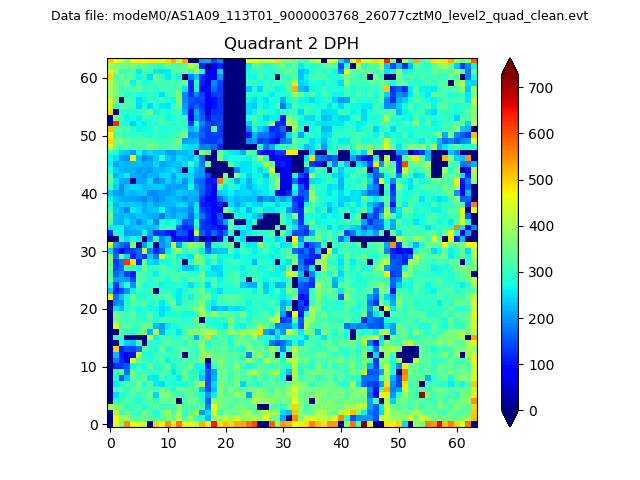
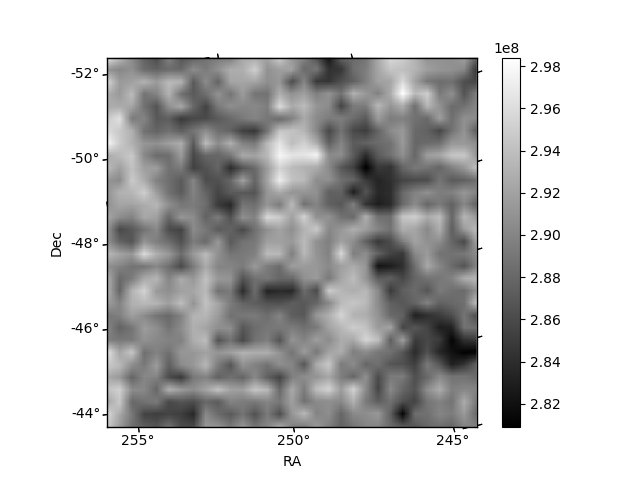
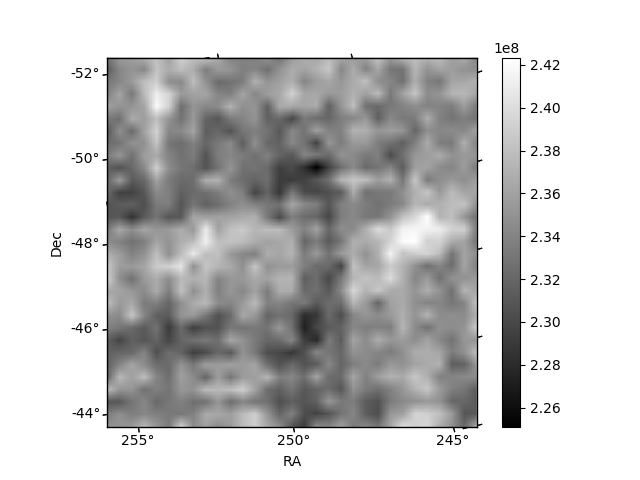
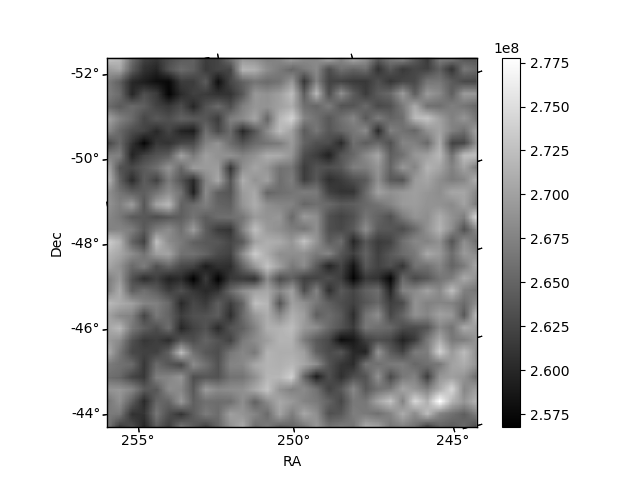
Histogram calculated using DETX and DETY for each event in the final _common_clean file
| Quadrant A | 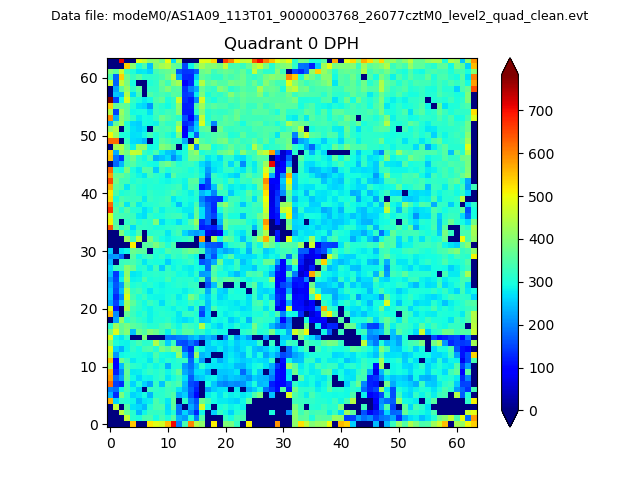 |
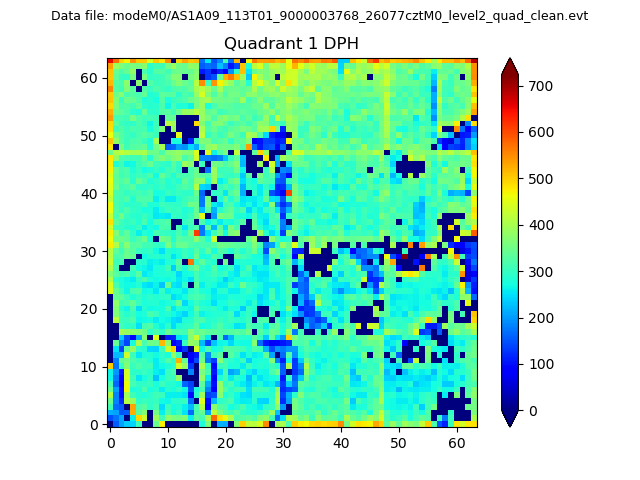 |
Quadrant B |
|---|---|---|---|
| Quadrant D | 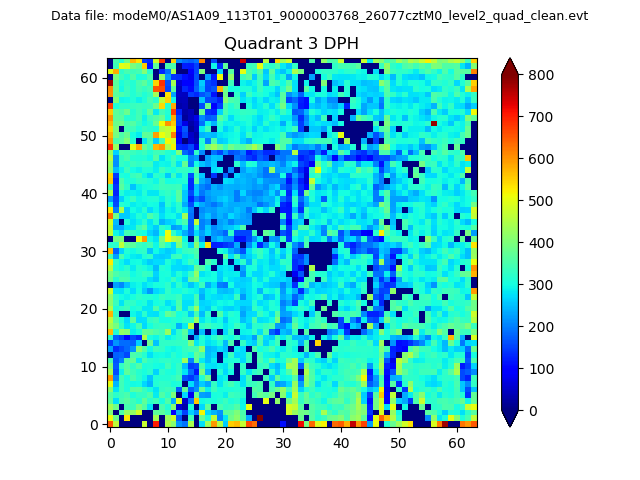 |
 |
Quadrant C |
| Plot type | Count rate plots | Images |
|---|---|---|
| Comparison with Poisson distribution Blue bars denote a histogram of data divided into 1 sec bins. Red curve is a Poisson curve with rate = median count rate of data. |
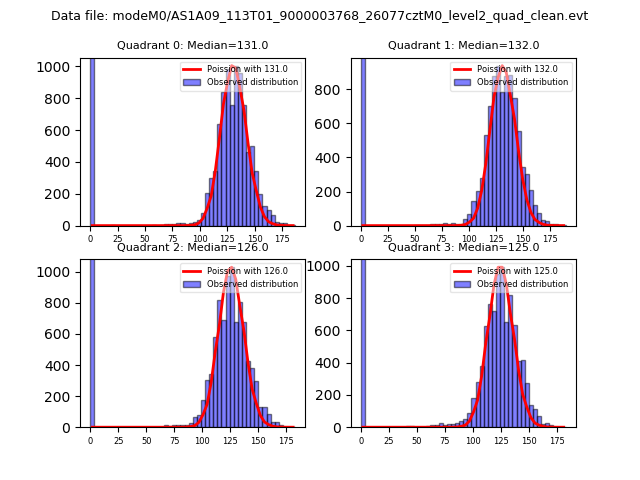 |
 |
| Quadrant-wise count rates Data is divided into 100 sec bins |
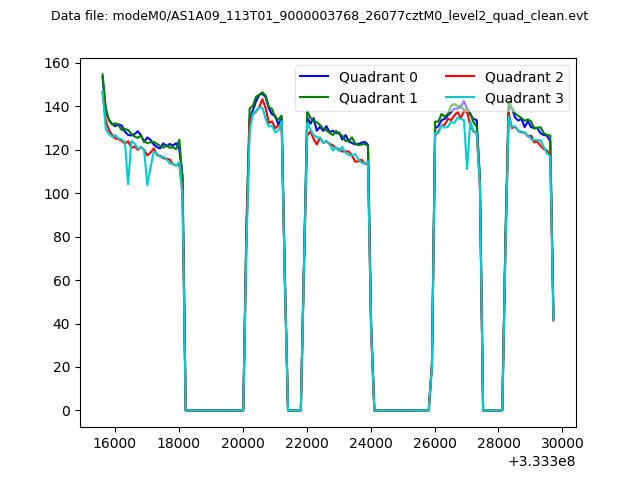 |
|
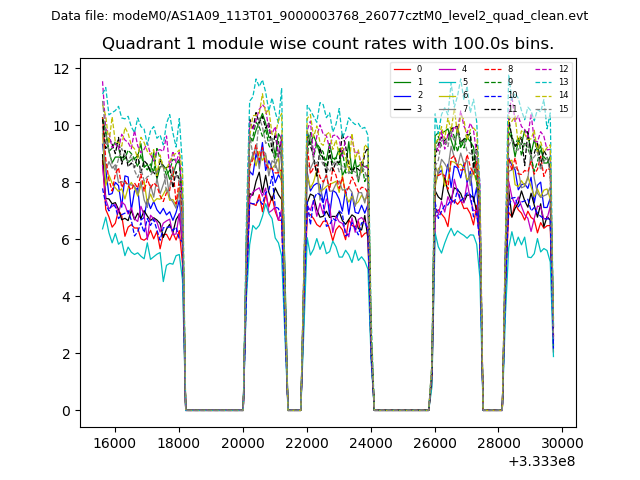
| Module-wise count rates for Quadrant A Data is divided into 100 sec bins |
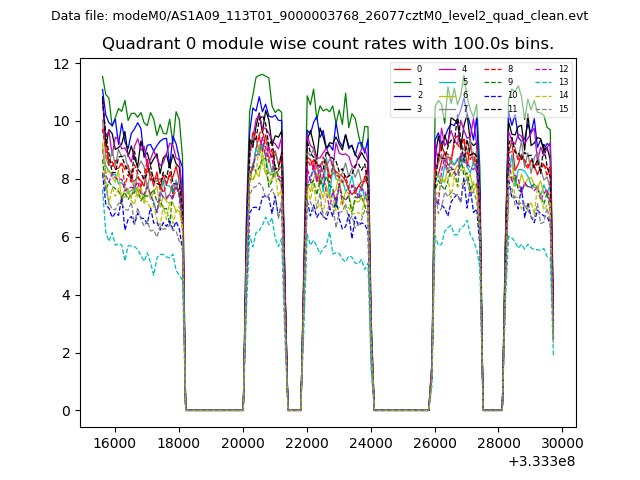 |
 |
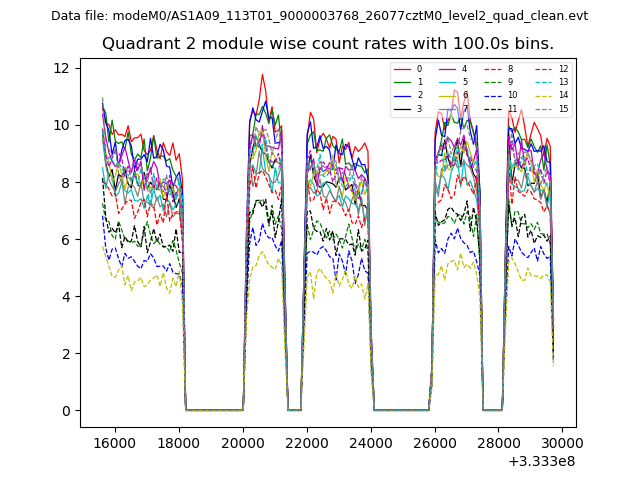
| Module-wise count rates for Quadrant B Data is divided into 100 sec bins |
 |
 |
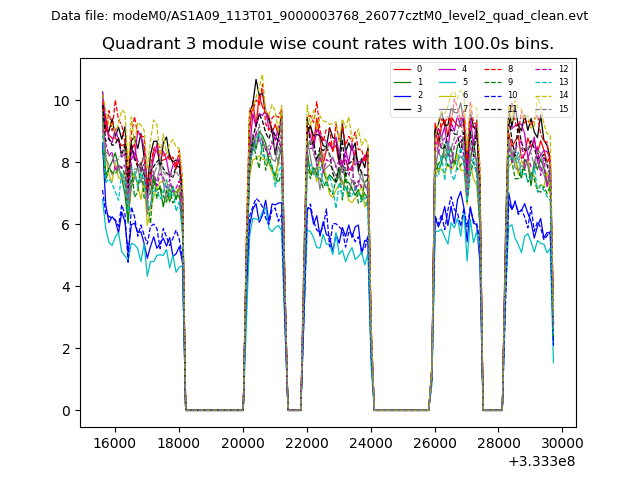
| Module-wise count rates for Quadrant C Data is divided into 100 sec bins |
 |
 |
| Module-wise count rates for Quadrant D Data is divided into 100 sec bins |
 |
 |
| Parameter | Plot |
|---|---|
| CZT HV Monitor | 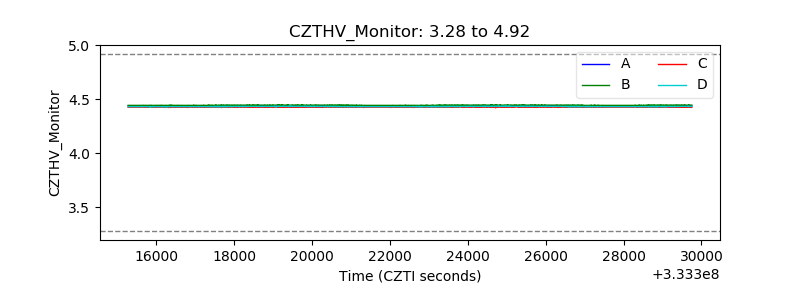 |
| D_VDD | 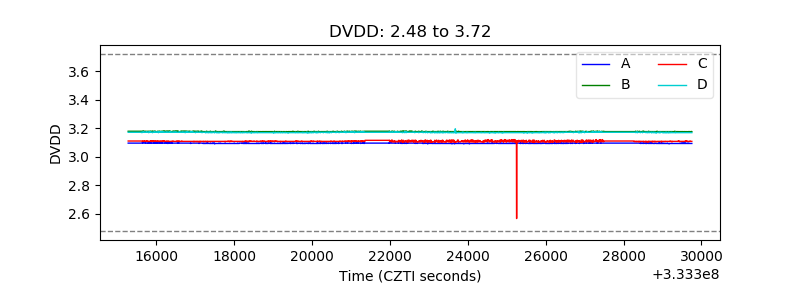 |
| Temperature 1 | 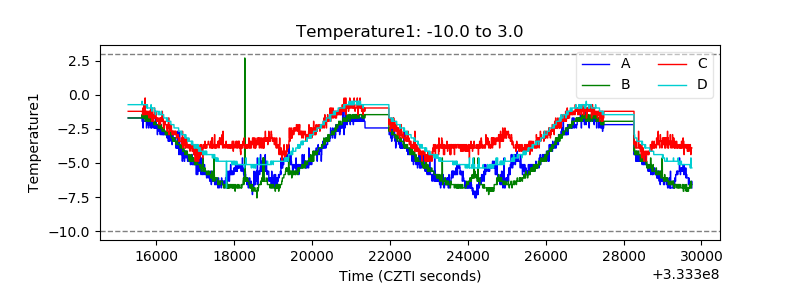 |
| Veto HV Monitor | 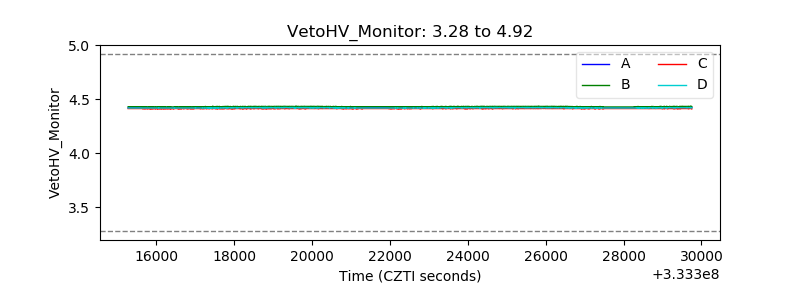 |
| Veto LLD | 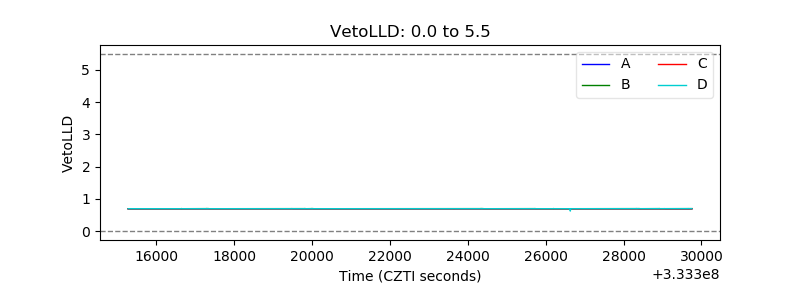 |
| Alpha Counter | 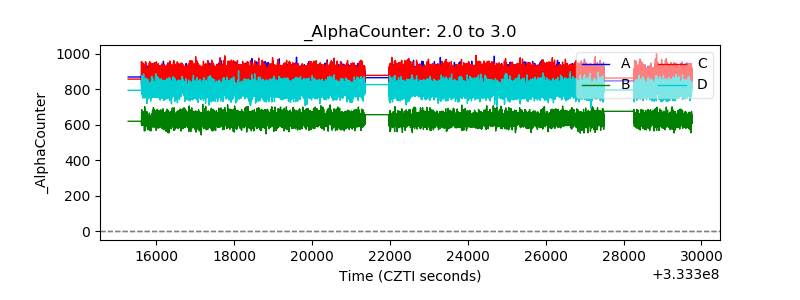 |
| _CPM_Rate | 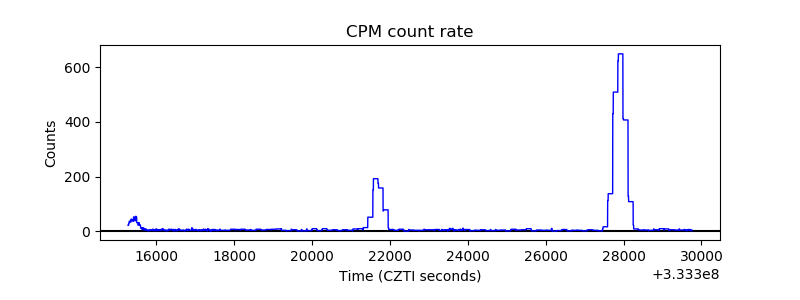 |
| CZT Counter | 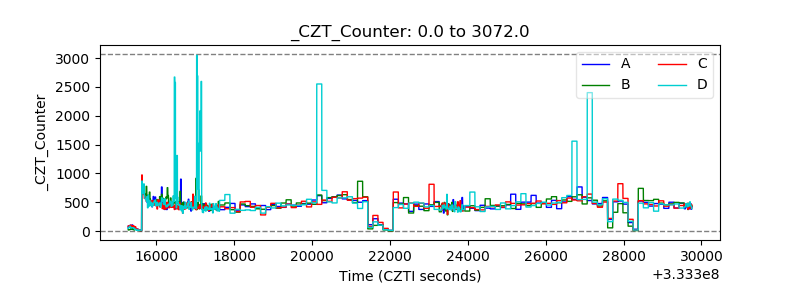 |
| +2.5 Volts monitor |  |
| +5 Volts monitor | 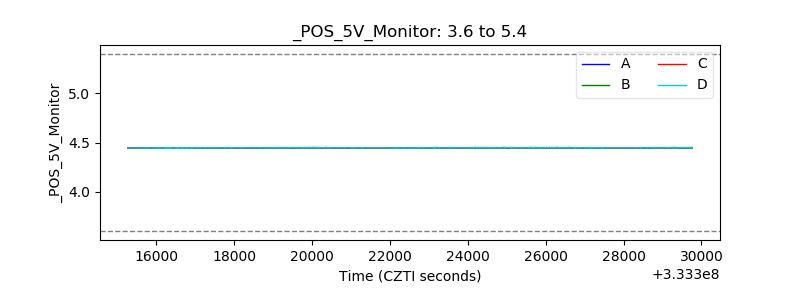 |
| _ROLL_ROT | 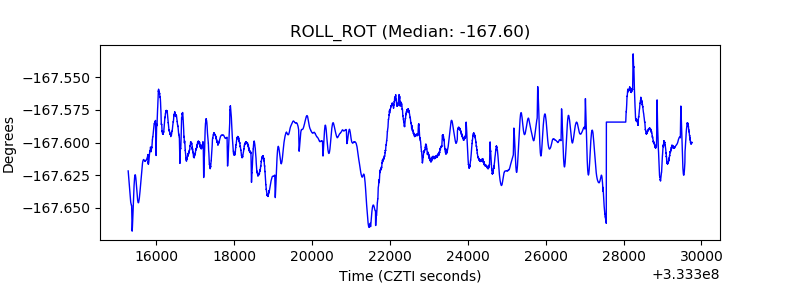 |
| _Roll_DEC | 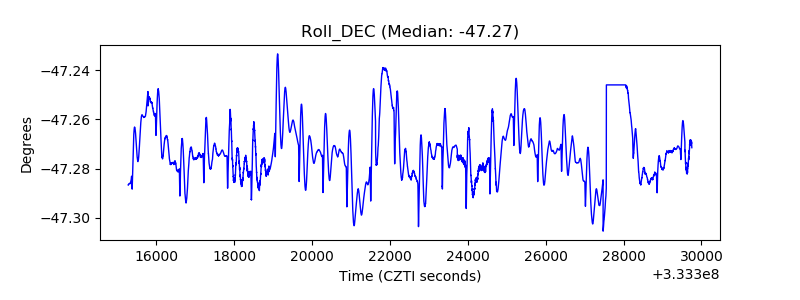 |
| _Roll_RA | 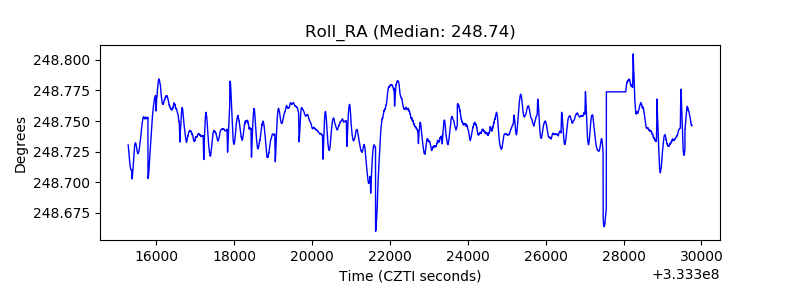 |
| Veto Counter |  |