| Param | Original file | Final file |
|---|---|---|
| Filename | modeM0/AS1A09_113T01_9000003768_26078cztM0_level2.evt | modeM0/AS1A09_113T01_9000003768_26078cztM0_level2_quad_clean.evt |
| Size (bytes) | 478,638,720 | 103,743,360 |
| Size | 456.5 MB | 98.9 MB |
| Events in quadrant A | 3,401,428 | 667,892 |
| Events in quadrant B | 3,555,307 | 676,772 |
| Events in quadrant C | 3,442,754 | 646,166 |
| Events in quadrant D | 3,599,459 | 642,377 |
| Mode M9 | |||
|---|---|---|---|
| Quadrant | BADHDUFLAG | Total packets | Discarded packets |
| A | 0 | 16 | 0 |
| B | 0 | 16 | 0 |
| C | 0 | 16 | 0 |
| D | 0 | 16 | 0 |
| Mode M0 | |||
|---|---|---|---|
| Quadrant | BADHDUFLAG | Total packets | Discarded packets |
| A | 0 | 14812 | 0 |
| B | 0 | 15163 | 0 |
| C | 0 | 14840 | 0 |
| D | 0 | 15395 | 0 |
| Quadrant | Total seconds | Saturated seconds | Saturation percentage |
|---|---|---|---|
| A | 7302 | 27 | 0.369762% |
| B | 7303 | 51 | 0.698343% |
| C | 7303 | 58 | 0.794194% |
| D | 7303 | 34 | 0.465562% |
Noise dominated data is calculated using 1-second bins in cleaned event files. If a bin has >2000 counts, and if more than 50% of those come from <1% of pixels, then it is considered to be noise-dominated and hence unusable.
| Quadrant | # 1 sec bins | Bins with >0 counts | Bins with >2000 counts | High rate bins dominated by noise | Noise dominated (total time) | Noise dominated (detector-on time) | Marked lightcurve |
|---|---|---|---|---|---|---|---|
| A | 8992 | 7303 | 0 | 0 | 0.00% | 0.00% | 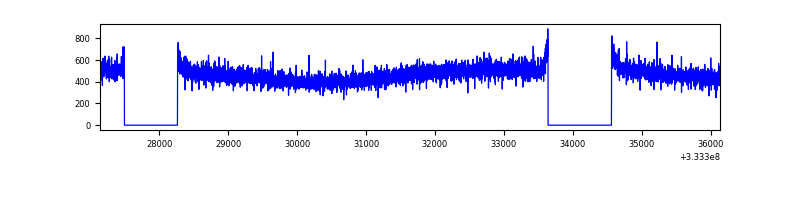 |
| B | 8993 | 7303 | 8 | 8 | 0.09% | 0.11% | 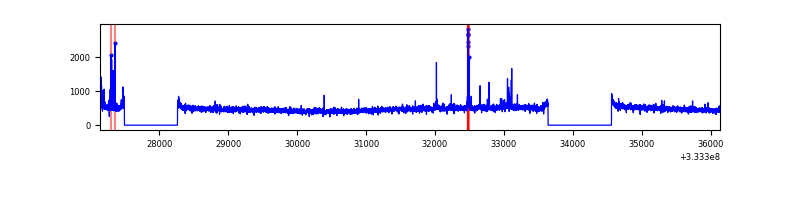 |
| C | 8993 | 7303 | 0 | 0 | 0.00% | 0.00% | 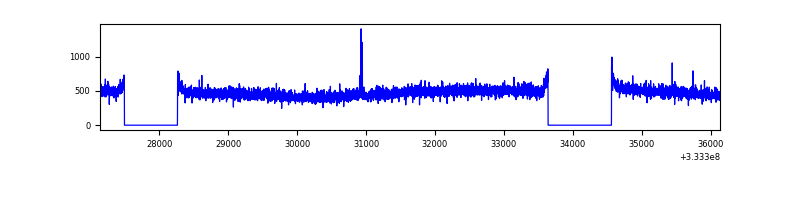 |
| D | 8993 | 7304 | 13 | 13 | 0.14% | 0.18% | 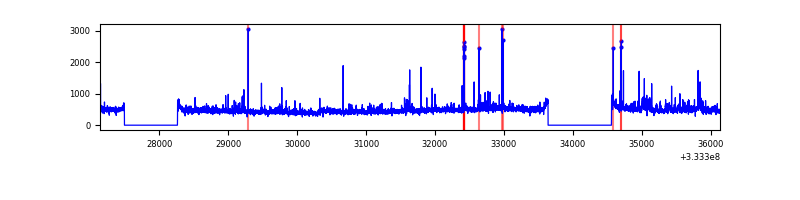 |
Top three noisy pixels from each quadrant. If the there are fewer than three noisy pixels in the level2.evt file, extra rows are filled as -1
| Pixel properties | Quadrant properties | ||||||
|---|---|---|---|---|---|---|---|
| Quadrant | DetID | PixID | Counts | Sigma | Mean | Median | Sigma |
| A | 13 | 254 | 11846 | 61.91 | 881 | 863 | 177.4 |
| A | 3 | 137 | 8210 | 41.41 | 881 | 863 | 177.4 |
| A | 0 | 226 | 7522 | 37.53 | 881 | 863 | 177.4 |
| B | 0 | 245 | 24507 | 140.76 | 881 | 858 | 168.0 |
| B | 10 | 247 | 22609 | 129.46 | 881 | 858 | 168.0 |
| B | 15 | 33 | 22343 | 127.88 | 881 | 858 | 168.0 |
| C | 14 | 238 | 135105 | 678.73 | 844 | 849 | 197.8 |
| C | 3 | 233 | 11641 | 54.56 | 844 | 849 | 197.8 |
| C | 2 | 16 | 8494 | 38.65 | 844 | 849 | 197.8 |
| D | 1 | 52 | 267091 | 1297.35 | 850 | 830 | 205.2 |
| D | 7 | 80 | 79494 | 383.29 | 850 | 830 | 205.2 |
| D | 2 | 234 | 28125 | 132.99 | 850 | 830 | 205.2 |
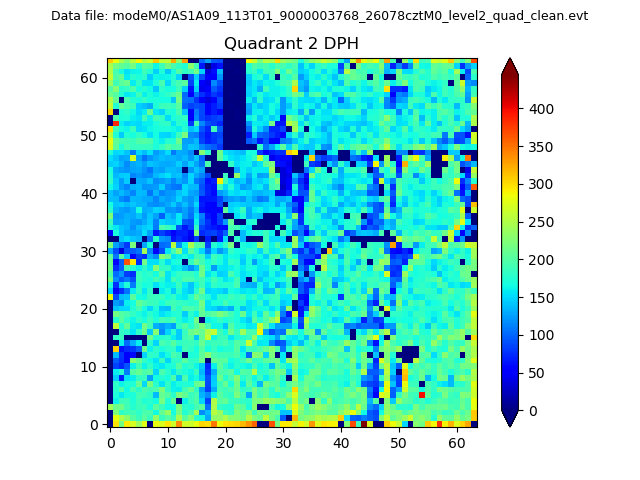
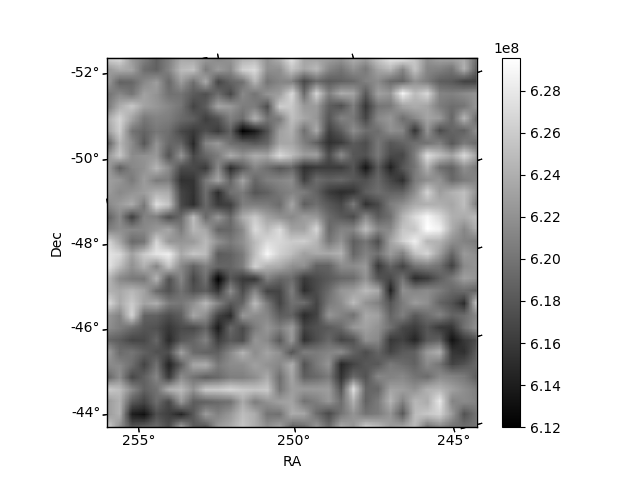
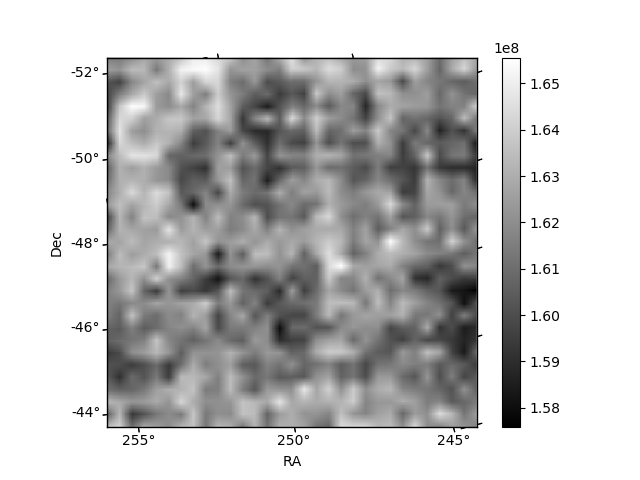
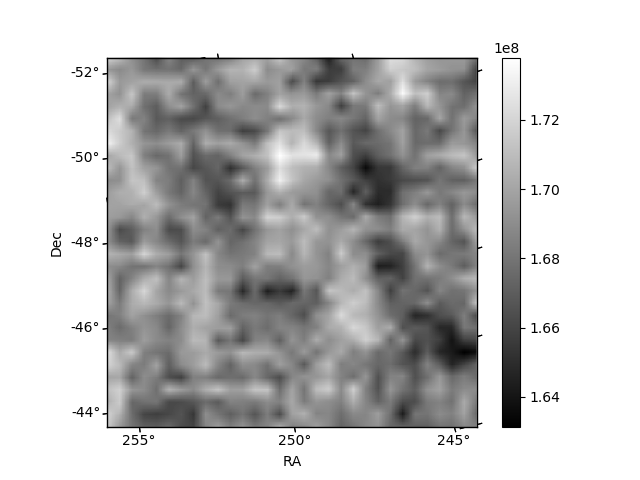
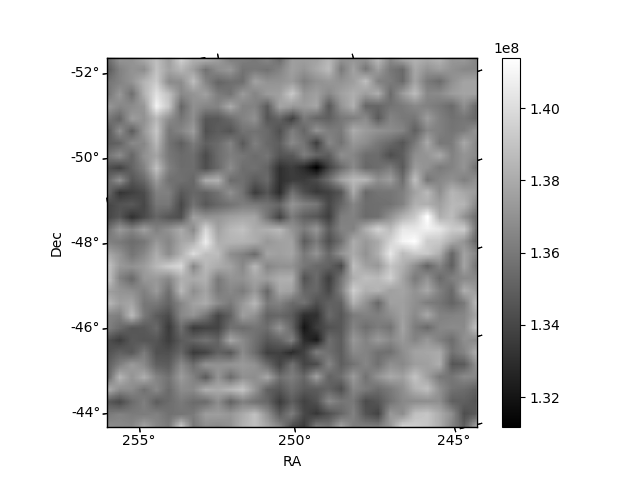
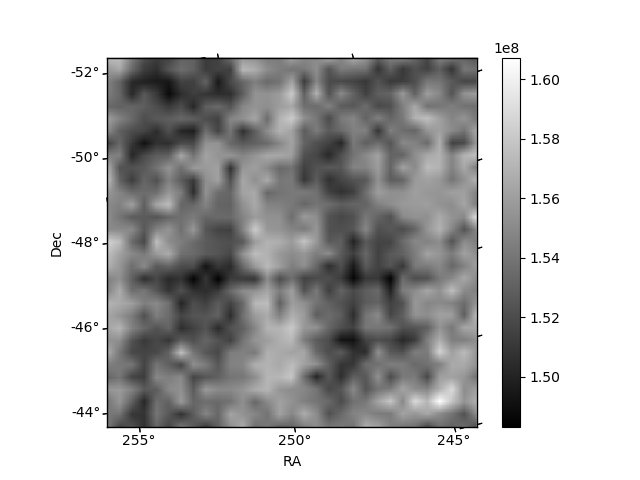
Histogram calculated using DETX and DETY for each event in the final _common_clean file
| Quadrant A | 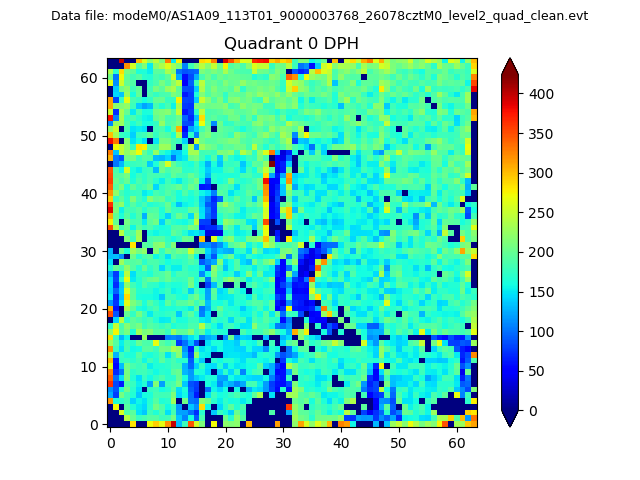 |
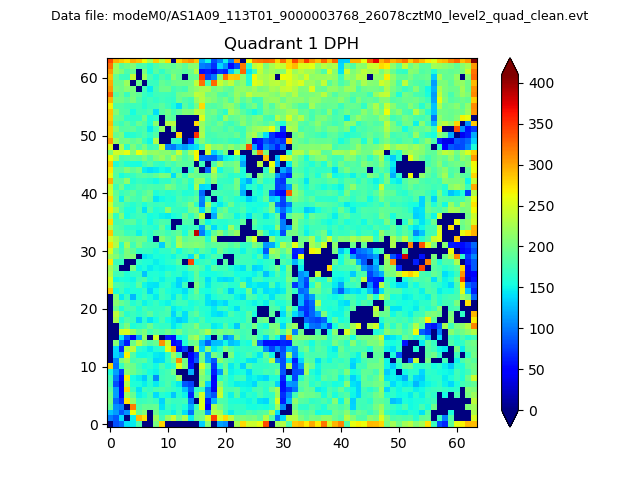 |
Quadrant B |
|---|---|---|---|
| Quadrant D | 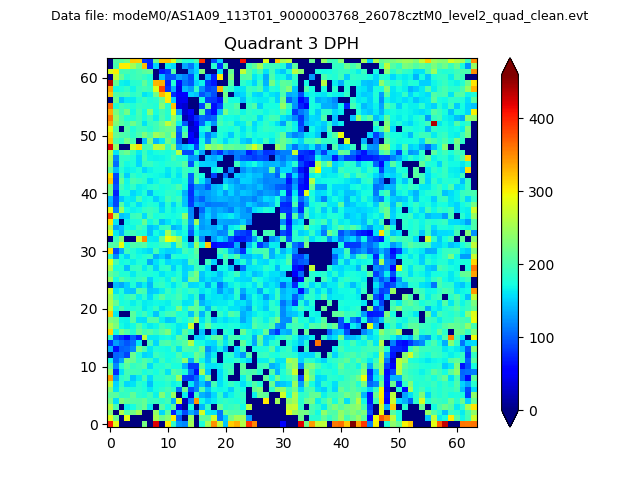 |
 |
Quadrant C |
| Plot type | Count rate plots | Images |
|---|---|---|
| Comparison with Poisson distribution Blue bars denote a histogram of data divided into 1 sec bins. Red curve is a Poisson curve with rate = median count rate of data. |
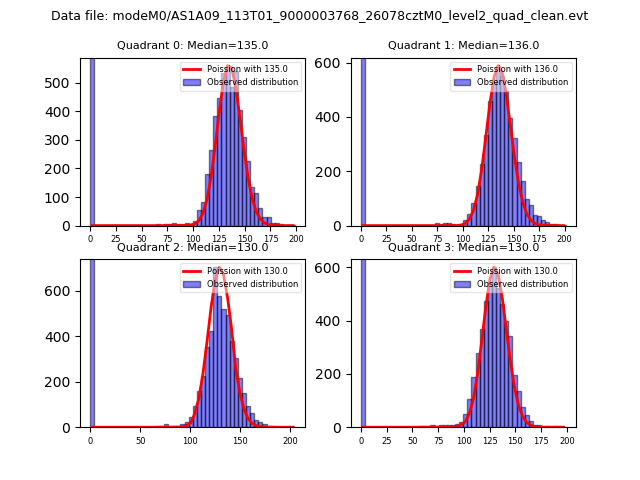 |
 |
| Quadrant-wise count rates Data is divided into 100 sec bins |
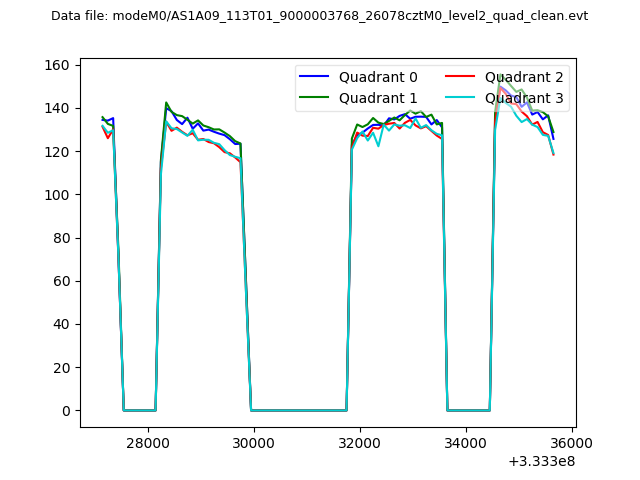 |
|
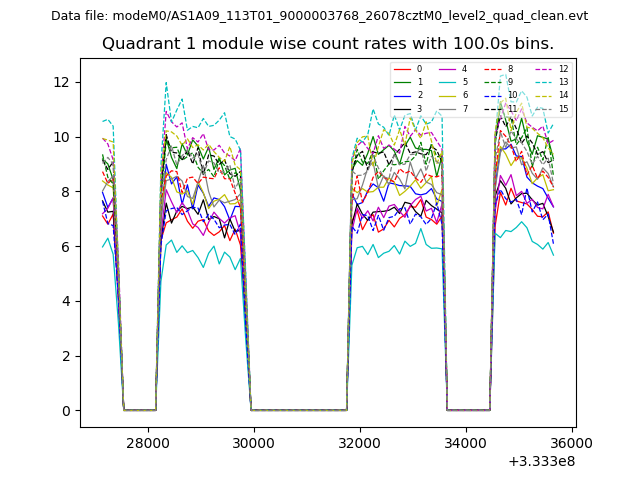
| Module-wise count rates for Quadrant A Data is divided into 100 sec bins |
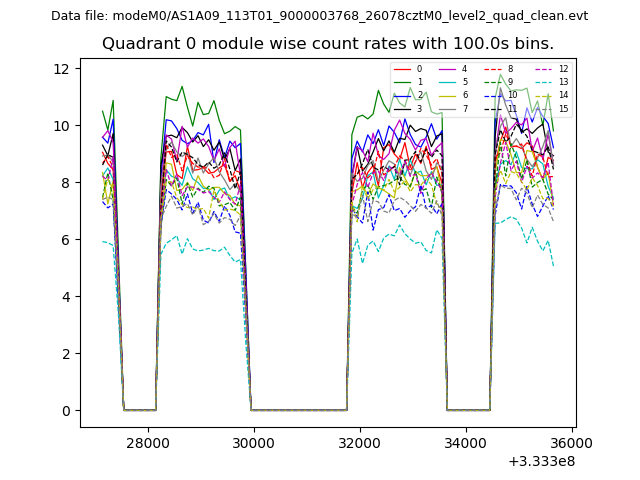 |
 |
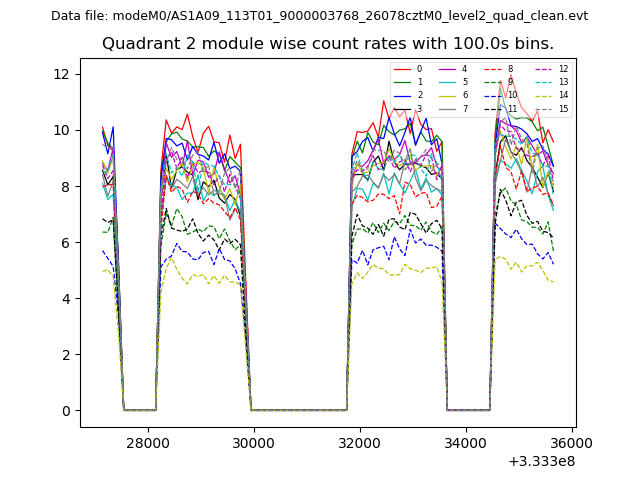
| Module-wise count rates for Quadrant B Data is divided into 100 sec bins |
 |
 |
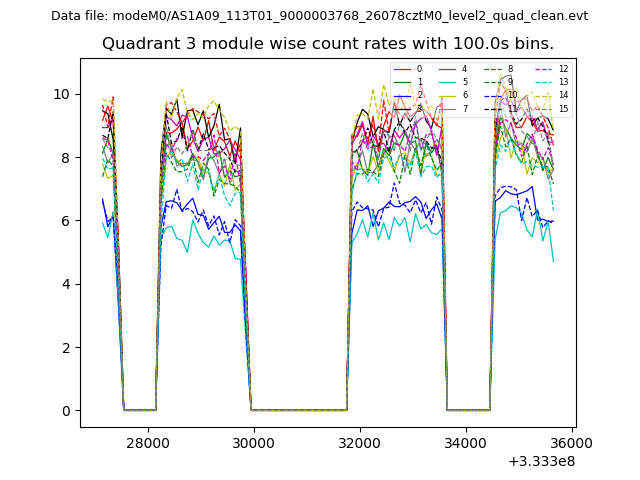
| Module-wise count rates for Quadrant C Data is divided into 100 sec bins |
 |
 |
| Module-wise count rates for Quadrant D Data is divided into 100 sec bins |
 |
 |
| Parameter | Plot |
|---|---|
| CZT HV Monitor | 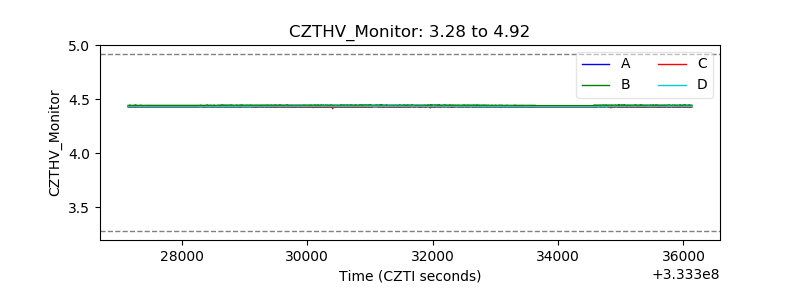 |
| D_VDD | 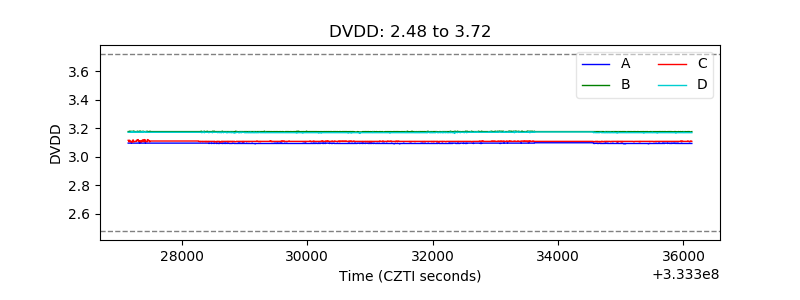 |
| Temperature 1 | 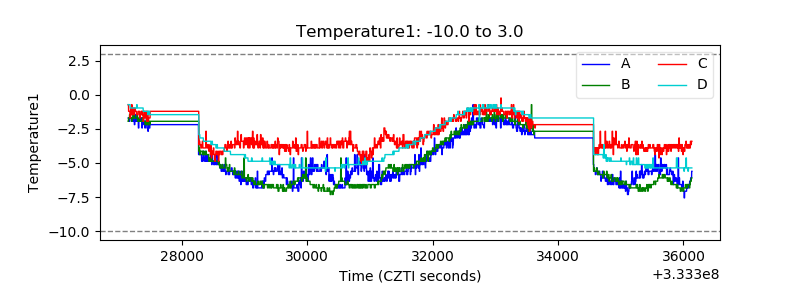 |
| Veto HV Monitor | 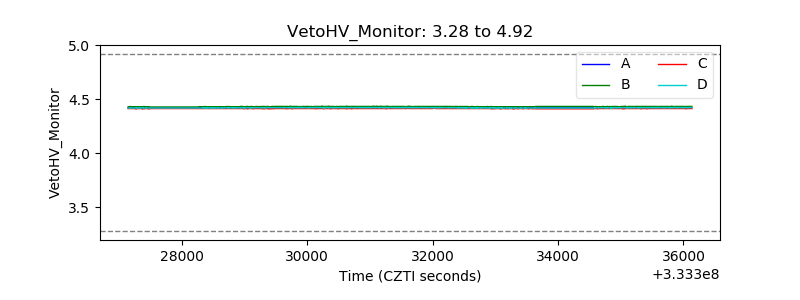 |
| Veto LLD | 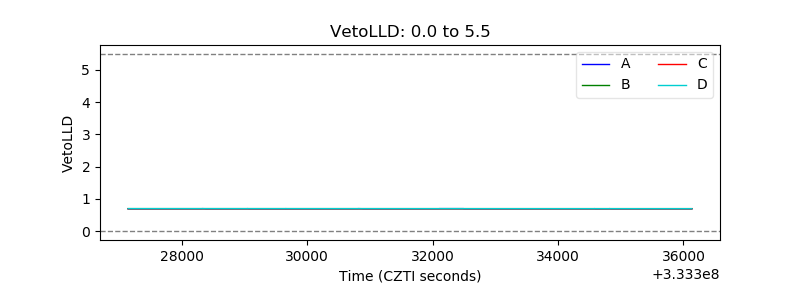 |
| Alpha Counter | 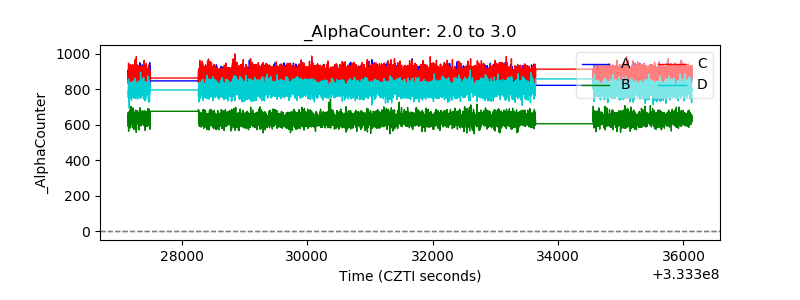 |
| _CPM_Rate | 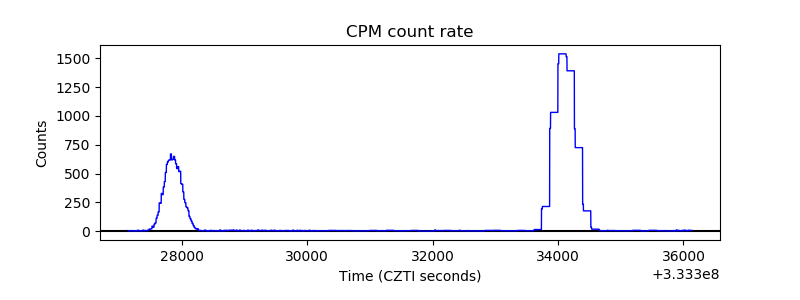 |
| CZT Counter | 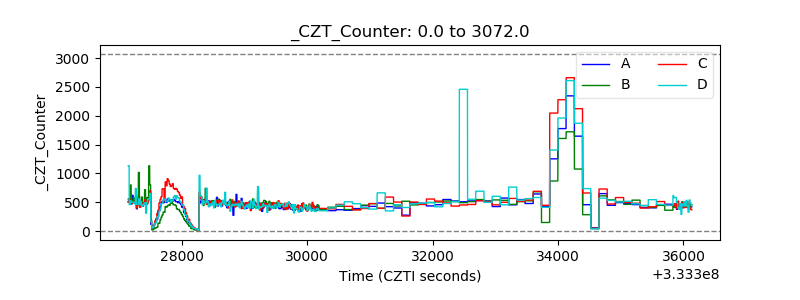 |
| +2.5 Volts monitor |  |
| +5 Volts monitor | 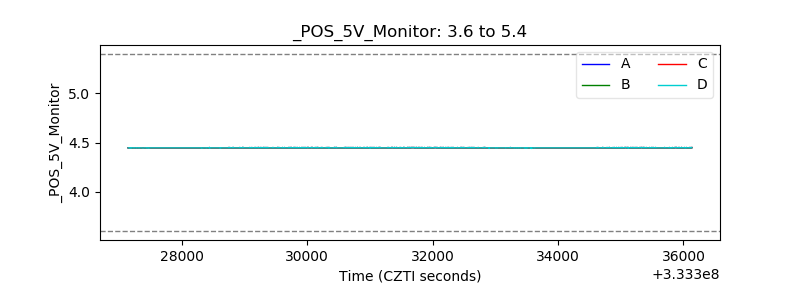 |
| _ROLL_ROT | 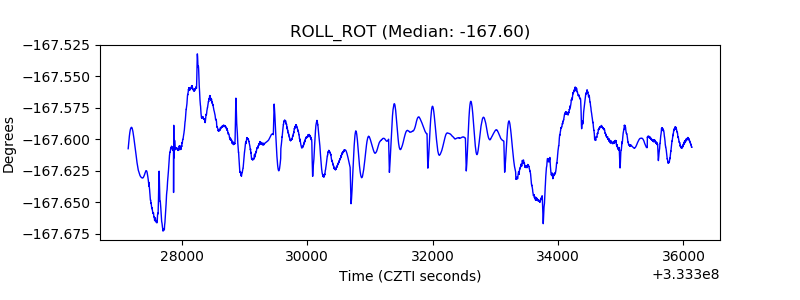 |
| _Roll_DEC | 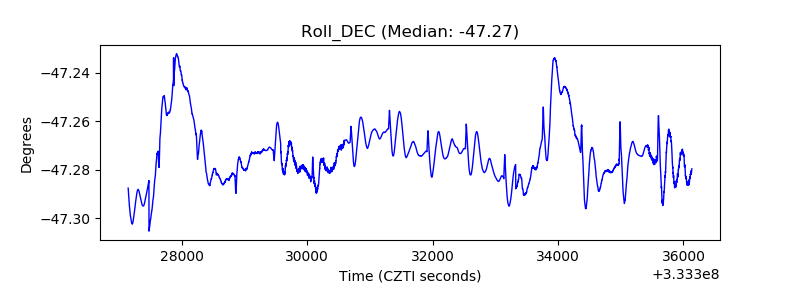 |
| _Roll_RA | 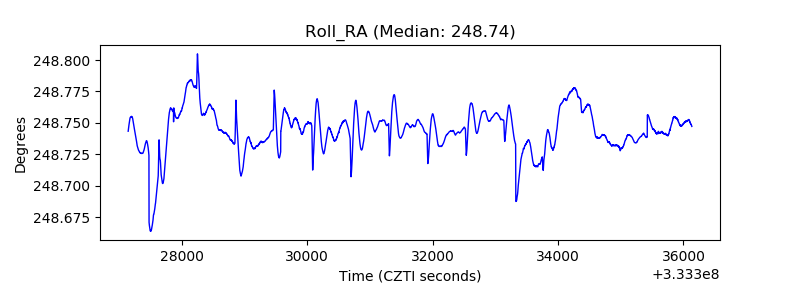 |
| Veto Counter | 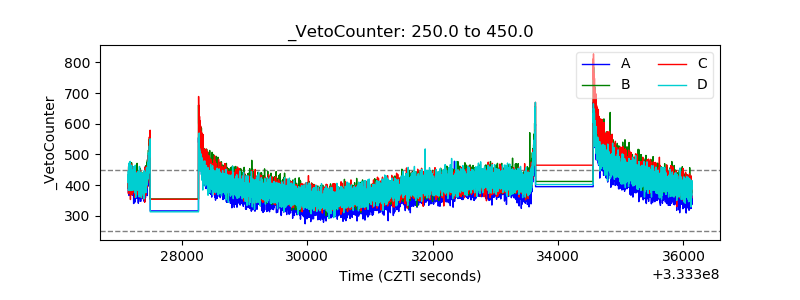 |