| Param | Original file | Final file |
|---|---|---|
| Filename | modeM0/AS1A09_113T01_9000003768_26081cztM0_level2.evt | modeM0/AS1A09_113T01_9000003768_26081cztM0_level2_quad_clean.evt |
| Size (bytes) | 37,131,840 | 11,059,200 |
| Size | 35.4 MB | 10.5 MB |
| Events in quadrant A | 281,114 | 73,878 |
| Events in quadrant B | 258,752 | 77,504 |
| Events in quadrant C | 273,972 | 73,710 |
| Events in quadrant D | 277,870 | 71,070 |
| Mode M9 | |||
|---|---|---|---|
| Quadrant | BADHDUFLAG | Total packets | Discarded packets |
| A | 0 | 5 | 0 |
| B | 0 | 6 | 0 |
| C | 0 | 6 | 0 |
| D | 0 | 6 | 0 |
| Mode M0 | |||
|---|---|---|---|
| Quadrant | BADHDUFLAG | Total packets | Discarded packets |
| A | 0 | 1121 | 0 |
| B | 0 | 1071 | 0 |
| C | 0 | 1136 | 0 |
| D | 0 | 1148 | 0 |
| Quadrant | Total seconds | Saturated seconds | Saturation percentage |
|---|---|---|---|
| A | 427 | 4 | 0.936768% |
| B | 427 | 4 | 0.936768% |
| C | 427 | 10 | 2.341920% |
| D | 427 | 2 | 0.468384% |
Noise dominated data is calculated using 1-second bins in cleaned event files. If a bin has >2000 counts, and if more than 50% of those come from <1% of pixels, then it is considered to be noise-dominated and hence unusable.
| Quadrant | # 1 sec bins | Bins with >0 counts | Bins with >2000 counts | High rate bins dominated by noise | Noise dominated (total time) | Noise dominated (detector-on time) | Marked lightcurve |
|---|---|---|---|---|---|---|---|
| A | 427 | 427 | 2 | 2 | 0.47% | 0.47% | 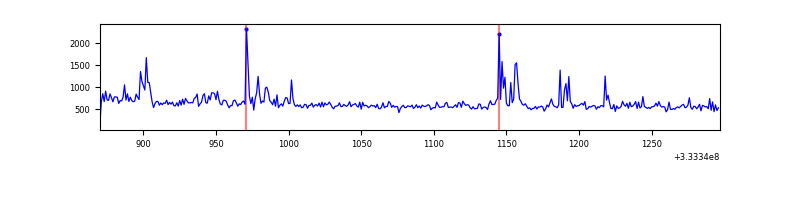 |
| B | 427 | 427 | 0 | 0 | 0.00% | 0.00% | 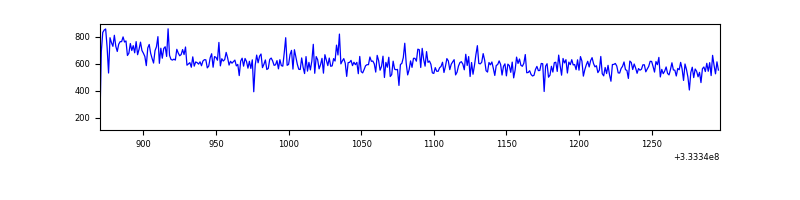 |
| C | 427 | 427 | 0 | 0 | 0.00% | 0.00% | 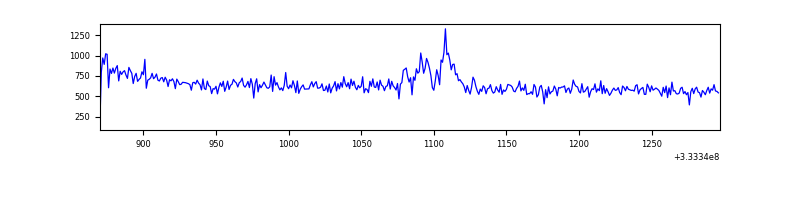 |
| D | 427 | 427 | 0 | 0 | 0.00% | 0.00% | 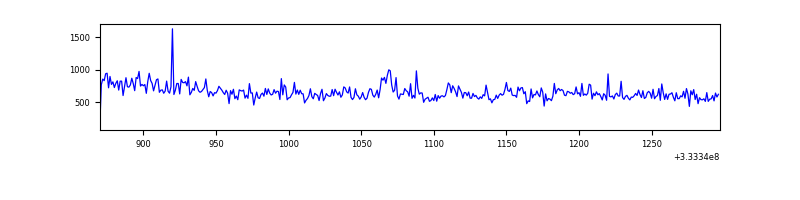 |
Top three noisy pixels from each quadrant. If the there are fewer than three noisy pixels in the level2.evt file, extra rows are filled as -1
| Pixel properties | Quadrant properties | ||||||
|---|---|---|---|---|---|---|---|
| Quadrant | DetID | PixID | Counts | Sigma | Mean | Median | Sigma |
| A | 0 | 13 | 33054 | 2211.86 | 64 | 63 | 14.9 |
| A | 13 | 254 | 680 | 41.37 | 64 | 63 | 14.9 |
| A | 3 | 137 | 541 | 32.05 | 64 | 63 | 14.9 |
| B | 0 | 229 | 1459 | 95.32 | 65 | 64 | 14.6 |
| B | 12 | 111 | 1447 | 94.5 | 65 | 64 | 14.6 |
| B | 11 | 111 | 1296 | 84.18 | 65 | 64 | 14.6 |
| C | 3 | 233 | 15118 | 909.88 | 63 | 64 | 16.5 |
| C | 14 | 238 | 10406 | 625.08 | 63 | 64 | 16.5 |
| C | 13 | 61 | 409 | 20.85 | 63 | 64 | 16.5 |
| D | 7 | 80 | 27796 | 1641.79 | 62 | 61 | 16.9 |
| D | 1 | 52 | 10269 | 604.27 | 62 | 61 | 16.9 |
| D | 3 | 238 | 1658 | 94.54 | 62 | 61 | 16.9 |
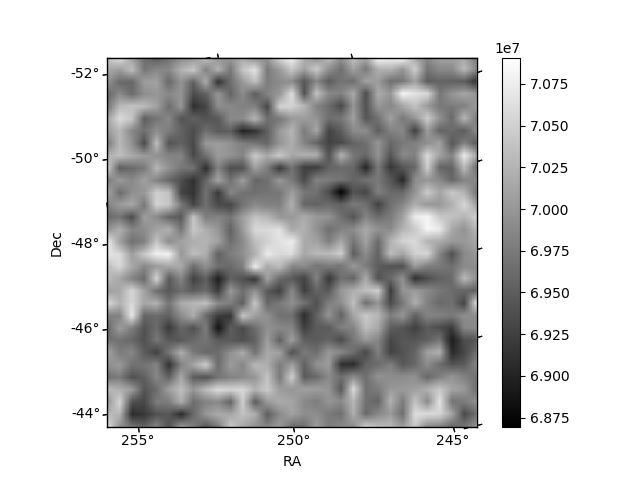
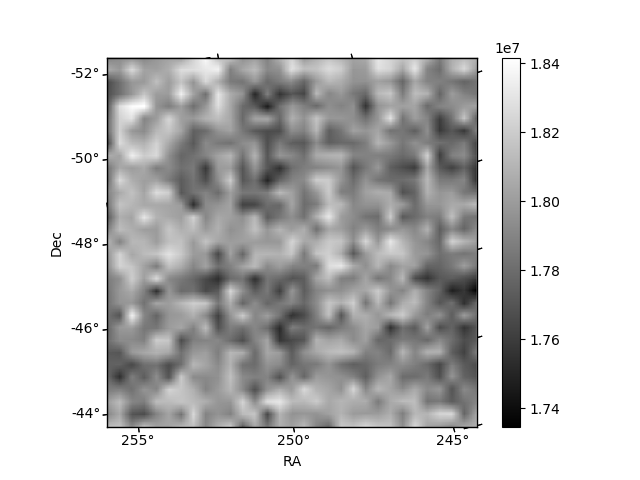
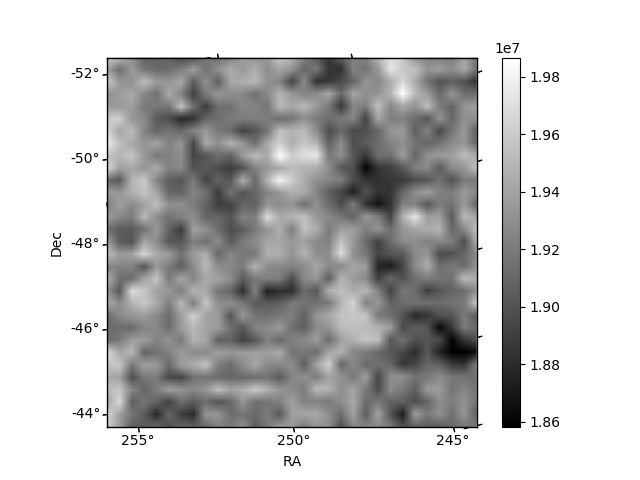
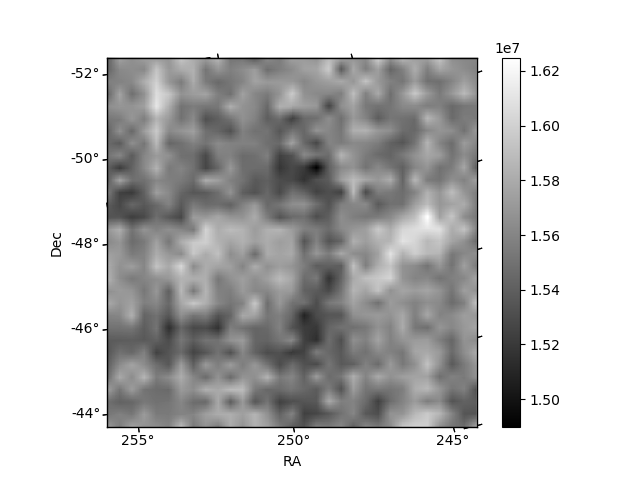
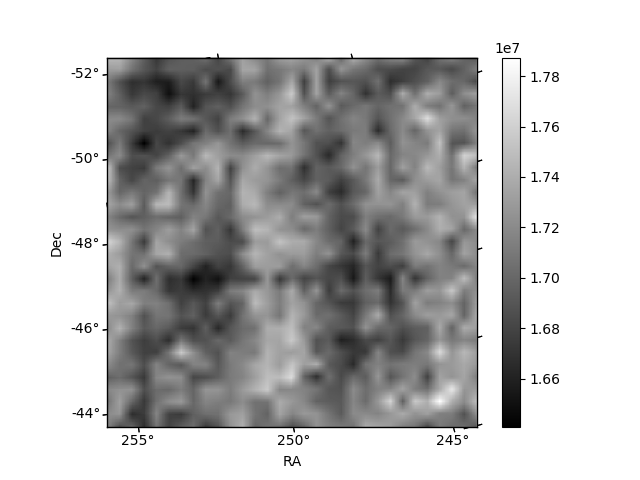
Histogram calculated using DETX and DETY for each event in the final _common_clean file
| Quadrant A | 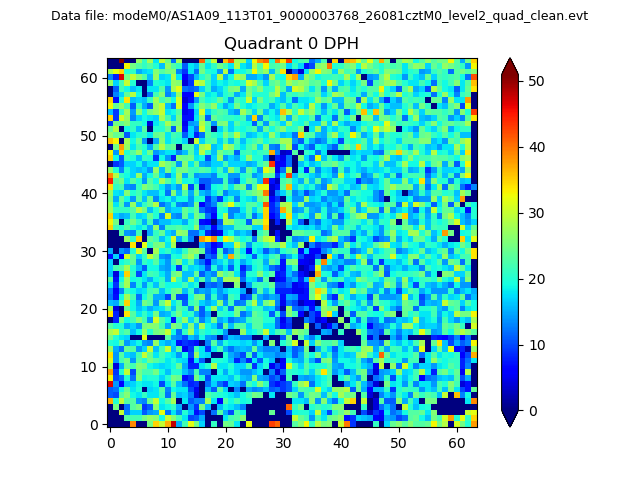 |
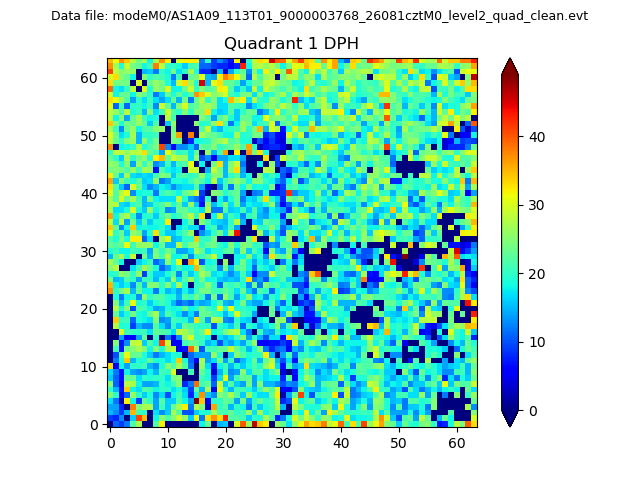 |
Quadrant B |
|---|---|---|---|
| Quadrant D | 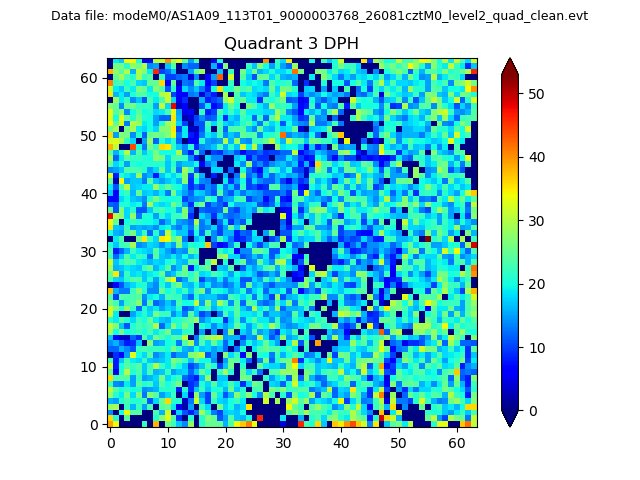 |
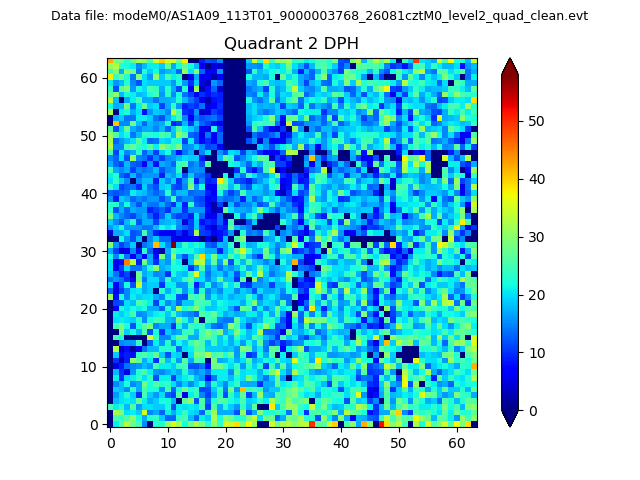 |
Quadrant C |
| Plot type | Count rate plots | Images |
|---|---|---|
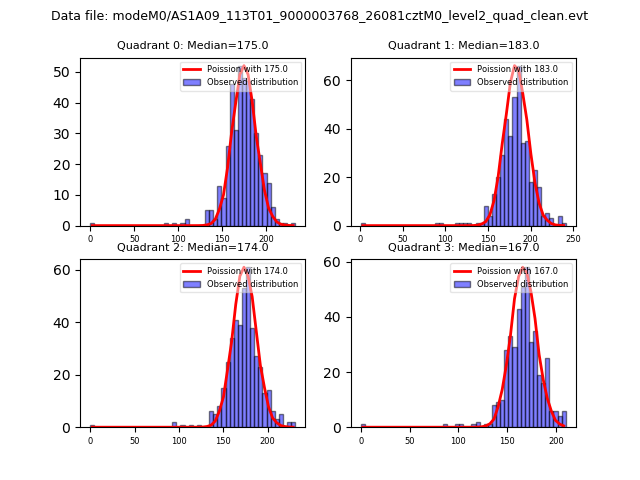
| Comparison with Poisson distribution Blue bars denote a histogram of data divided into 1 sec bins. Red curve is a Poisson curve with rate = median count rate of data. |
 |
 |
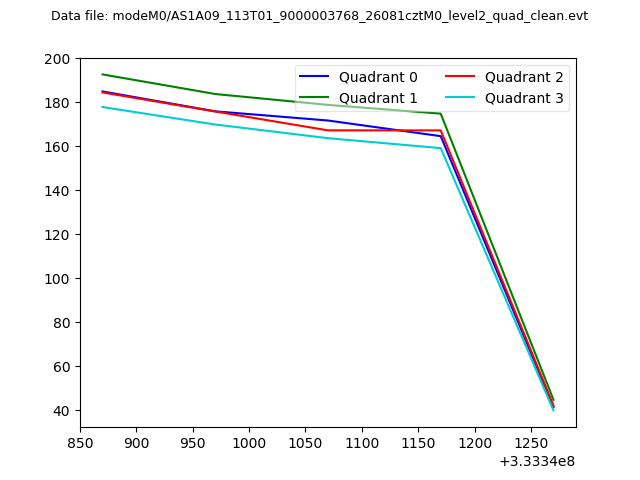
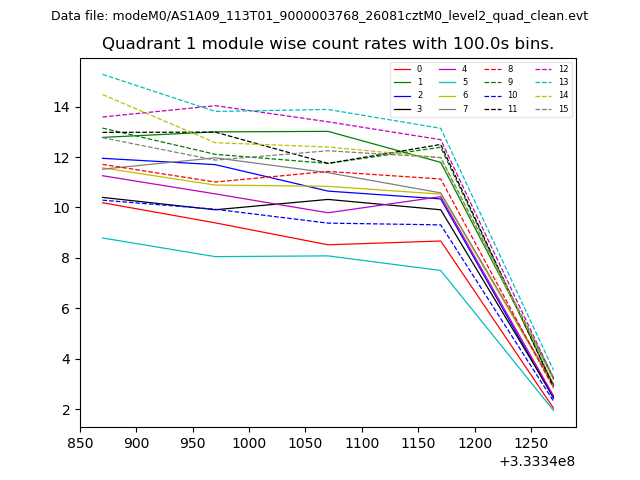
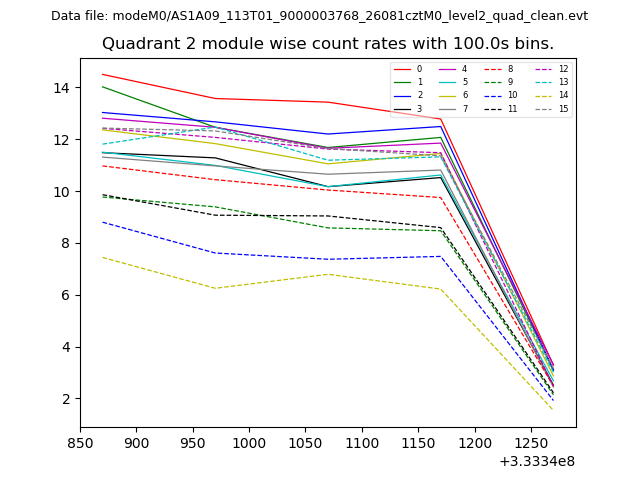
| Quadrant-wise count rates Data is divided into 100 sec bins |
 |
|
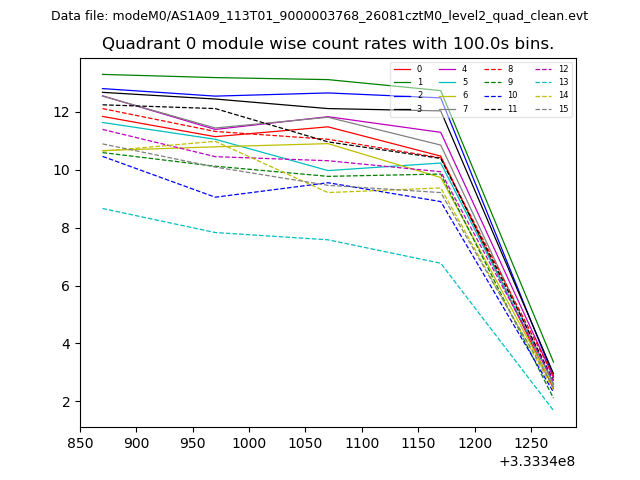
| Module-wise count rates for Quadrant A Data is divided into 100 sec bins |
 |
 |
| Module-wise count rates for Quadrant B Data is divided into 100 sec bins |
 |
 |
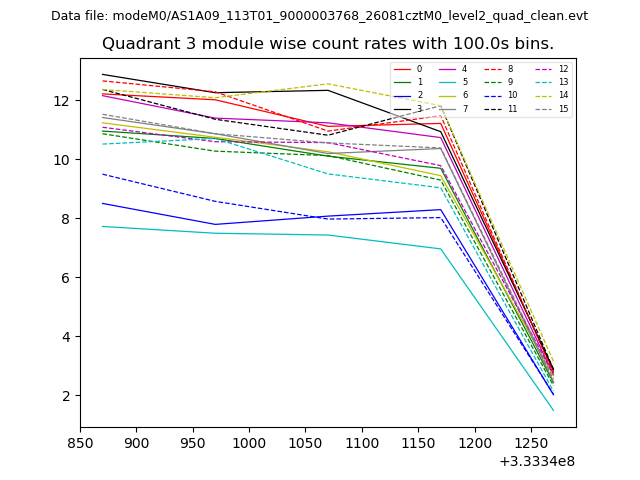
| Module-wise count rates for Quadrant C Data is divided into 100 sec bins |
 |
 |
| Module-wise count rates for Quadrant D Data is divided into 100 sec bins |
 |
 |
| Parameter | Plot |
|---|---|
| CZT HV Monitor | 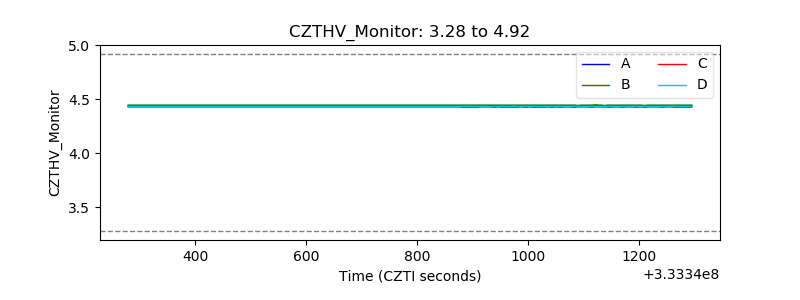 |
| D_VDD | 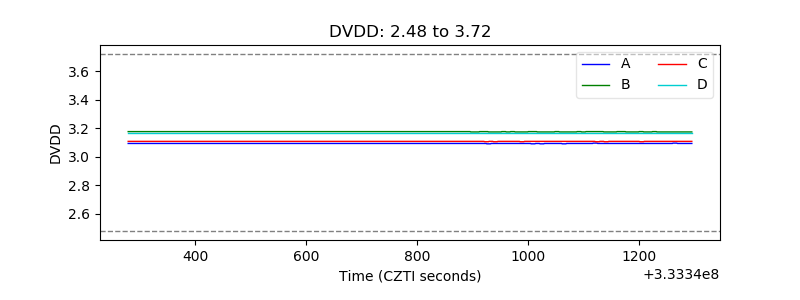 |
| Temperature 1 | 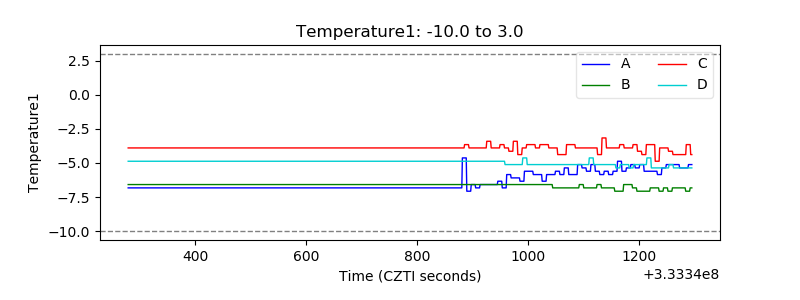 |
| Veto HV Monitor | 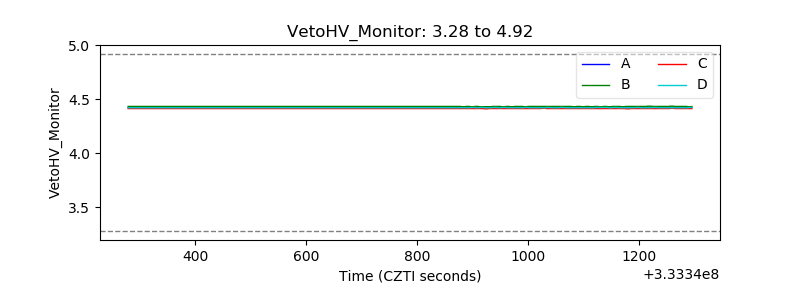 |
| Veto LLD | 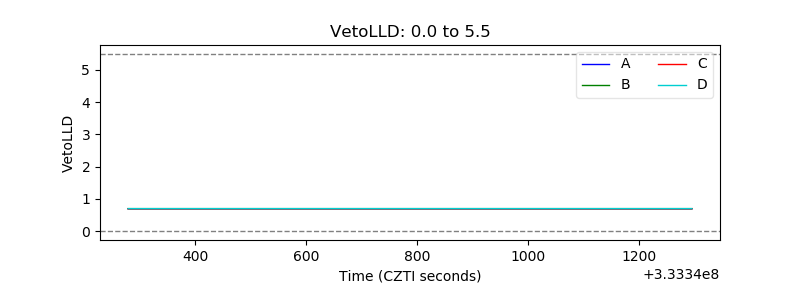 |
| Alpha Counter | 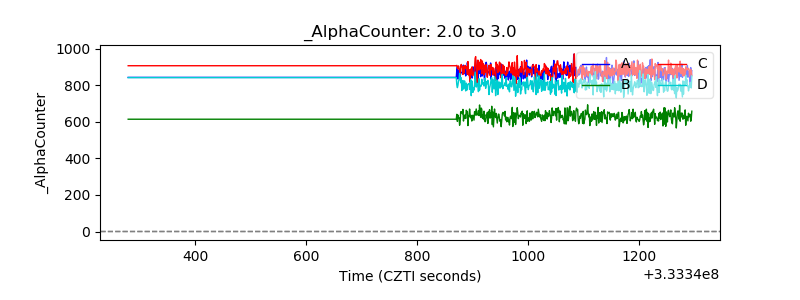 |
| _CPM_Rate | 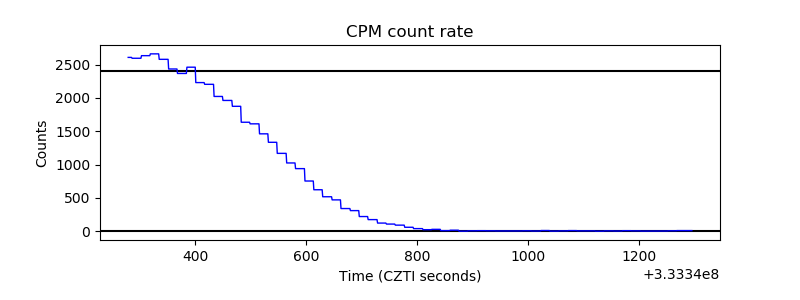 |
| CZT Counter | 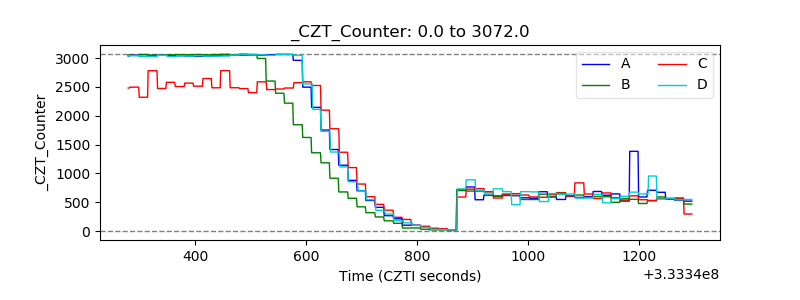 |
| +2.5 Volts monitor |  |
| +5 Volts monitor | 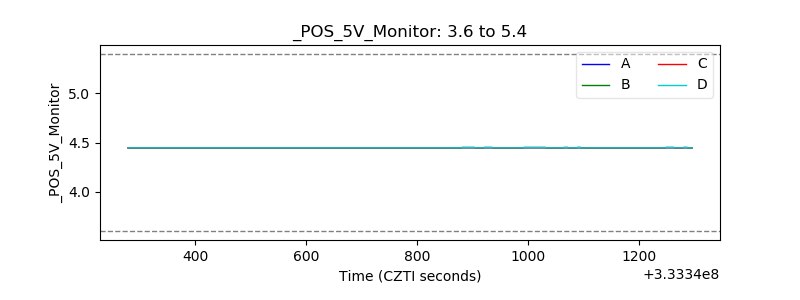 |
| _ROLL_ROT | 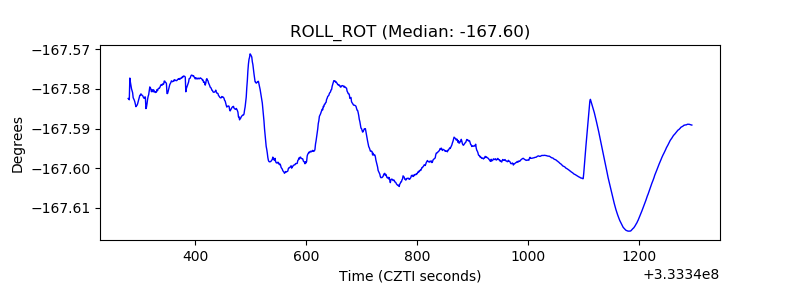 |
| _Roll_DEC | 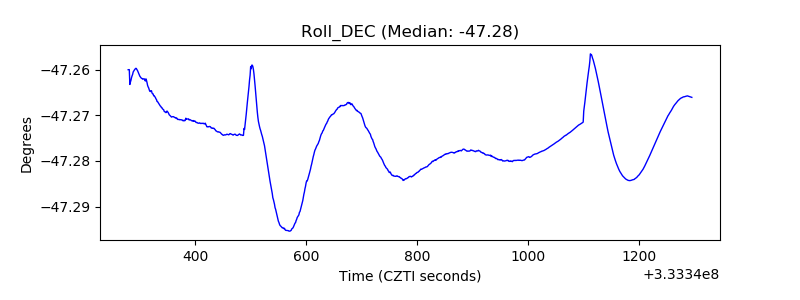 |
| _Roll_RA | 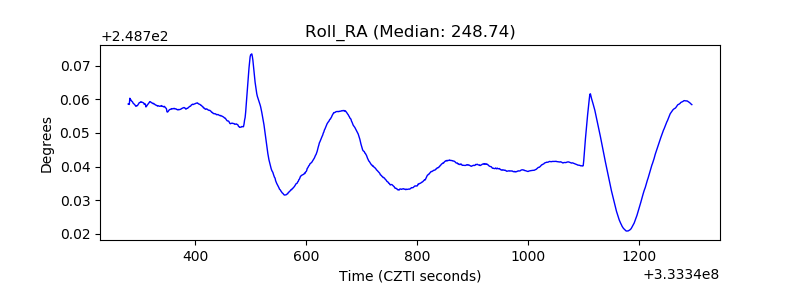 |
| Veto Counter |  |