| Param | Original file | Final file |
|---|---|---|
| Filename | modeM0/AS1A09_018T01_9000003774_26091cztM0_level2.evt | modeM0/AS1A09_018T01_9000003774_26091cztM0_level2_quad_clean.evt |
| Size (bytes) | 259,528,320 | 32,247,360 |
| Size | 247.5 MB | 30.8 MB |
| Events in quadrant A | 1,725,875 | 183,011 |
| Events in quadrant B | 1,753,610 | 187,146 |
| Events in quadrant C | 1,774,834 | 175,234 |
| Events in quadrant D | 2,356,892 | 173,265 |
| Mode M0 | |||
|---|---|---|---|
| Quadrant | BADHDUFLAG | Total packets | Discarded packets |
| A | 0 | 7462 | 0 |
| B | 0 | 7511 | 0 |
| C | 0 | 7619 | 0 |
| D | 0 | 9440 | 0 |
| Mode M9 | |||
|---|---|---|---|
| Quadrant | BADHDUFLAG | Total packets | Discarded packets |
| A | 0 | 2 | 0 |
| B | 0 | 2 | 0 |
| C | 0 | 2 | 0 |
| D | 0 | 2 | 0 |
| Quadrant | Total seconds | Saturated seconds | Saturation percentage |
|---|---|---|---|
| A | 3628 | 21 | 0.578831% |
| B | 3628 | 29 | 0.799338% |
| C | 3628 | 66 | 1.819184% |
| D | 3628 | 217 | 5.981257% |
Noise dominated data is calculated using 1-second bins in cleaned event files. If a bin has >2000 counts, and if more than 50% of those come from <1% of pixels, then it is considered to be noise-dominated and hence unusable.
| Quadrant | # 1 sec bins | Bins with >0 counts | Bins with >2000 counts | High rate bins dominated by noise | Noise dominated (total time) | Noise dominated (detector-on time) | Marked lightcurve |
|---|---|---|---|---|---|---|---|
| A | 3627 | 3627 | 0 | 0 | 0.00% | 0.00% | 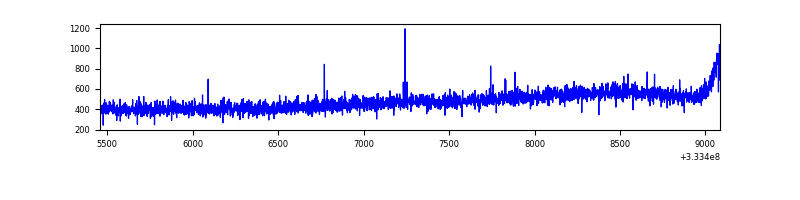 |
| B | 3627 | 3627 | 0 | 0 | 0.00% | 0.00% | 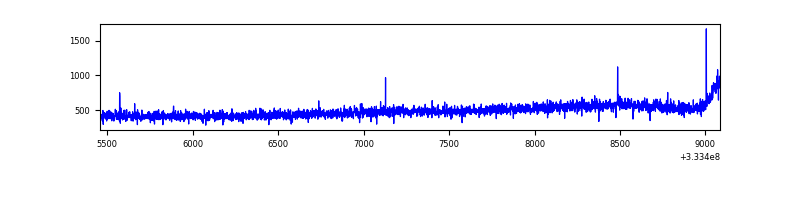 |
| C | 3627 | 3627 | 10 | 10 | 0.28% | 0.28% | 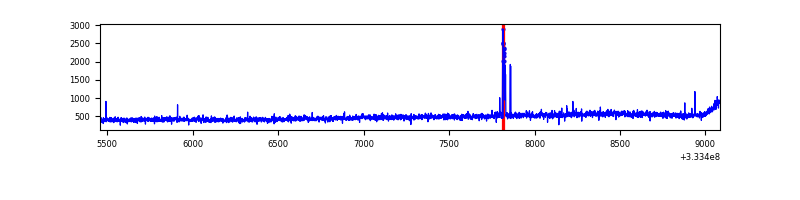 |
| D | 3628 | 3628 | 202 | 202 | 5.57% | 5.57% | 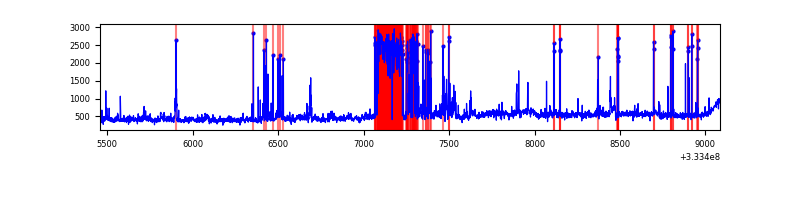 |
Top three noisy pixels from each quadrant. If the there are fewer than three noisy pixels in the level2.evt file, extra rows are filled as -1
| Pixel properties | Quadrant properties | ||||||
|---|---|---|---|---|---|---|---|
| Quadrant | DetID | PixID | Counts | Sigma | Mean | Median | Sigma |
| A | 13 | 254 | 5580 | 55.36 | 447 | 437 | 92.9 |
| A | 3 | 137 | 4413 | 42.8 | 447 | 437 | 92.9 |
| A | 0 | 226 | 3764 | 35.81 | 447 | 437 | 92.9 |
| B | 12 | 111 | 10809 | 117.41 | 444 | 433 | 88.4 |
| B | 11 | 111 | 10111 | 109.51 | 444 | 433 | 88.4 |
| B | 14 | 111 | 9246 | 99.72 | 444 | 433 | 88.4 |
| C | 14 | 238 | 68338 | 664.93 | 427 | 430 | 102.1 |
| C | 14 | 225 | 36846 | 356.57 | 427 | 430 | 102.1 |
| C | 3 | 233 | 3282 | 27.93 | 427 | 430 | 102.1 |
| D | 1 | 52 | 730862 | 7095.2 | 423 | 412 | 102.9 |
| D | 12 | 233 | 15020 | 141.89 | 423 | 412 | 102.9 |
| D | 2 | 234 | 14867 | 140.41 | 423 | 412 | 102.9 |
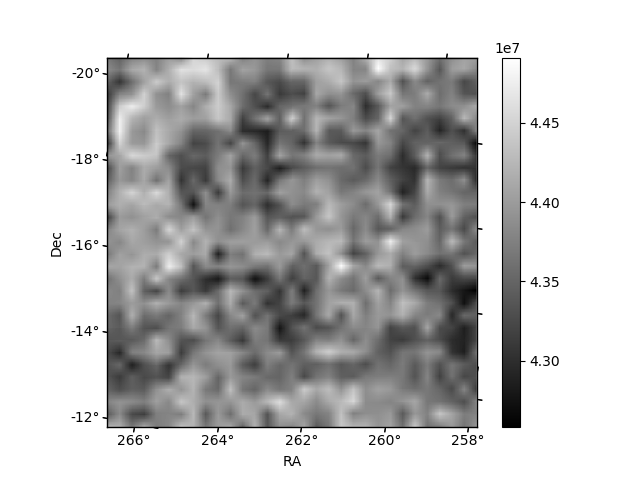
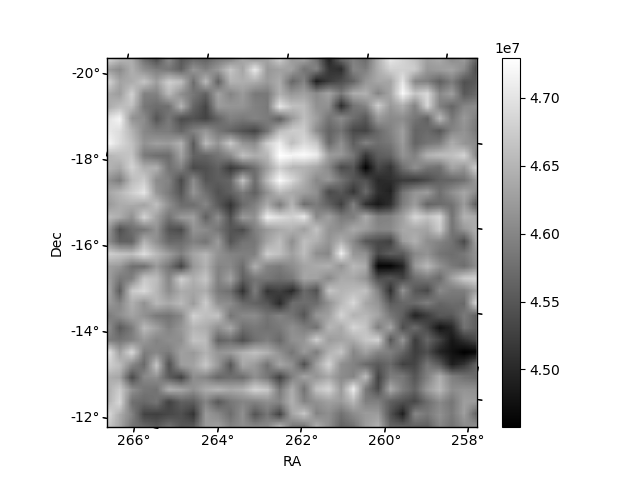
Histogram calculated using DETX and DETY for each event in the final _common_clean file
| Quadrant A |  |
 |
Quadrant B |
|---|---|---|---|
| Quadrant D | 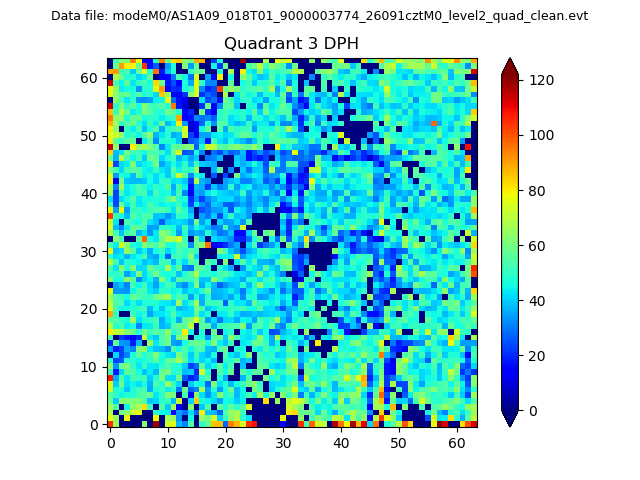 |
 |
Quadrant C |
| Plot type | Count rate plots | Images |
|---|---|---|
| Comparison with Poisson distribution Blue bars denote a histogram of data divided into 1 sec bins. Red curve is a Poisson curve with rate = median count rate of data. |
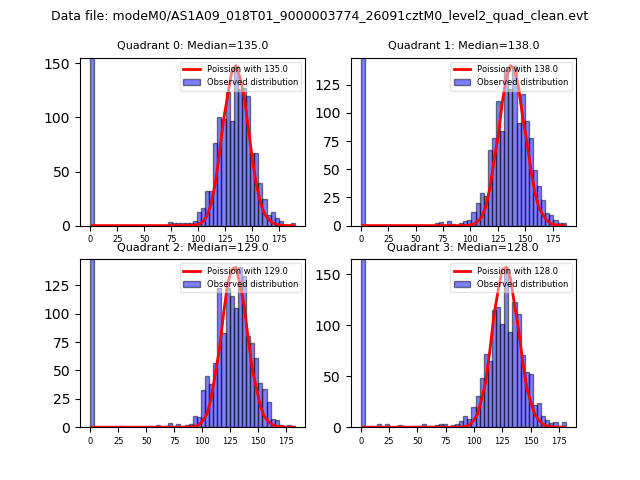 |
 |
| Quadrant-wise count rates Data is divided into 100 sec bins |
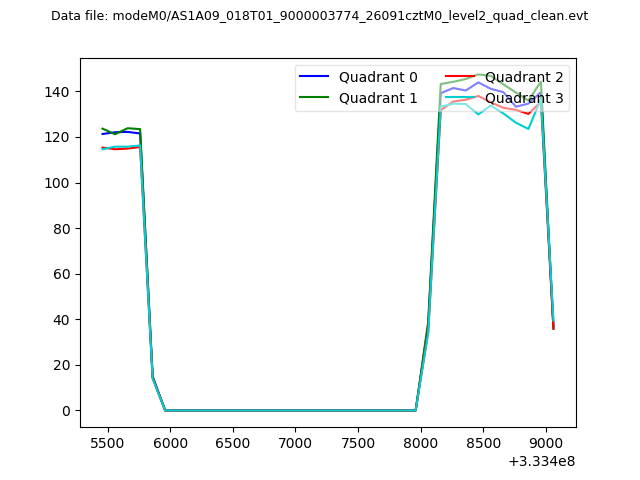 |
|
| Module-wise count rates for Quadrant A Data is divided into 100 sec bins |
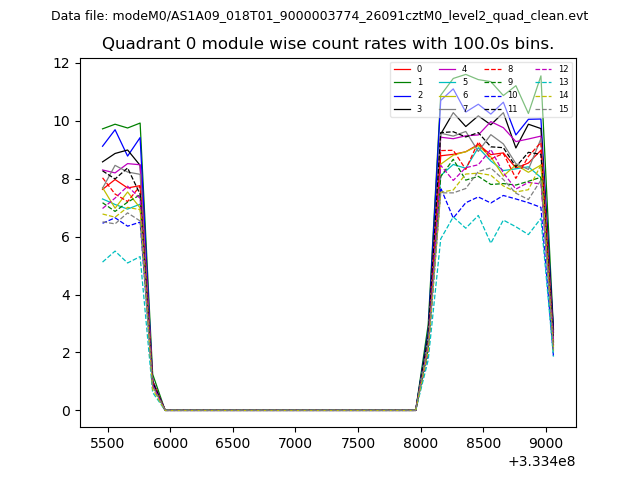 |
 |
| Module-wise count rates for Quadrant B Data is divided into 100 sec bins |
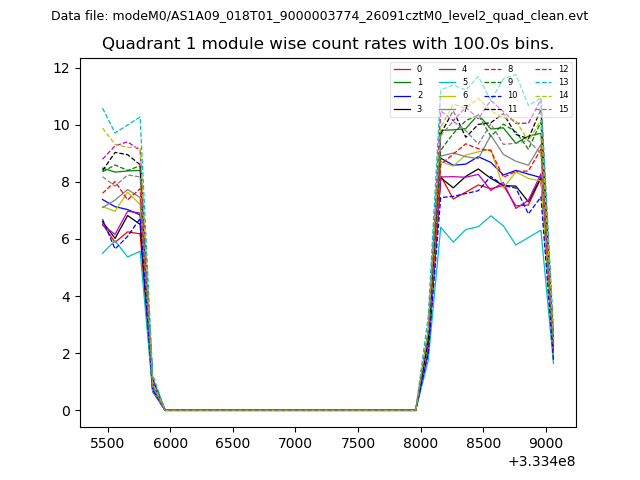 |
 |
| Module-wise count rates for Quadrant C Data is divided into 100 sec bins |
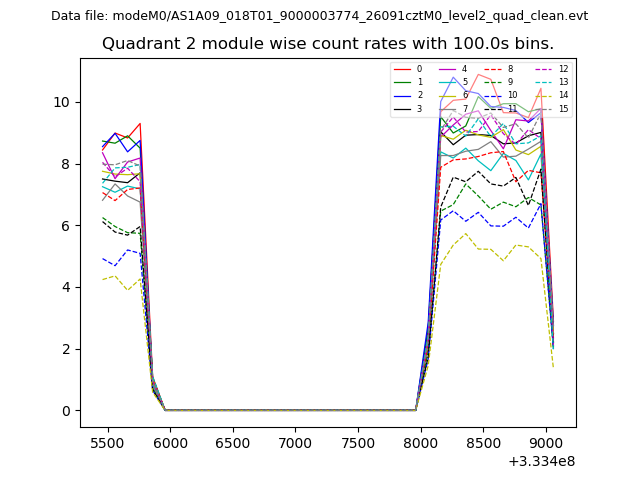 |
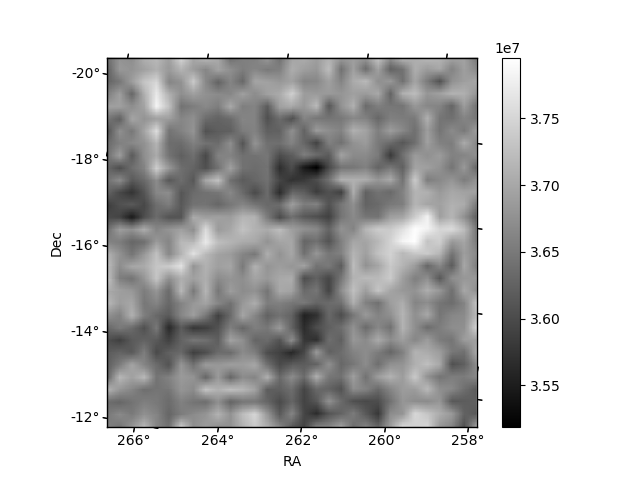 |
| Module-wise count rates for Quadrant D Data is divided into 100 sec bins |
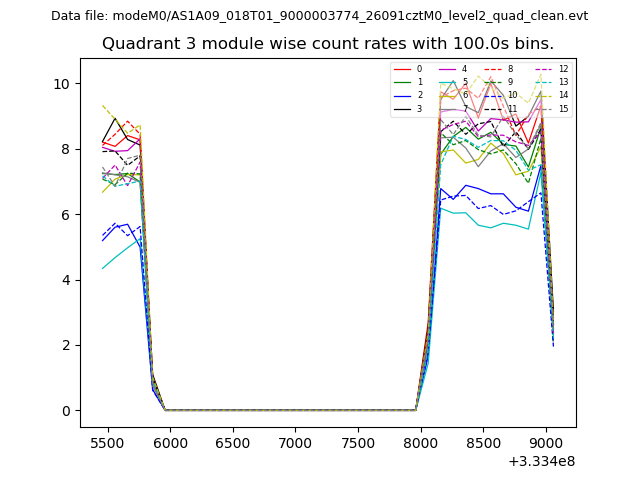 |
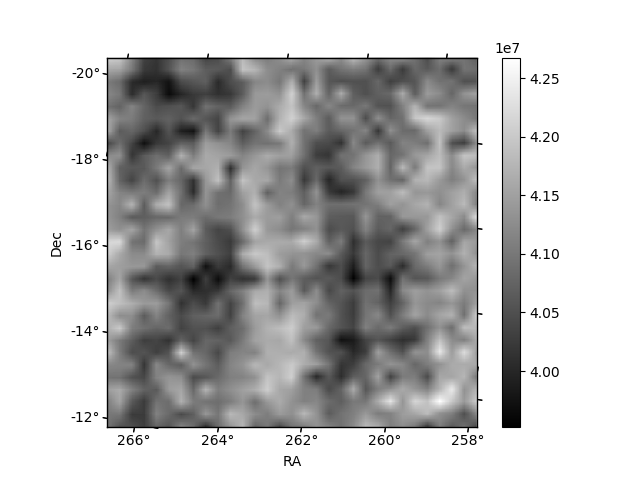 |
| Parameter | Plot |
|---|---|
| CZT HV Monitor | 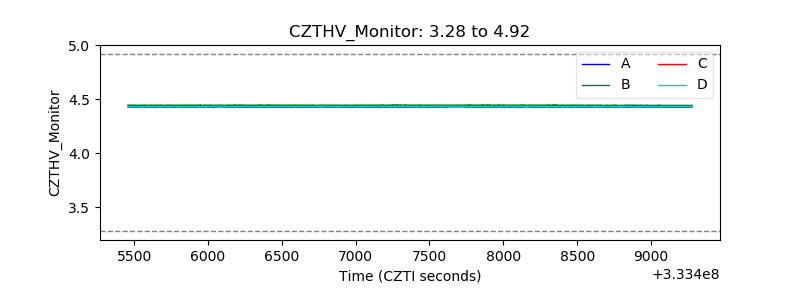 |
| D_VDD | 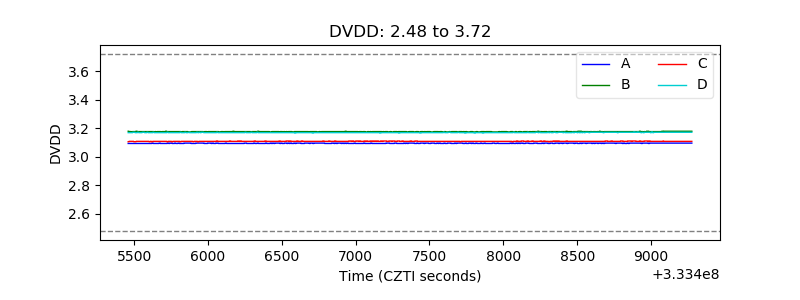 |
| Temperature 1 | 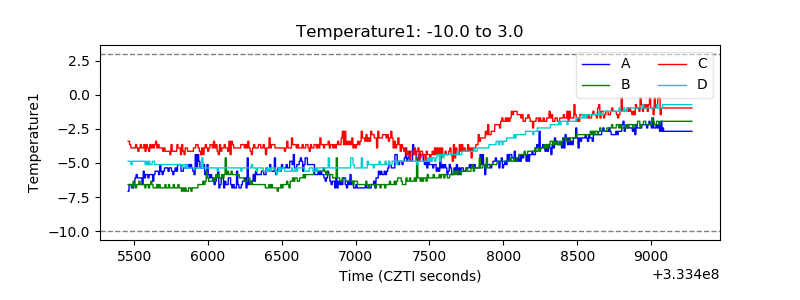 |
| Veto HV Monitor | 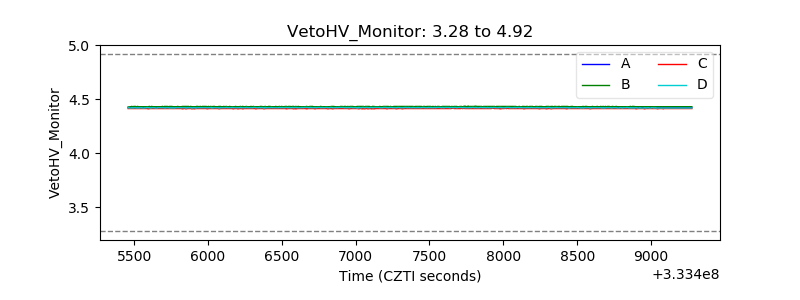 |
| Veto LLD | 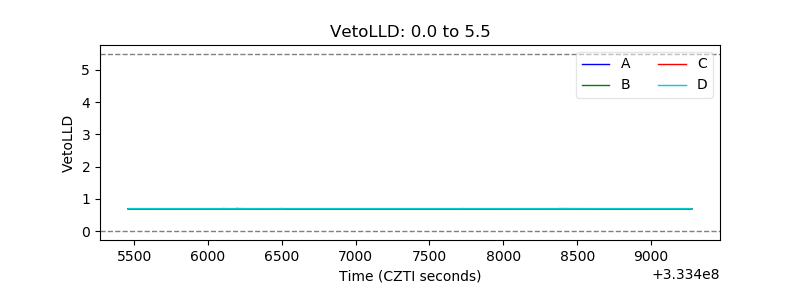 |
| Alpha Counter | 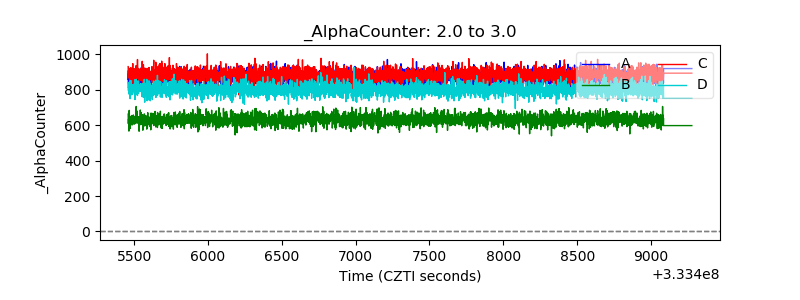 |
| _CPM_Rate | 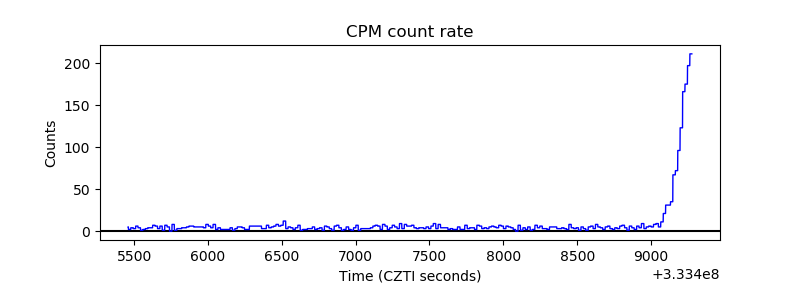 |
| CZT Counter | 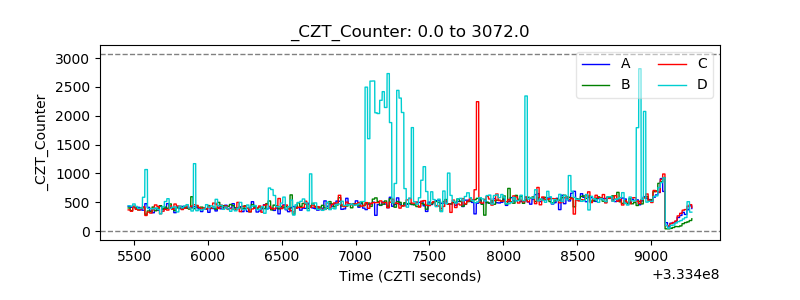 |
| +2.5 Volts monitor |  |
| +5 Volts monitor | 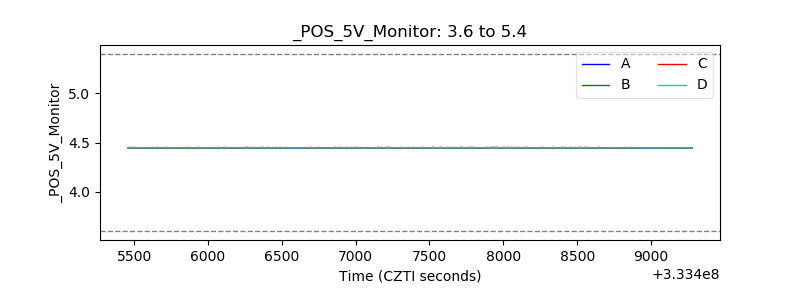 |
| _ROLL_ROT | 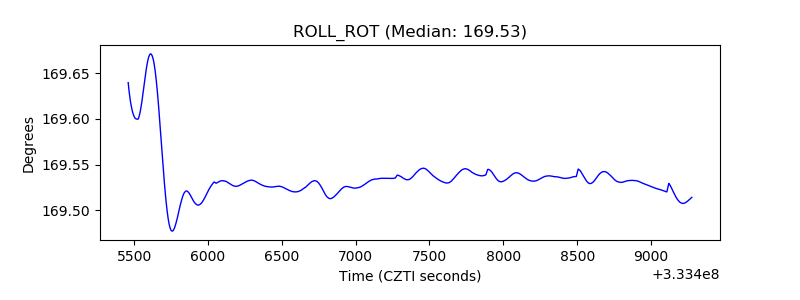 |
| _Roll_DEC | 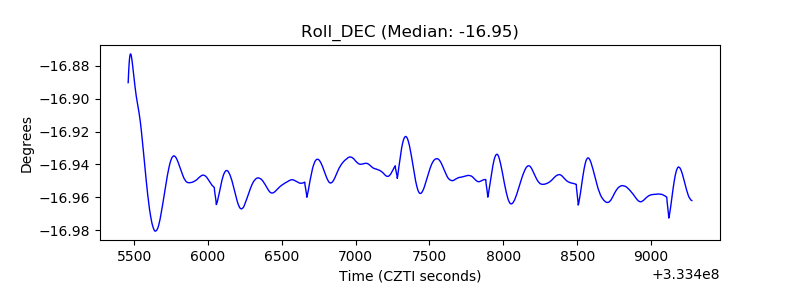 |
| _Roll_RA | 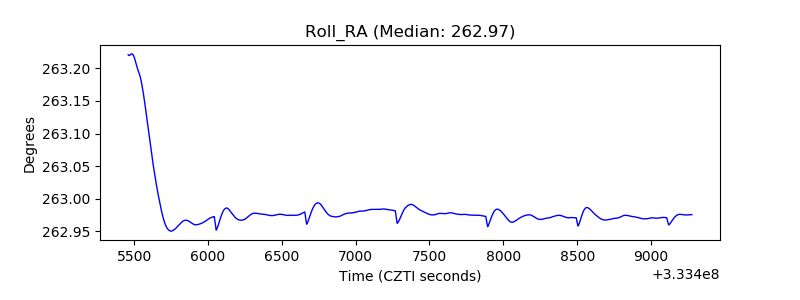 |
| Veto Counter | 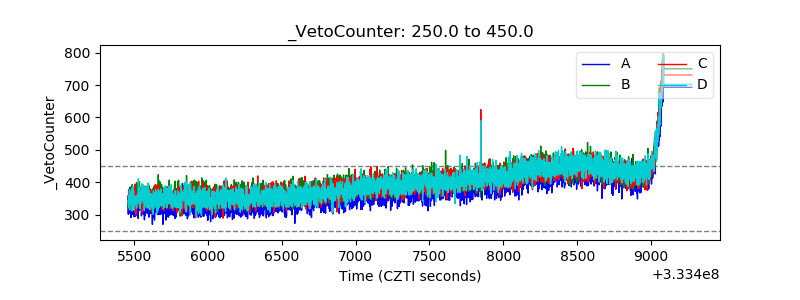 |