| Param | Original file | Final file |
|---|---|---|
| Filename | modeM0/AS1A09_018T01_9000003774_26092cztM0_level2.evt | modeM0/AS1A09_018T01_9000003774_26092cztM0_level2_quad_clean.evt |
| Size (bytes) | 531,371,520 | 105,480,000 |
| Size | 506.8 MB | 100.6 MB |
| Events in quadrant A | 3,521,848 | 687,552 |
| Events in quadrant B | 3,609,980 | 700,972 |
| Events in quadrant C | 3,587,815 | 655,420 |
| Events in quadrant D | 4,870,769 | 635,555 |
| Mode M0 | |||
|---|---|---|---|
| Quadrant | BADHDUFLAG | Total packets | Discarded packets |
| A | 0 | 15153 | 0 |
| B | 0 | 15343 | 0 |
| C | 0 | 15391 | 0 |
| D | 0 | 19331 | 0 |
| Mode M9 | |||
|---|---|---|---|
| Quadrant | BADHDUFLAG | Total packets | Discarded packets |
| A | 0 | 14 | 0 |
| B | 0 | 14 | 0 |
| C | 0 | 14 | 0 |
| D | 0 | 14 | 0 |
| Quadrant | Total seconds | Saturated seconds | Saturation percentage |
|---|---|---|---|
| A | 7391 | 33 | 0.446489% |
| B | 7392 | 52 | 0.703463% |
| C | 7391 | 92 | 1.244757% |
| D | 7391 | 412 | 5.574347% |
Noise dominated data is calculated using 1-second bins in cleaned event files. If a bin has >2000 counts, and if more than 50% of those come from <1% of pixels, then it is considered to be noise-dominated and hence unusable.
| Quadrant | # 1 sec bins | Bins with >0 counts | Bins with >2000 counts | High rate bins dominated by noise | Noise dominated (total time) | Noise dominated (detector-on time) | Marked lightcurve |
|---|---|---|---|---|---|---|---|
| A | 8931 | 7392 | 0 | 0 | 0.00% | 0.00% | 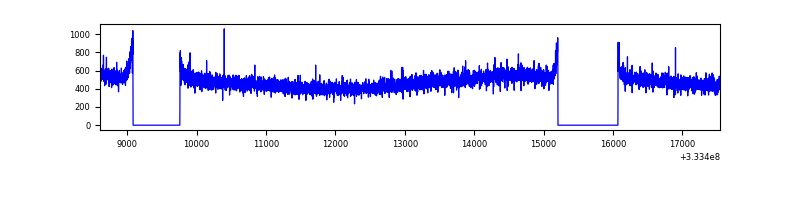 |
| B | 8932 | 7392 | 0 | 0 | 0.00% | 0.00% | 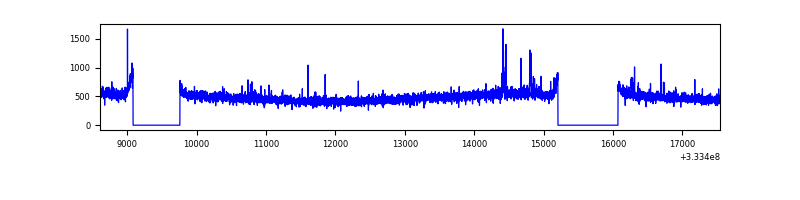 |
| C | 8931 | 7392 | 0 | 0 | 0.00% | 0.00% | 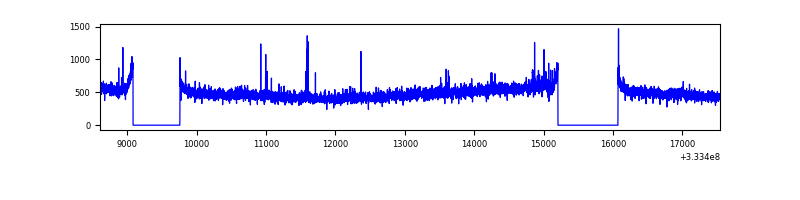 |
| D | 8931 | 7393 | 403 | 403 | 4.51% | 5.45% | 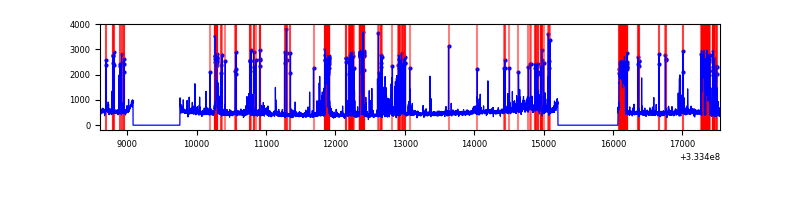 |
Top three noisy pixels from each quadrant. If the there are fewer than three noisy pixels in the level2.evt file, extra rows are filled as -1
| Pixel properties | Quadrant properties | ||||||
|---|---|---|---|---|---|---|---|
| Quadrant | DetID | PixID | Counts | Sigma | Mean | Median | Sigma |
| A | 13 | 254 | 12181 | 61.2 | 911 | 891 | 184.5 |
| A | 3 | 137 | 8604 | 41.81 | 911 | 891 | 184.5 |
| A | 0 | 226 | 7887 | 37.92 | 911 | 891 | 184.5 |
| B | 0 | 190 | 29065 | 159.69 | 906 | 882 | 176.5 |
| B | 12 | 111 | 21674 | 117.81 | 906 | 882 | 176.5 |
| B | 11 | 111 | 19153 | 103.52 | 906 | 882 | 176.5 |
| C | 14 | 238 | 137147 | 662.77 | 866 | 871 | 205.6 |
| C | 3 | 233 | 52466 | 250.93 | 866 | 871 | 205.6 |
| C | 14 | 225 | 15562 | 71.45 | 866 | 871 | 205.6 |
| D | 1 | 52 | 1549668 | 7538.28 | 856 | 836 | 205.5 |
| D | 2 | 234 | 32315 | 153.21 | 856 | 836 | 205.5 |
| D | 8 | 195 | 24967 | 117.44 | 856 | 836 | 205.5 |
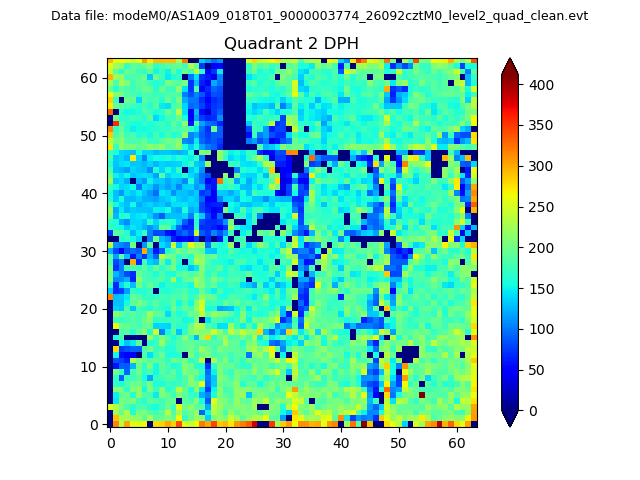
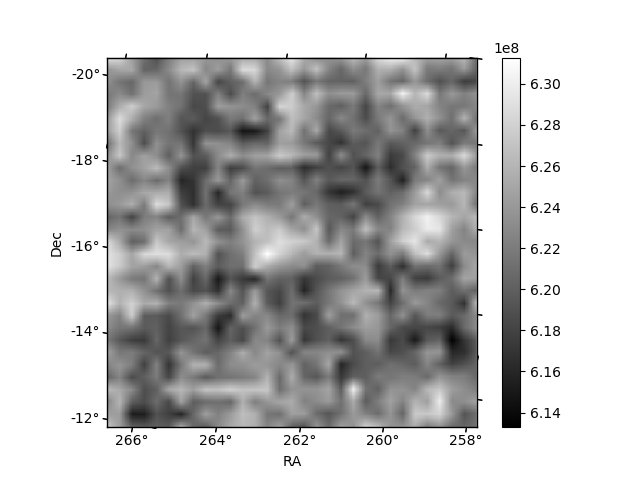
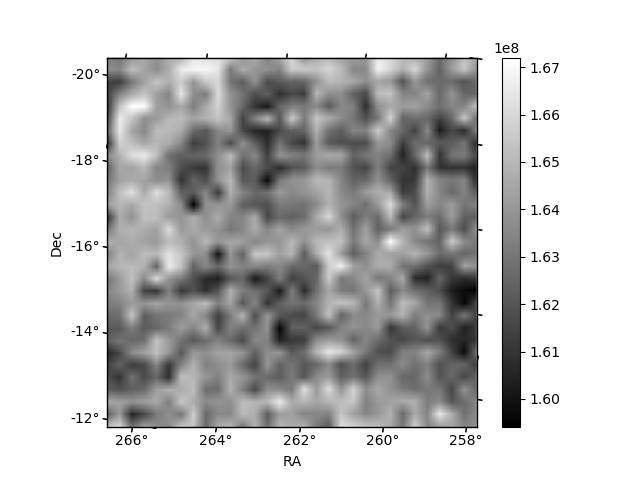
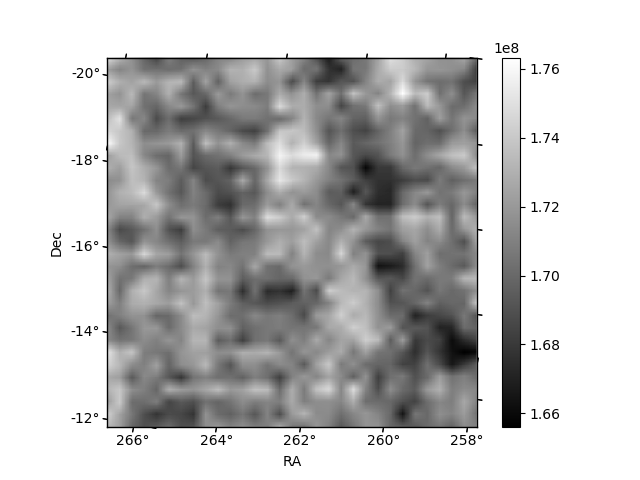
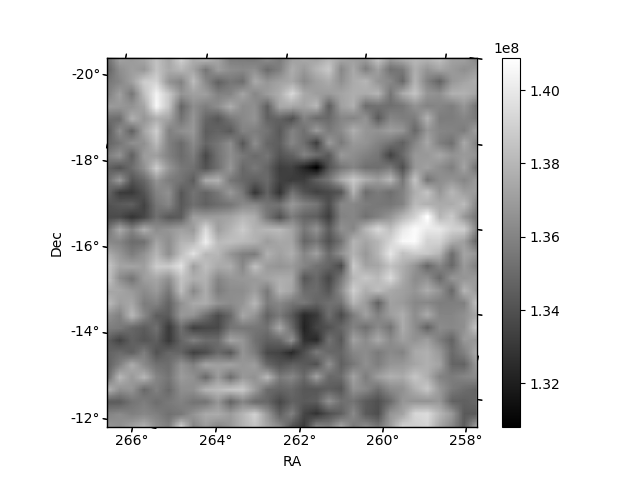
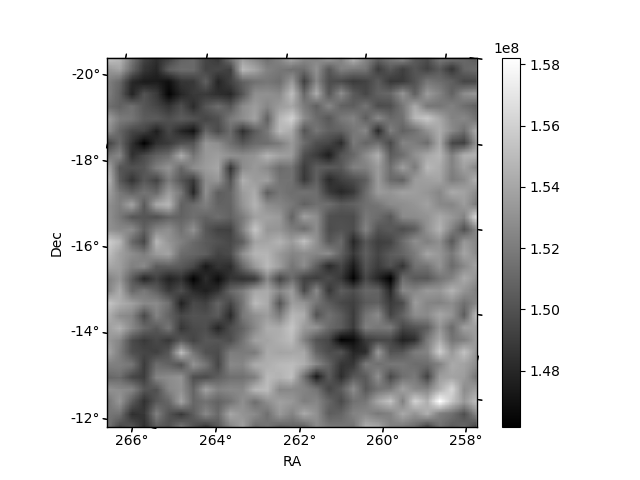
Histogram calculated using DETX and DETY for each event in the final _common_clean file
| Quadrant A | 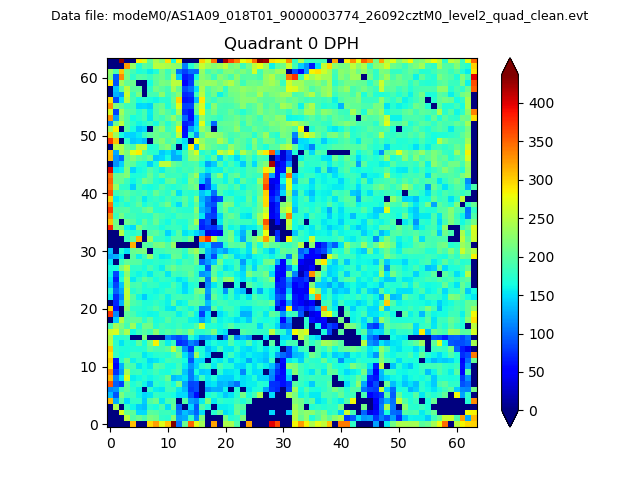 |
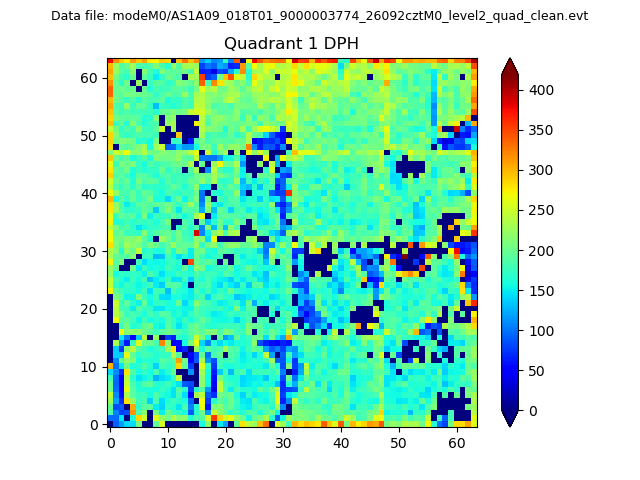 |
Quadrant B |
|---|---|---|---|
| Quadrant D | 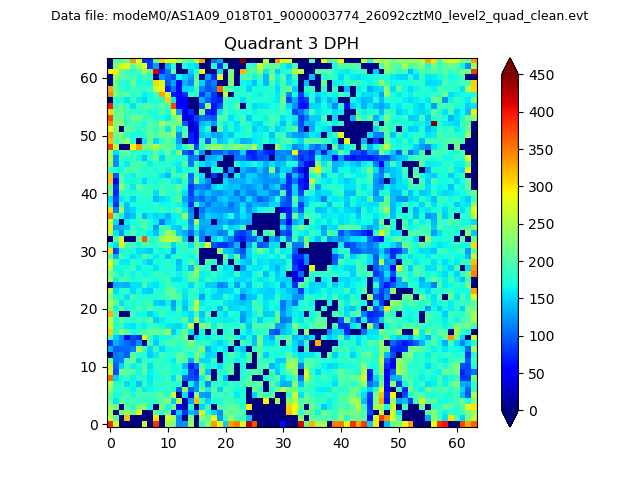 |
 |
Quadrant C |
| Plot type | Count rate plots | Images |
|---|---|---|
| Comparison with Poisson distribution Blue bars denote a histogram of data divided into 1 sec bins. Red curve is a Poisson curve with rate = median count rate of data. |
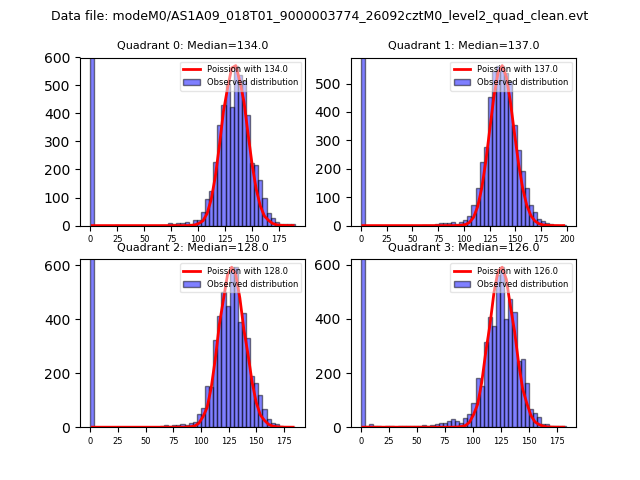 |
 |
| Quadrant-wise count rates Data is divided into 100 sec bins |
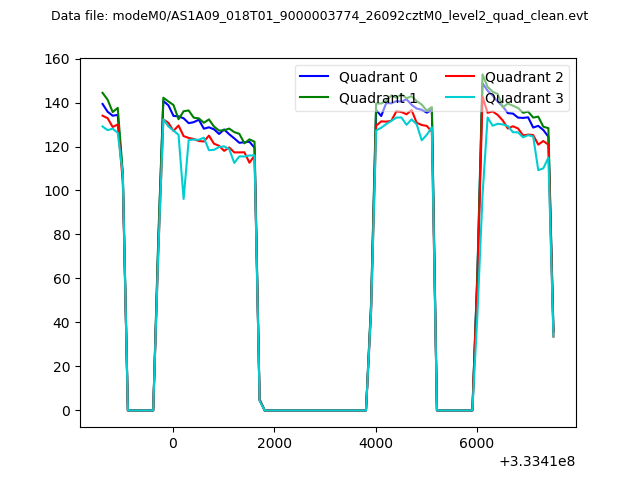 |
|
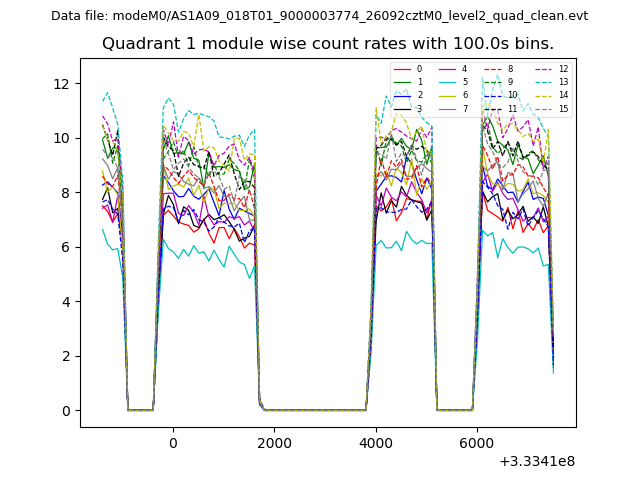
| Module-wise count rates for Quadrant A Data is divided into 100 sec bins |
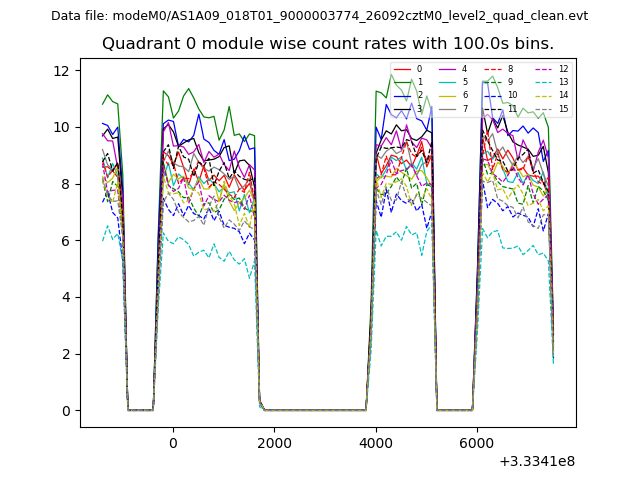 |
 |
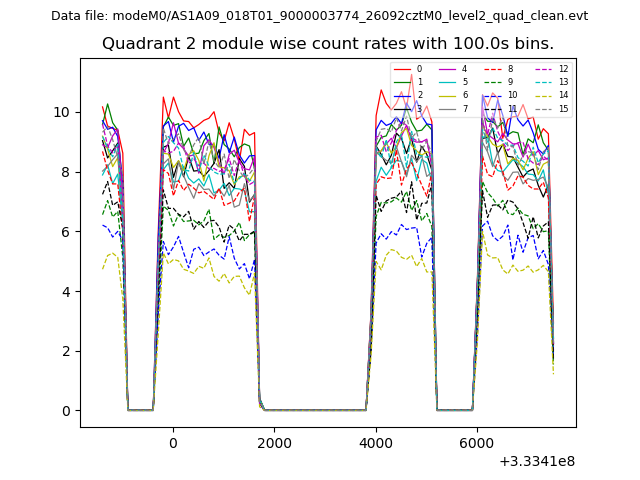
| Module-wise count rates for Quadrant B Data is divided into 100 sec bins |
 |
 |
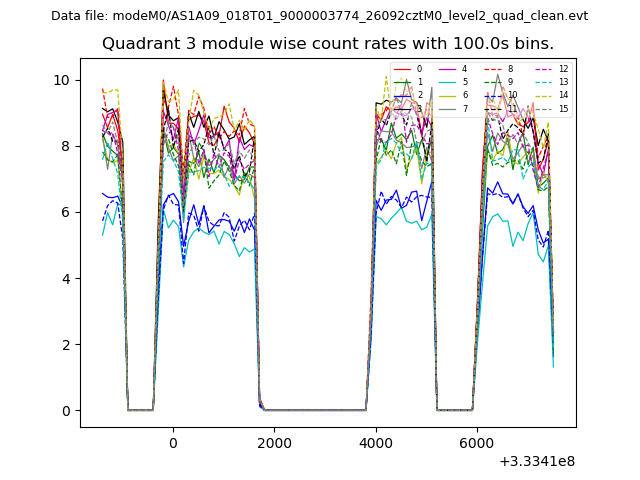
| Module-wise count rates for Quadrant C Data is divided into 100 sec bins |
 |
 |
| Module-wise count rates for Quadrant D Data is divided into 100 sec bins |
 |
 |
| Parameter | Plot |
|---|---|
| CZT HV Monitor | 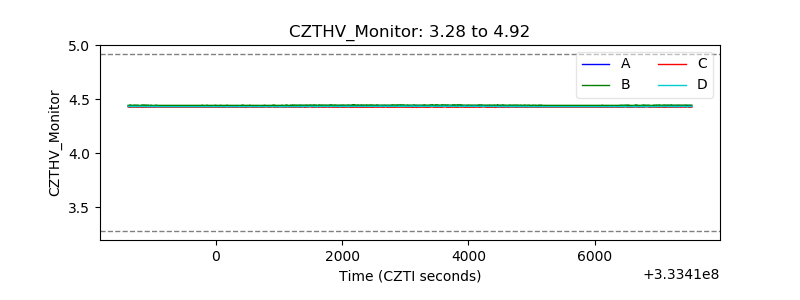 |
| D_VDD | 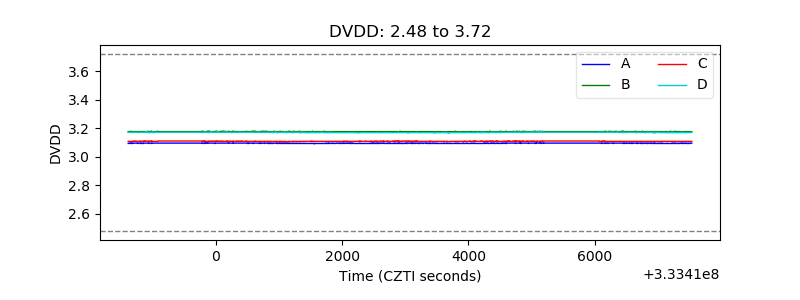 |
| Temperature 1 | 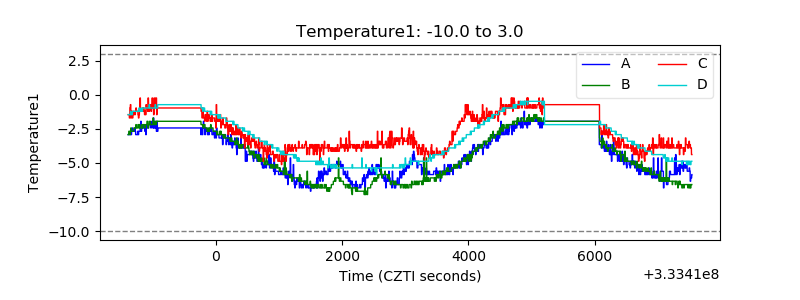 |
| Veto HV Monitor | 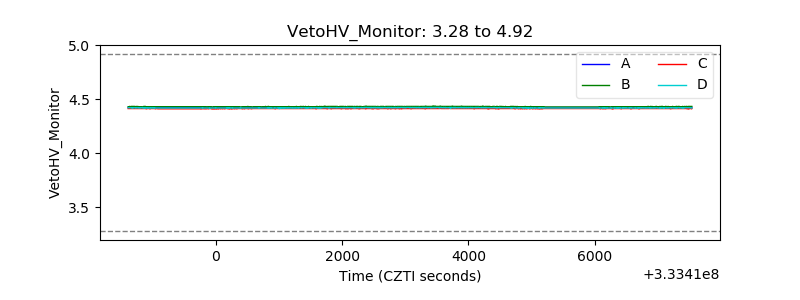 |
| Veto LLD | 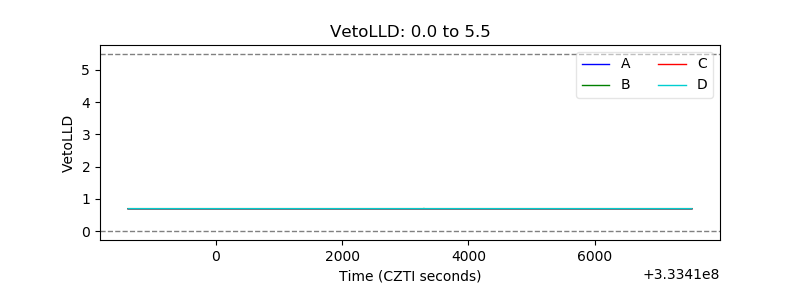 |
| Alpha Counter | 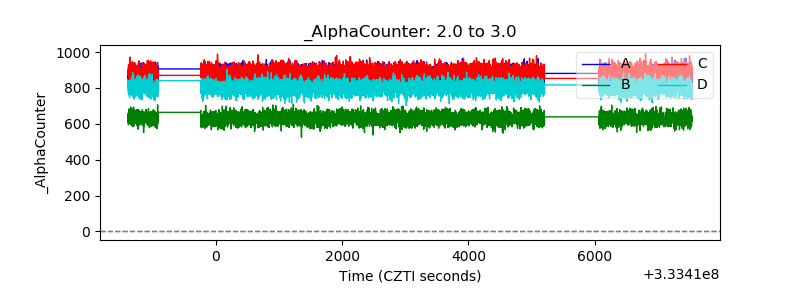 |
| _CPM_Rate | 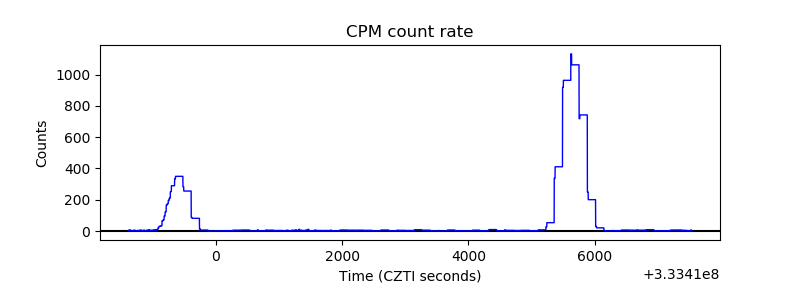 |
| CZT Counter | 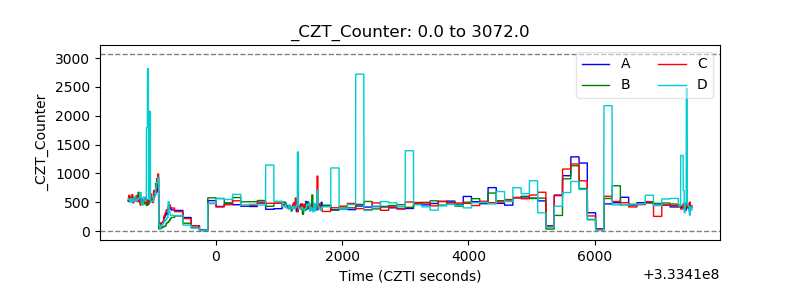 |
| +2.5 Volts monitor |  |
| +5 Volts monitor | 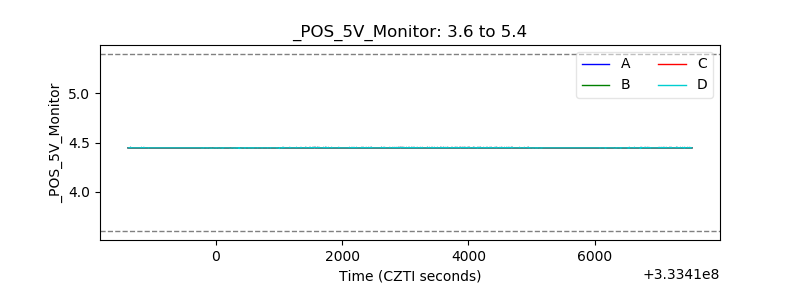 |
| _ROLL_ROT | 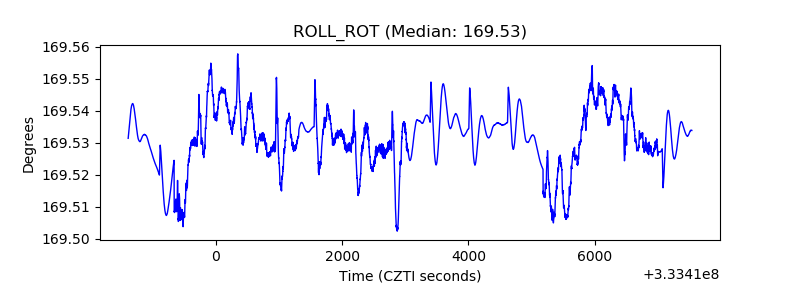 |
| _Roll_DEC | 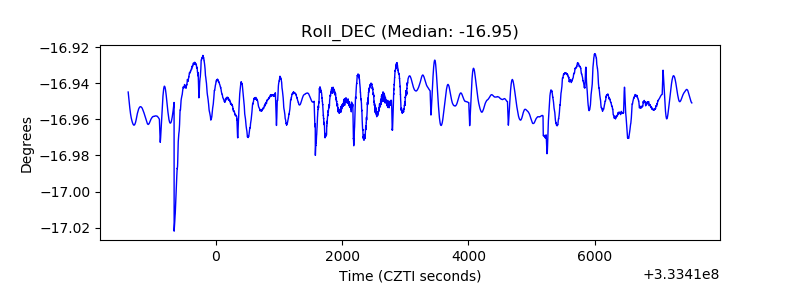 |
| _Roll_RA | 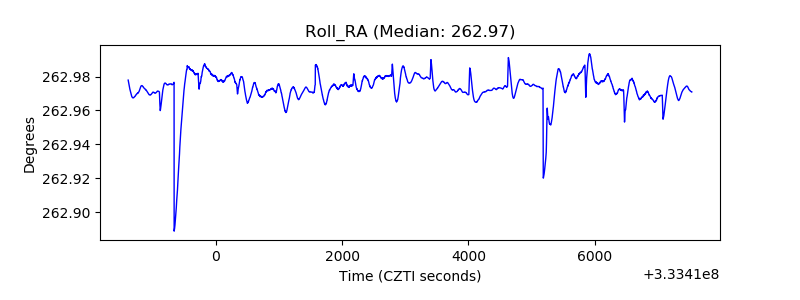 |
| Veto Counter | 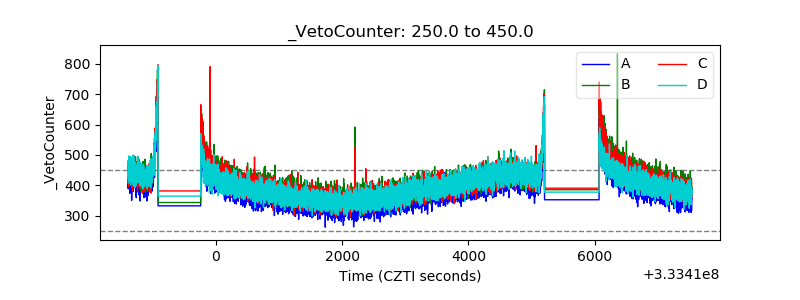 |