| Param | Original file | Final file |
|---|---|---|
| Filename | modeM0/AS1A09_018T01_9000003774_26093cztM0_level2.evt | modeM0/AS1A09_018T01_9000003774_26093cztM0_level2_quad_clean.evt |
| Size (bytes) | 492,324,480 | 87,531,840 |
| Size | 469.5 MB | 83.5 MB |
| Events in quadrant A | 3,150,949 | 568,837 |
| Events in quadrant B | 3,232,177 | 582,349 |
| Events in quadrant C | 3,235,586 | 541,304 |
| Events in quadrant D | 4,843,294 | 498,126 |
| Mode M0 | |||
|---|---|---|---|
| Quadrant | BADHDUFLAG | Total packets | Discarded packets |
| A | 0 | 13466 | 0 |
| B | 0 | 13639 | 0 |
| C | 0 | 13666 | 0 |
| D | 0 | 18850 | 0 |
| Mode M9 | |||
|---|---|---|---|
| Quadrant | BADHDUFLAG | Total packets | Discarded packets |
| A | 0 | 10 | 0 |
| B | 0 | 11 | 0 |
| C | 0 | 11 | 0 |
| D | 0 | 11 | 0 |
| Quadrant | Total seconds | Saturated seconds | Saturation percentage |
|---|---|---|---|
| A | 6589 | 27 | 0.409774% |
| B | 6589 | 26 | 0.394597% |
| C | 6588 | 80 | 1.214329% |
| D | 6588 | 599 | 9.092289% |
Noise dominated data is calculated using 1-second bins in cleaned event files. If a bin has >2000 counts, and if more than 50% of those come from <1% of pixels, then it is considered to be noise-dominated and hence unusable.
| Quadrant | # 1 sec bins | Bins with >0 counts | Bins with >2000 counts | High rate bins dominated by noise | Noise dominated (total time) | Noise dominated (detector-on time) | Marked lightcurve |
|---|---|---|---|---|---|---|---|
| A | 7614 | 6590 | 0 | 0 | 0.00% | 0.00% | 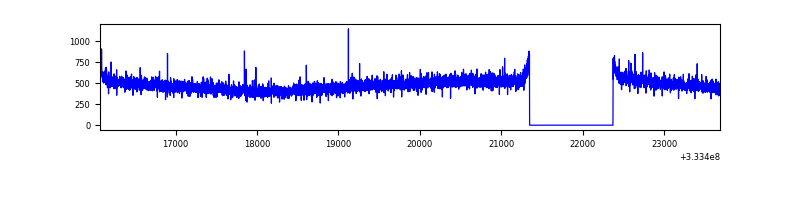 |
| B | 7614 | 6589 | 0 | 0 | 0.00% | 0.00% | 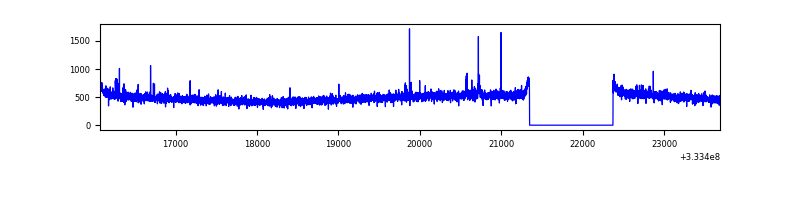 |
| C | 7613 | 6588 | 24 | 24 | 0.32% | 0.36% | 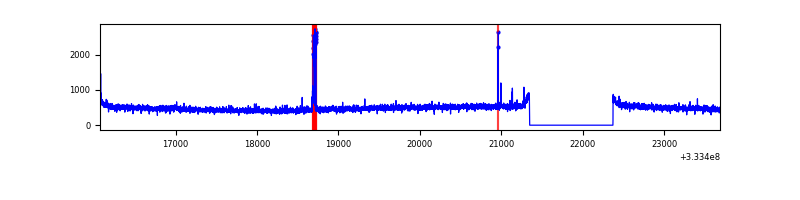 |
| D | 7613 | 6588 | 554 | 554 | 7.28% | 8.41% | 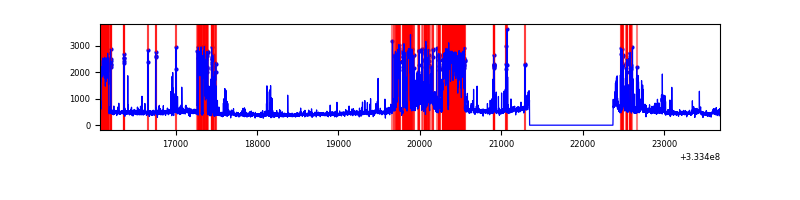 |
Top three noisy pixels from each quadrant. If the there are fewer than three noisy pixels in the level2.evt file, extra rows are filled as -1
| Pixel properties | Quadrant properties | ||||||
|---|---|---|---|---|---|---|---|
| Quadrant | DetID | PixID | Counts | Sigma | Mean | Median | Sigma |
| A | 13 | 254 | 11343 | 64.29 | 816 | 800 | 164.0 |
| A | 3 | 137 | 7515 | 40.95 | 816 | 800 | 164.0 |
| A | 0 | 226 | 7092 | 38.37 | 816 | 800 | 164.0 |
| B | 0 | 190 | 19552 | 119.99 | 813 | 793 | 156.3 |
| B | 12 | 111 | 19162 | 117.5 | 813 | 793 | 156.3 |
| B | 11 | 111 | 16918 | 103.15 | 813 | 793 | 156.3 |
| C | 14 | 238 | 123871 | 673.48 | 773 | 776 | 182.8 |
| C | 14 | 225 | 64765 | 350.1 | 773 | 776 | 182.8 |
| C | 3 | 233 | 35839 | 191.84 | 773 | 776 | 182.8 |
| D | 7 | 80 | 931768 | 5214.89 | 745 | 728 | 178.5 |
| D | 1 | 52 | 875472 | 4899.57 | 745 | 728 | 178.5 |
| D | 12 | 233 | 182066 | 1015.7 | 745 | 728 | 178.5 |
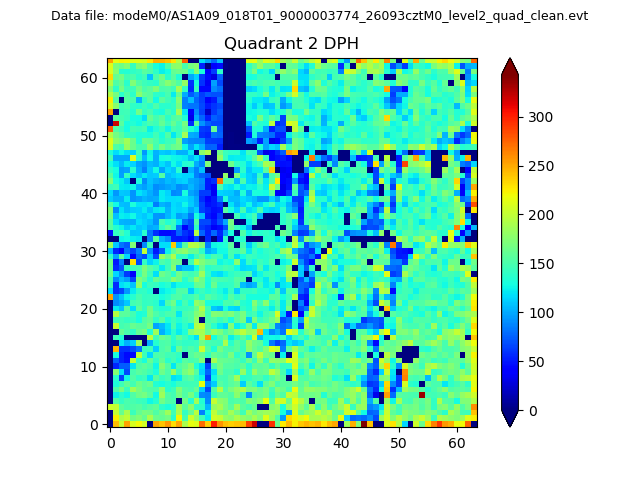
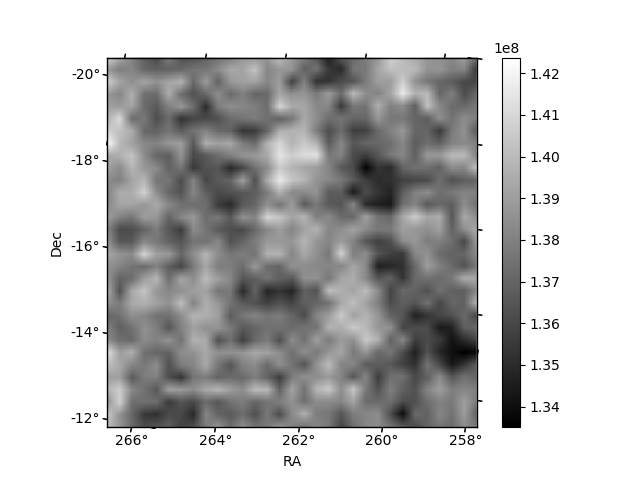
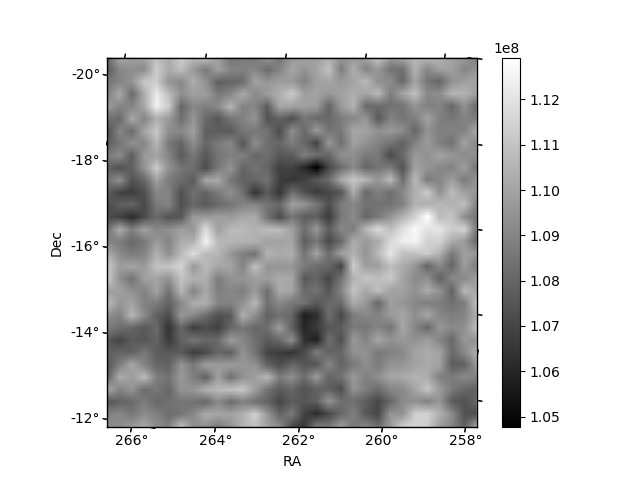
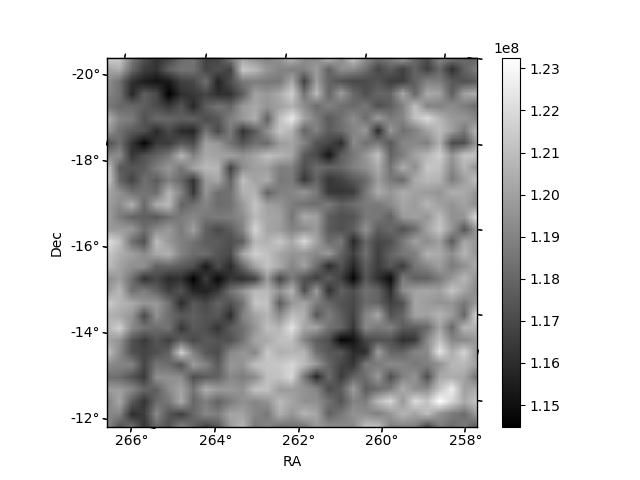
Histogram calculated using DETX and DETY for each event in the final _common_clean file
| Quadrant A | 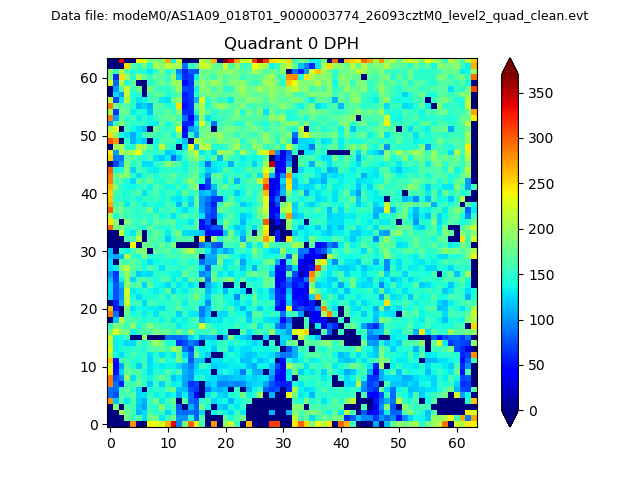 |
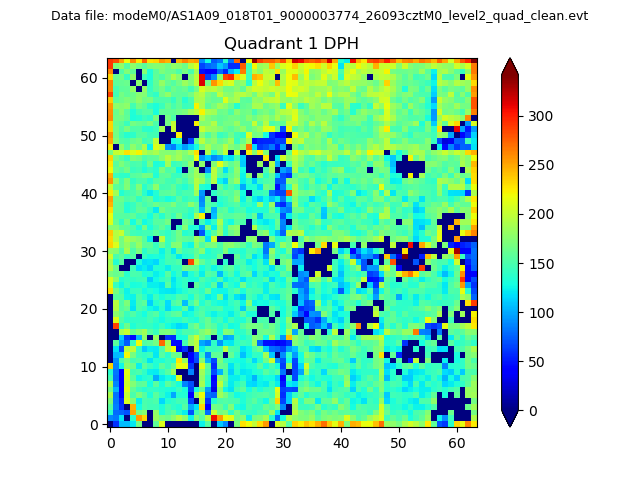 |
Quadrant B |
|---|---|---|---|
| Quadrant D | 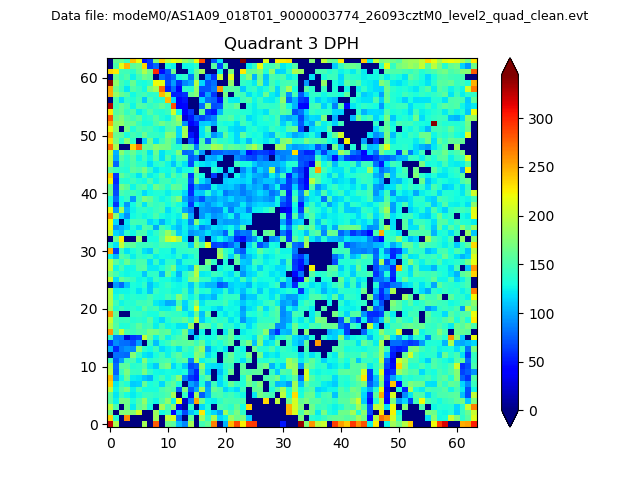 |
 |
Quadrant C |
| Plot type | Count rate plots | Images |
|---|---|---|
| Comparison with Poisson distribution Blue bars denote a histogram of data divided into 1 sec bins. Red curve is a Poisson curve with rate = median count rate of data. |
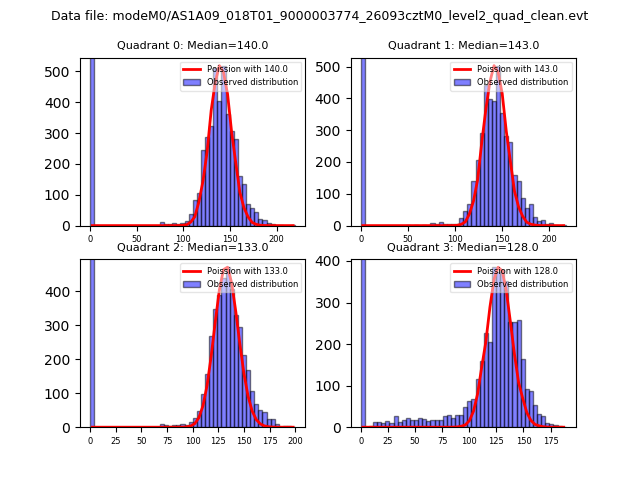 |
 |
| Quadrant-wise count rates Data is divided into 100 sec bins |
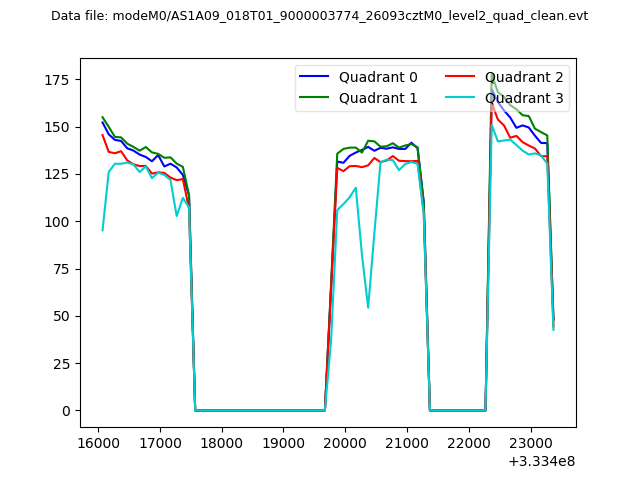 |
|
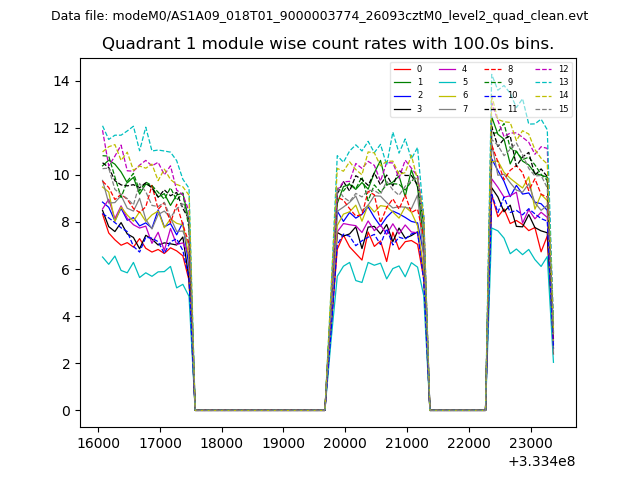
| Module-wise count rates for Quadrant A Data is divided into 100 sec bins |
 |
 |
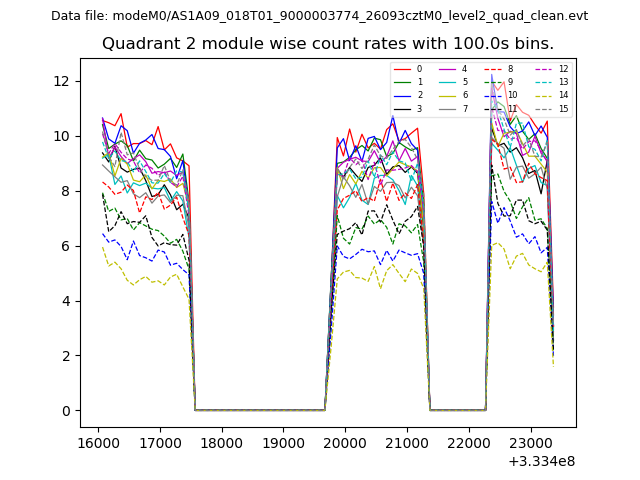
| Module-wise count rates for Quadrant B Data is divided into 100 sec bins |
 |
 |
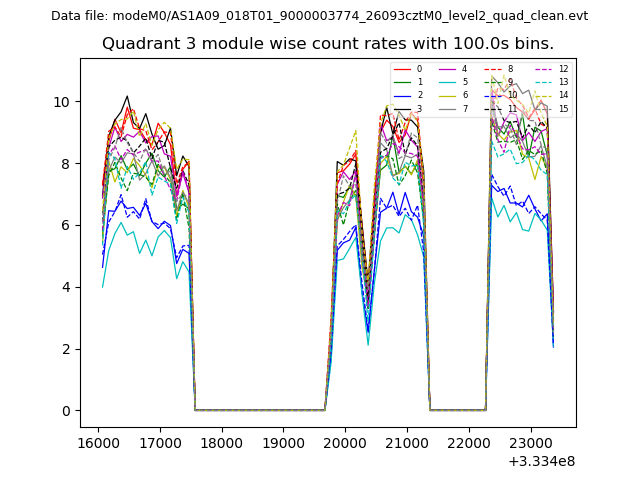
| Module-wise count rates for Quadrant C Data is divided into 100 sec bins |
 |
 |
| Module-wise count rates for Quadrant D Data is divided into 100 sec bins |
 |
 |
| Parameter | Plot |
|---|---|
| CZT HV Monitor |  |
| D_VDD | 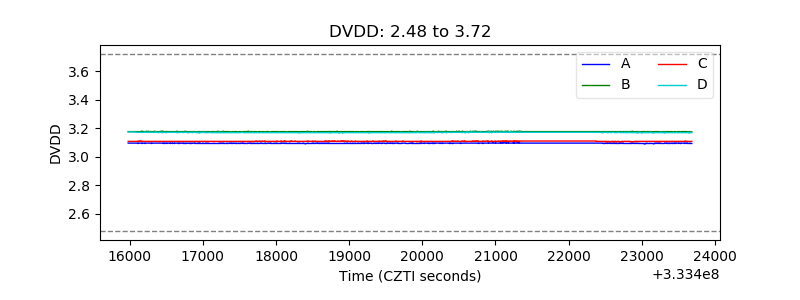 |
| Temperature 1 | 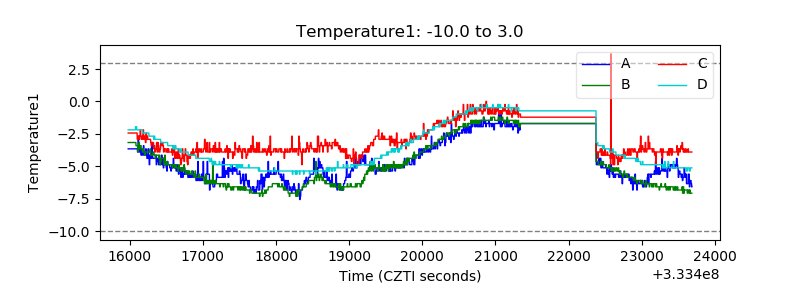 |
| Veto HV Monitor | 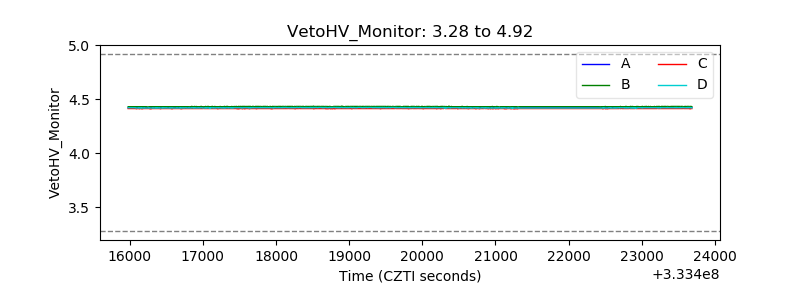 |
| Veto LLD |  |
| Alpha Counter | 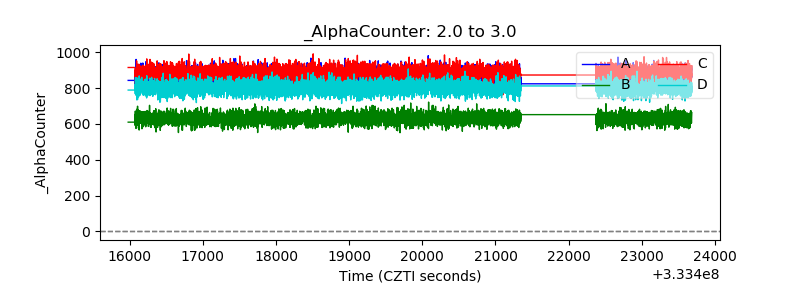 |
| _CPM_Rate | 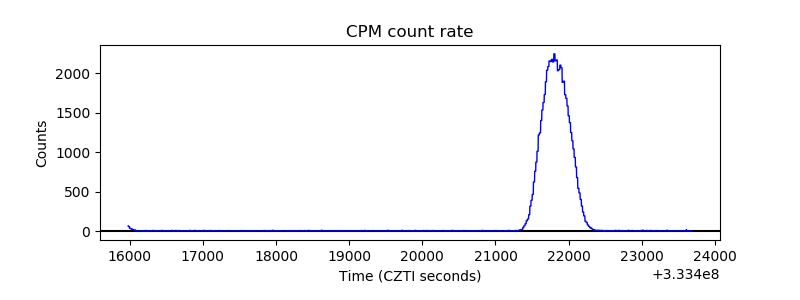 |
| CZT Counter | 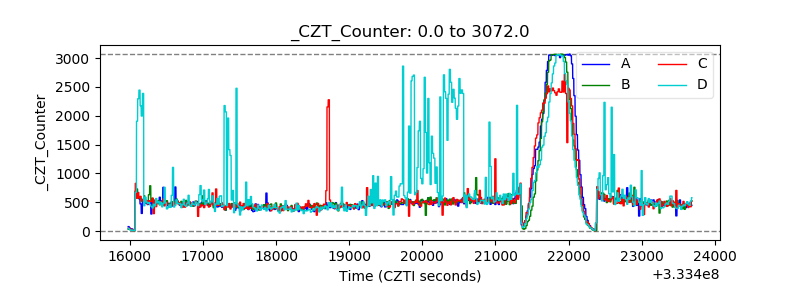 |
| +2.5 Volts monitor | 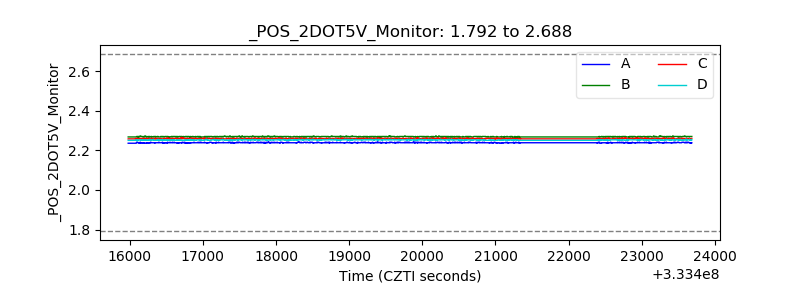 |
| +5 Volts monitor |  |
| _ROLL_ROT |  |
| _Roll_DEC | 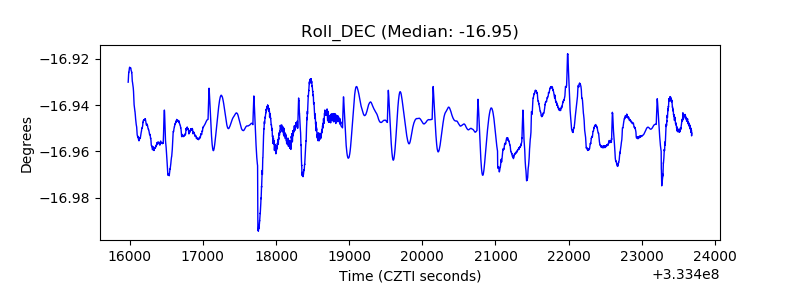 |
| _Roll_RA | 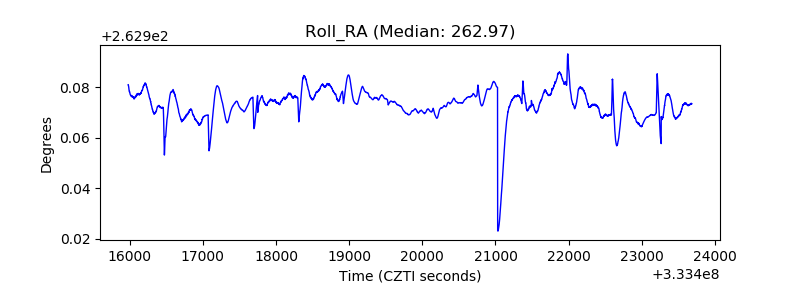 |
| Veto Counter |  |