| Param | Original file | Final file |
|---|---|---|
| Filename | modeM0/AS1A09_018T01_9000003774_26095cztM0_level2.evt | modeM0/AS1A09_018T01_9000003774_26095cztM0_level2_quad_clean.evt |
| Size (bytes) | 472,803,840 | 81,961,920 |
| Size | 450.9 MB | 78.2 MB |
| Events in quadrant A | 3,203,709 | 521,806 |
| Events in quadrant B | 3,269,938 | 535,413 |
| Events in quadrant C | 3,264,041 | 495,624 |
| Events in quadrant D | 4,144,009 | 479,886 |
| Mode M0 | |||
|---|---|---|---|
| Quadrant | BADHDUFLAG | Total packets | Discarded packets |
| A | 0 | 13360 | 0 |
| B | 0 | 13568 | 0 |
| C | 0 | 13515 | 0 |
| D | 0 | 16574 | 0 |
| Mode M9 | |||
|---|---|---|---|
| Quadrant | BADHDUFLAG | Total packets | Discarded packets |
| A | 0 | 16 | 0 |
| B | 0 | 17 | 0 |
| C | 0 | 17 | 0 |
| D | 0 | 17 | 0 |
| Quadrant | Total seconds | Saturated seconds | Saturation percentage |
|---|---|---|---|
| A | 6435 | 32 | 0.497280% |
| B | 6434 | 34 | 0.528443% |
| C | 6434 | 65 | 1.010258% |
| D | 6434 | 86 | 1.336649% |
Noise dominated data is calculated using 1-second bins in cleaned event files. If a bin has >2000 counts, and if more than 50% of those come from <1% of pixels, then it is considered to be noise-dominated and hence unusable.
| Quadrant | # 1 sec bins | Bins with >0 counts | Bins with >2000 counts | High rate bins dominated by noise | Noise dominated (total time) | Noise dominated (detector-on time) | Marked lightcurve |
|---|---|---|---|---|---|---|---|
| A | 7585 | 6435 | 0 | 0 | 0.00% | 0.00% | 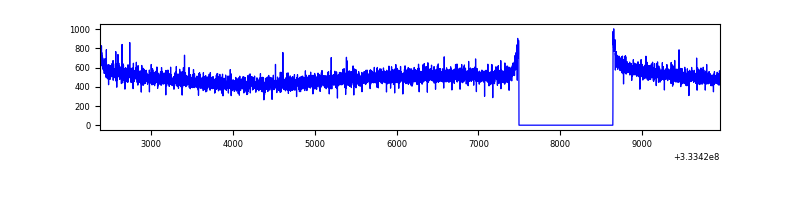 |
| B | 7584 | 6434 | 0 | 0 | 0.00% | 0.00% | 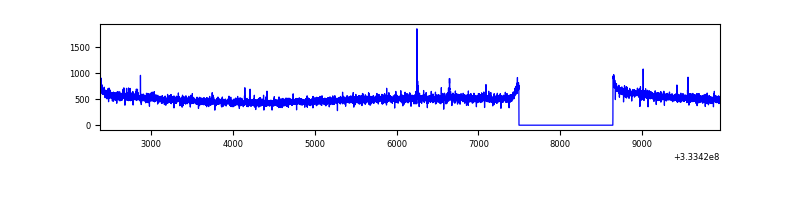 |
| C | 7584 | 6434 | 0 | 0 | 0.00% | 0.00% | 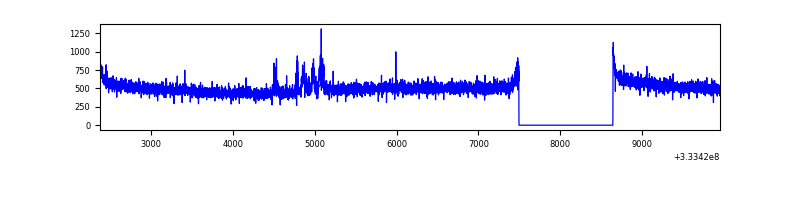 |
| D | 7584 | 6434 | 51 | 51 | 0.67% | 0.79% | 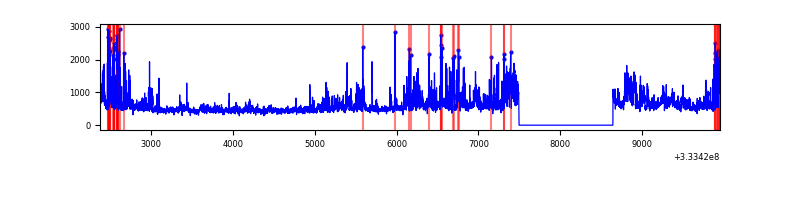 |
Top three noisy pixels from each quadrant. If the there are fewer than three noisy pixels in the level2.evt file, extra rows are filled as -1
| Pixel properties | Quadrant properties | ||||||
|---|---|---|---|---|---|---|---|
| Quadrant | DetID | PixID | Counts | Sigma | Mean | Median | Sigma |
| A | 13 | 254 | 10438 | 58.09 | 829 | 812 | 165.7 |
| A | 3 | 137 | 7568 | 40.77 | 829 | 812 | 165.7 |
| A | 0 | 226 | 7166 | 38.35 | 829 | 812 | 165.7 |
| B | 12 | 111 | 19308 | 117.02 | 830 | 813 | 158.0 |
| B | 11 | 111 | 16934 | 102.0 | 830 | 813 | 158.0 |
| B | 14 | 111 | 15507 | 92.97 | 830 | 813 | 158.0 |
| C | 14 | 238 | 129091 | 697.03 | 787 | 793 | 184.1 |
| C | 3 | 233 | 61551 | 330.09 | 787 | 793 | 184.1 |
| C | 13 | 61 | 5421 | 25.14 | 787 | 793 | 184.1 |
| D | 1 | 52 | 1025232 | 5451.81 | 786 | 766 | 187.9 |
| D | 7 | 80 | 95918 | 506.36 | 786 | 766 | 187.9 |
| D | 2 | 234 | 26185 | 135.27 | 786 | 766 | 187.9 |
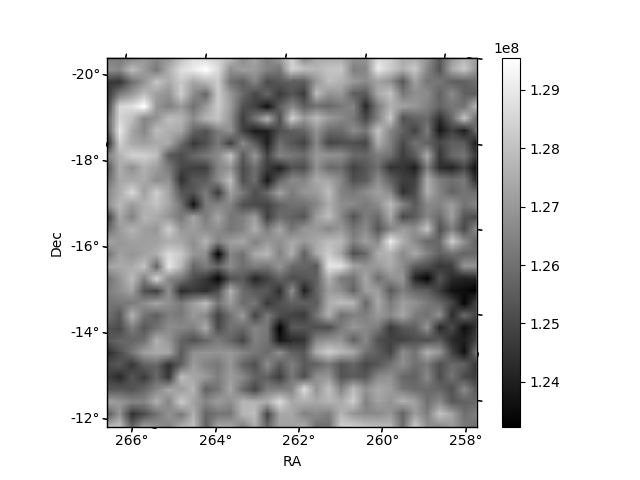
Histogram calculated using DETX and DETY for each event in the final _common_clean file
| Quadrant A |  |
 |
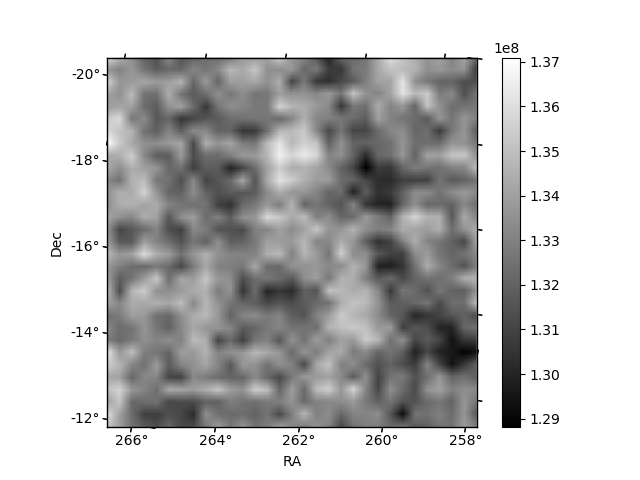
Quadrant B |
|---|---|---|---|
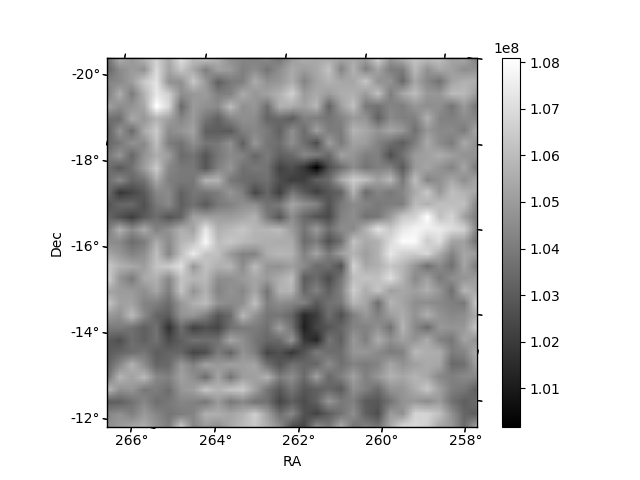
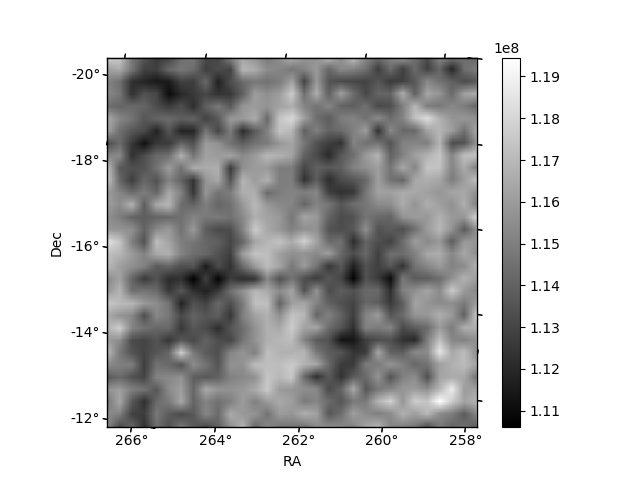
| Quadrant D | 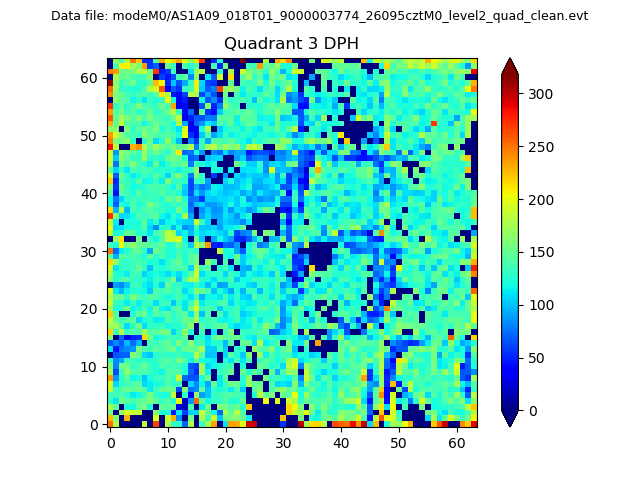 |
 |
Quadrant C |
| Plot type | Count rate plots | Images |
|---|---|---|
| Comparison with Poisson distribution Blue bars denote a histogram of data divided into 1 sec bins. Red curve is a Poisson curve with rate = median count rate of data. |
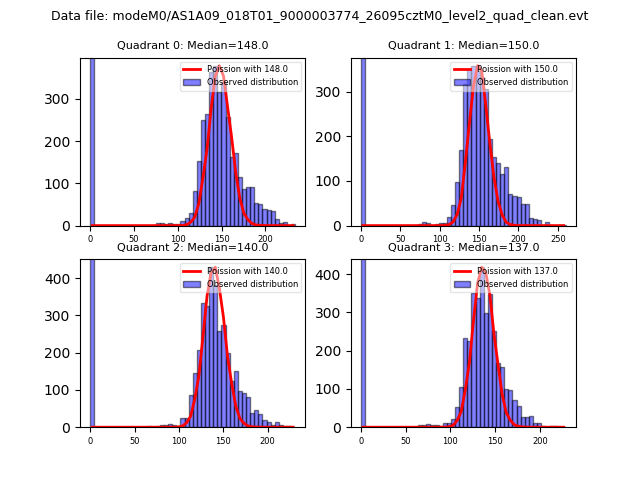 |
 |
| Quadrant-wise count rates Data is divided into 100 sec bins |
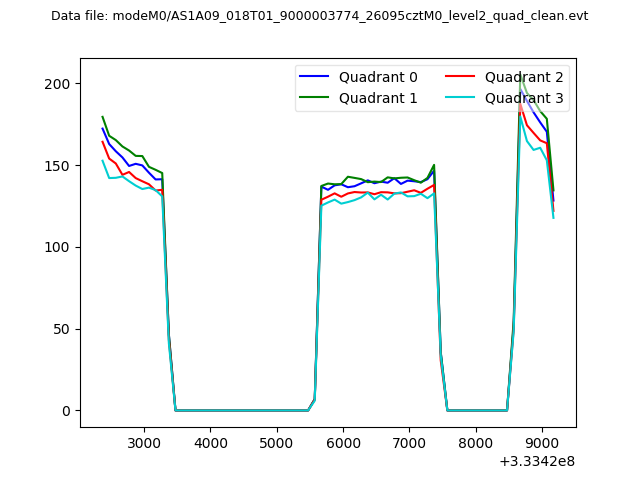 |
|
| Module-wise count rates for Quadrant A Data is divided into 100 sec bins |
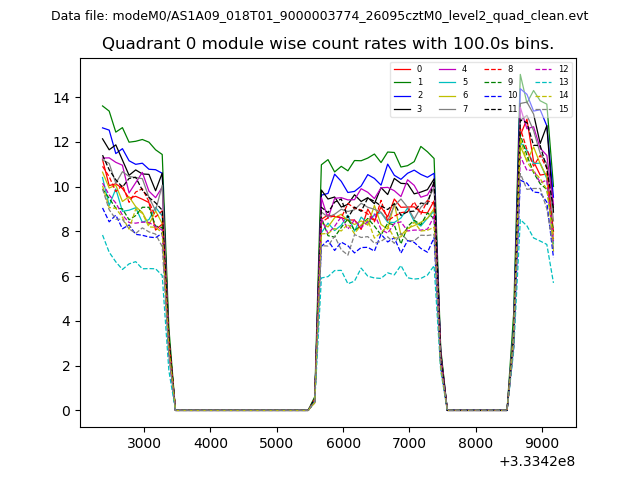 |
 |
| Module-wise count rates for Quadrant B Data is divided into 100 sec bins |
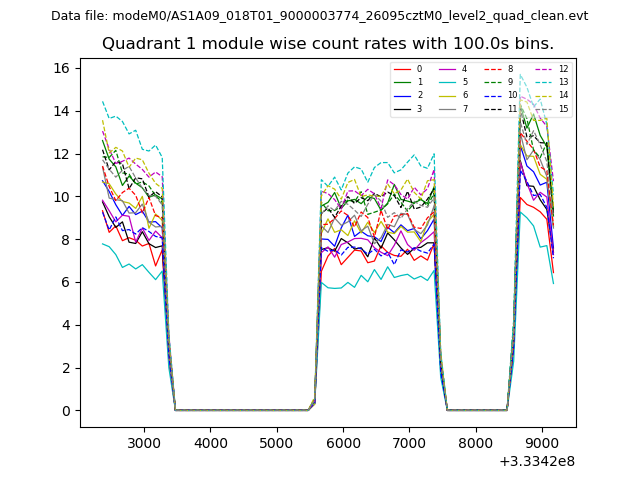 |
 |
| Module-wise count rates for Quadrant C Data is divided into 100 sec bins |
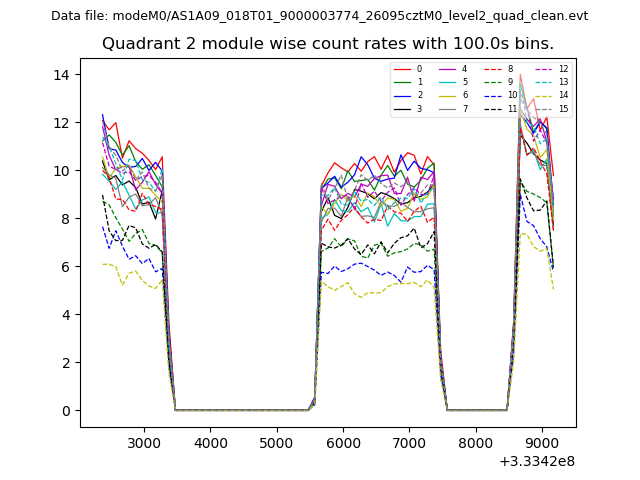 |
 |
| Module-wise count rates for Quadrant D Data is divided into 100 sec bins |
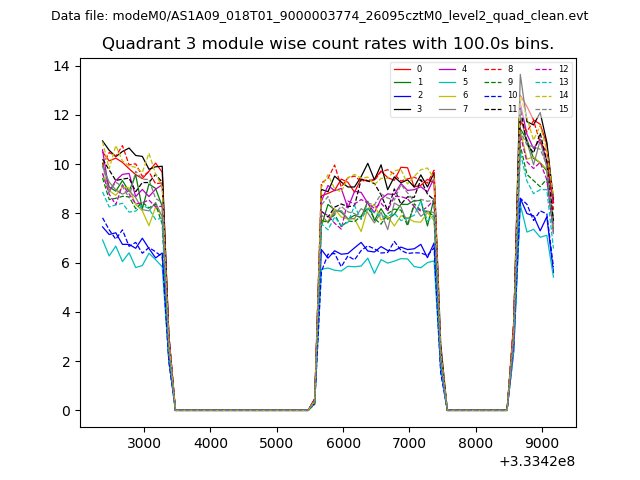 |
 |
| Parameter | Plot |
|---|---|
| CZT HV Monitor | 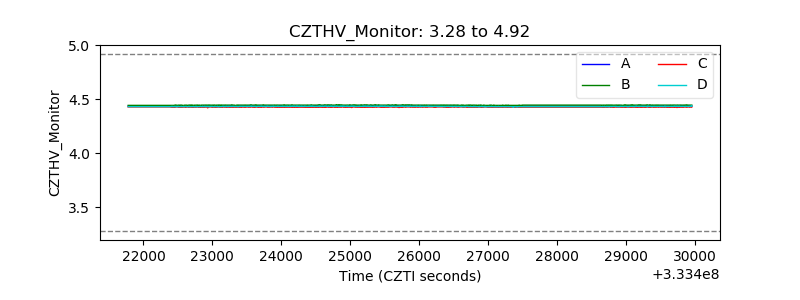 |
| D_VDD | 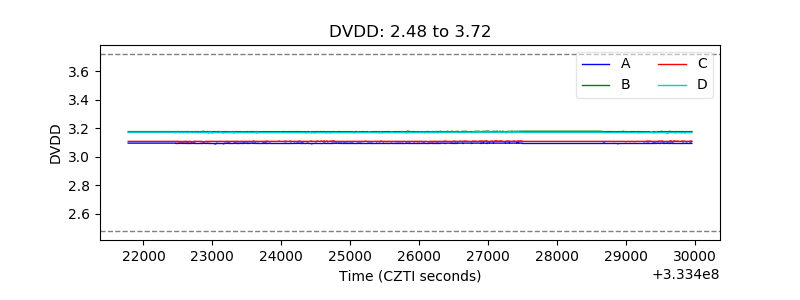 |
| Temperature 1 | 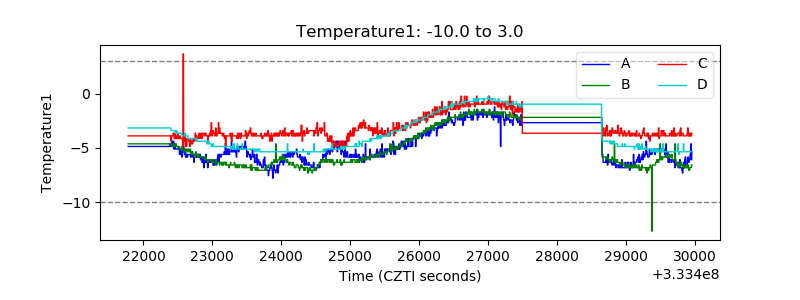 |
| Veto HV Monitor | 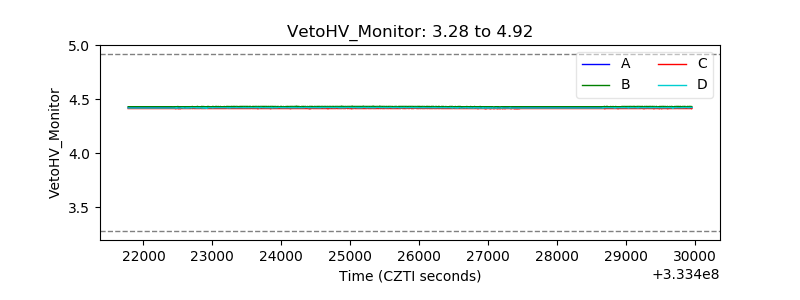 |
| Veto LLD | 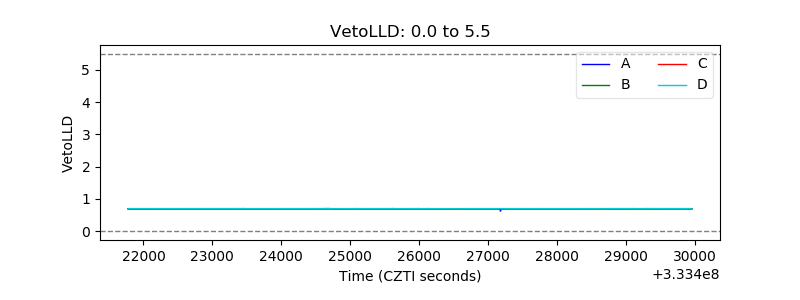 |
| Alpha Counter | 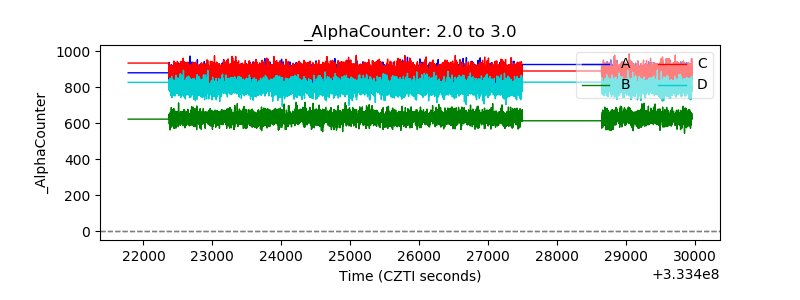 |
| _CPM_Rate | 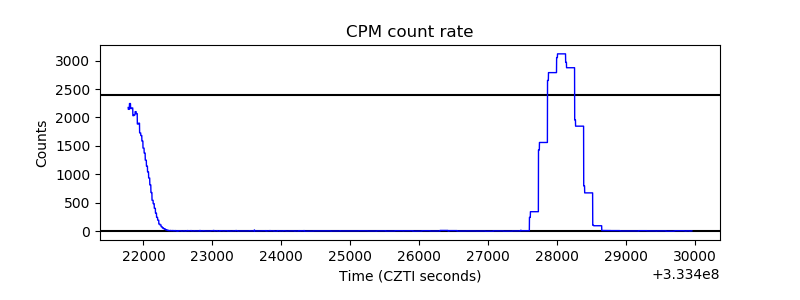 |
| CZT Counter | 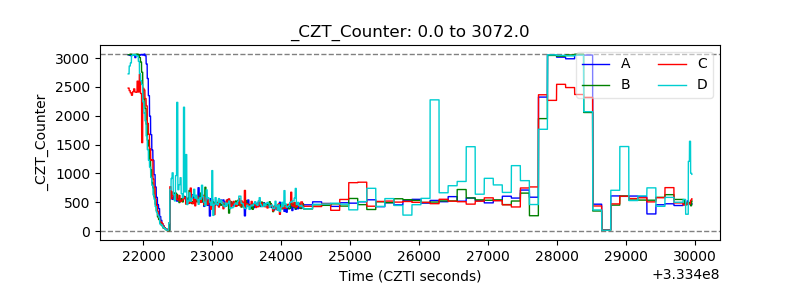 |
| +2.5 Volts monitor |  |
| +5 Volts monitor | 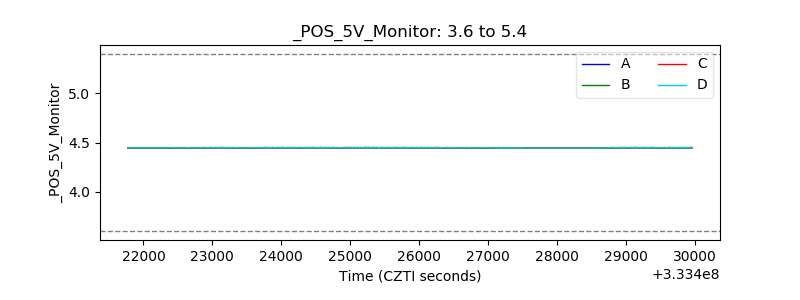 |
| _ROLL_ROT | 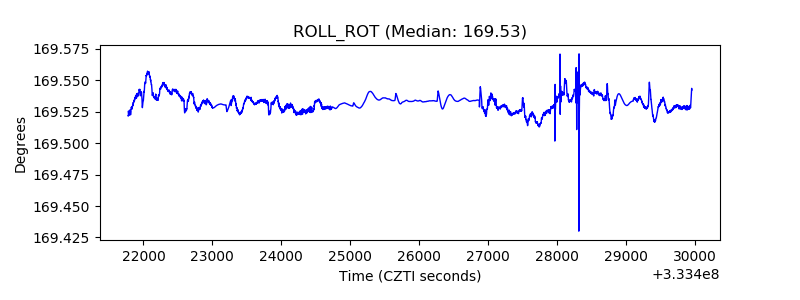 |
| _Roll_DEC | 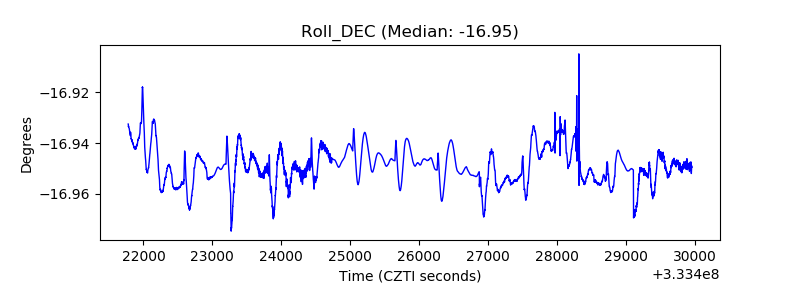 |
| _Roll_RA | 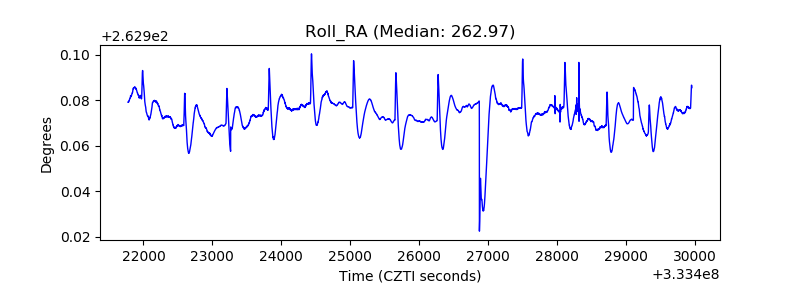 |
| Veto Counter | 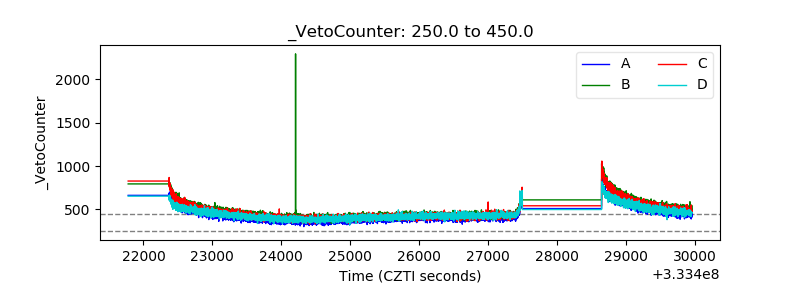 |