| Param | Original file | Final file |
|---|---|---|
| Filename | modeM0/AS1A09_018T01_9000003774_26096cztM0_level2.evt | modeM0/AS1A09_018T01_9000003774_26096cztM0_level2_quad_clean.evt |
| Size (bytes) | 496,267,200 | 72,930,240 |
| Size | 473.3 MB | 69.6 MB |
| Events in quadrant A | 3,355,816 | 451,893 |
| Events in quadrant B | 3,475,867 | 464,834 |
| Events in quadrant C | 3,369,184 | 429,504 |
| Events in quadrant D | 4,394,844 | 415,797 |
| Mode M0 | |||
|---|---|---|---|
| Quadrant | BADHDUFLAG | Total packets | Discarded packets |
| A | 0 | 13669 | 0 |
| B | 0 | 14115 | 0 |
| C | 0 | 13709 | 0 |
| D | 0 | 17163 | 0 |
| Mode M9 | |||
|---|---|---|---|
| Quadrant | BADHDUFLAG | Total packets | Discarded packets |
| A | 0 | 19 | 0 |
| B | 0 | 20 | 0 |
| C | 0 | 20 | 0 |
| D | 0 | 20 | 0 |
| Quadrant | Total seconds | Saturated seconds | Saturation percentage |
|---|---|---|---|
| A | 6395 | 17 | 0.265833% |
| B | 6395 | 29 | 0.453479% |
| C | 6394 | 66 | 1.032218% |
| D | 6394 | 103 | 1.610885% |
Noise dominated data is calculated using 1-second bins in cleaned event files. If a bin has >2000 counts, and if more than 50% of those come from <1% of pixels, then it is considered to be noise-dominated and hence unusable.
| Quadrant | # 1 sec bins | Bins with >0 counts | Bins with >2000 counts | High rate bins dominated by noise | Noise dominated (total time) | Noise dominated (detector-on time) | Marked lightcurve |
|---|---|---|---|---|---|---|---|
| A | 7690 | 6395 | 0 | 0 | 0.00% | 0.00% | 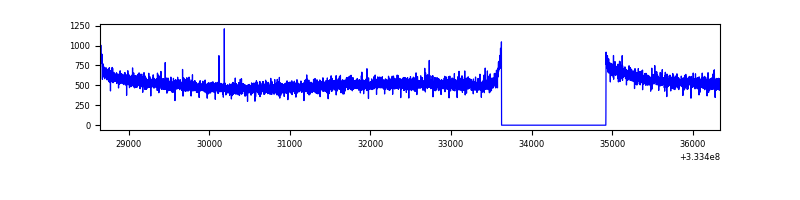 |
| B | 7690 | 6395 | 0 | 0 | 0.00% | 0.00% | 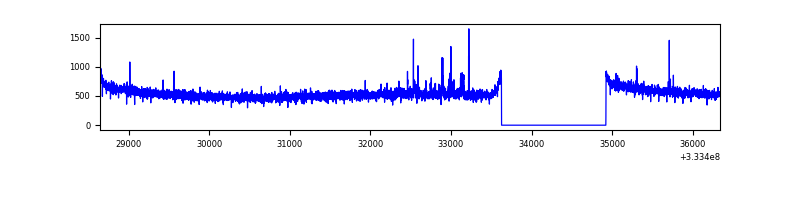 |
| C | 7689 | 6394 | 0 | 0 | 0.00% | 0.00% | 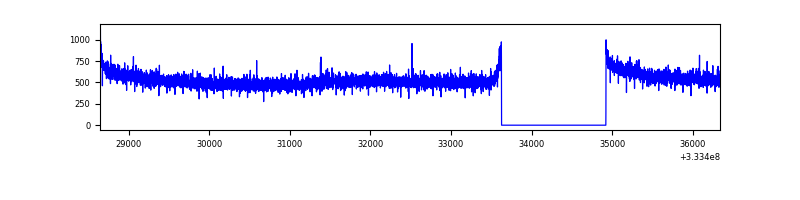 |
| D | 7689 | 6394 | 109 | 109 | 1.42% | 1.70% | 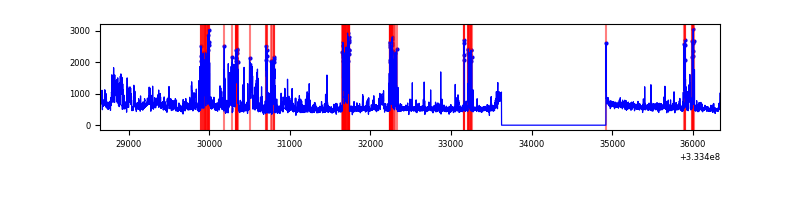 |
Top three noisy pixels from each quadrant. If the there are fewer than three noisy pixels in the level2.evt file, extra rows are filled as -1
| Pixel properties | Quadrant properties | ||||||
|---|---|---|---|---|---|---|---|
| Quadrant | DetID | PixID | Counts | Sigma | Mean | Median | Sigma |
| A | 13 | 254 | 10303 | 54.78 | 869 | 855 | 172.5 |
| A | 3 | 137 | 7469 | 38.35 | 869 | 855 | 172.5 |
| A | 0 | 226 | 7357 | 37.7 | 869 | 855 | 172.5 |
| B | 7 | 219 | 24668 | 146.31 | 872 | 854 | 162.8 |
| B | 12 | 111 | 19579 | 115.04 | 872 | 854 | 162.8 |
| B | 11 | 111 | 17444 | 101.92 | 872 | 854 | 162.8 |
| C | 14 | 238 | 137871 | 717.35 | 826 | 833 | 191.0 |
| C | 3 | 233 | 9811 | 47.0 | 826 | 833 | 191.0 |
| C | 13 | 61 | 5724 | 25.6 | 826 | 833 | 191.0 |
| D | 1 | 52 | 736182 | 3755.14 | 821 | 802 | 195.8 |
| D | 7 | 80 | 339497 | 1729.51 | 821 | 802 | 195.8 |
| D | 13 | 168 | 109952 | 557.36 | 821 | 802 | 195.8 |
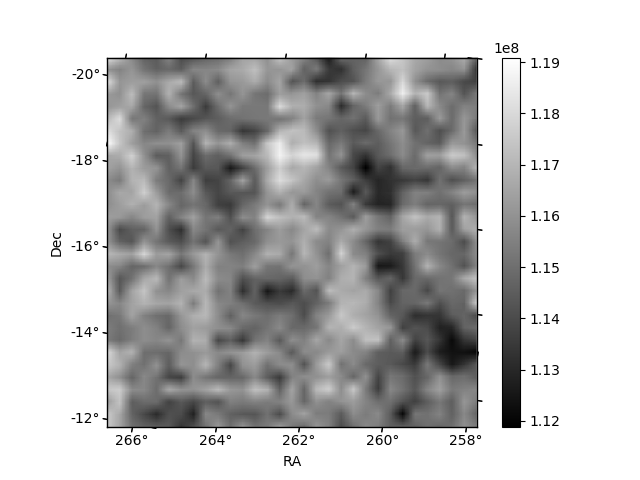
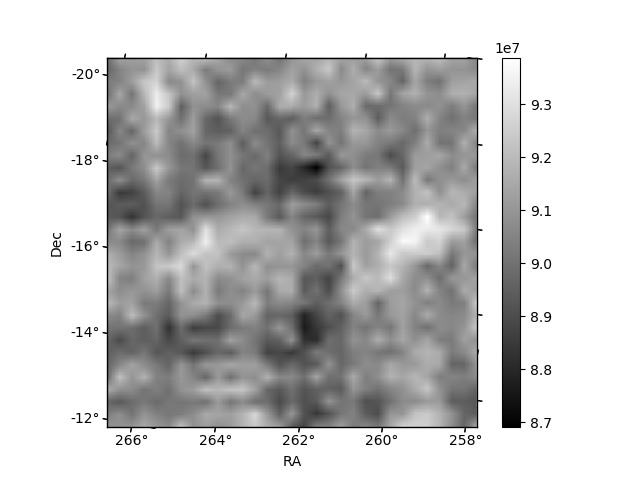
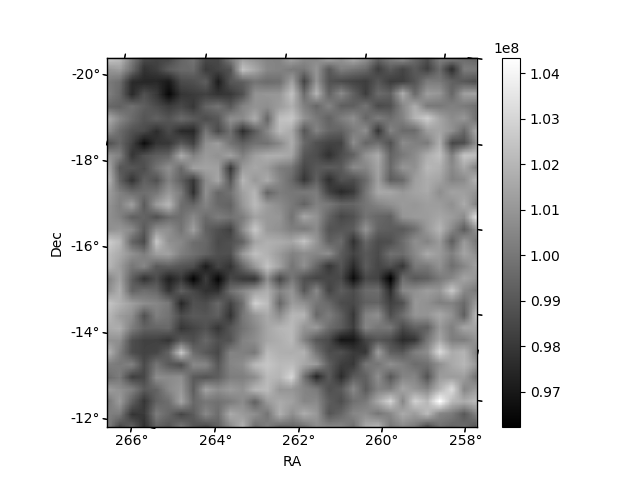
Histogram calculated using DETX and DETY for each event in the final _common_clean file
| Quadrant A | 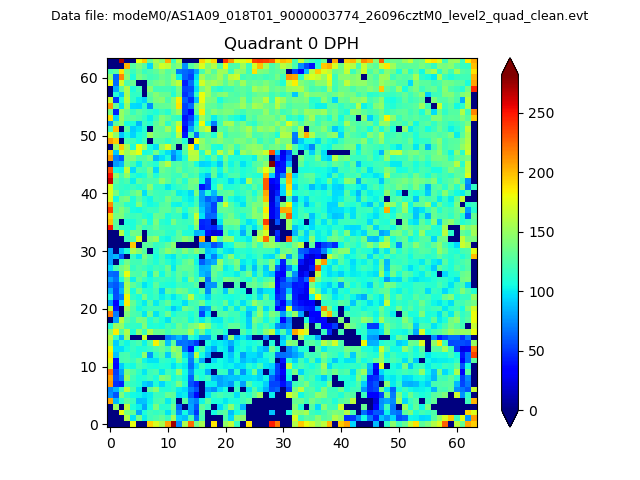 |
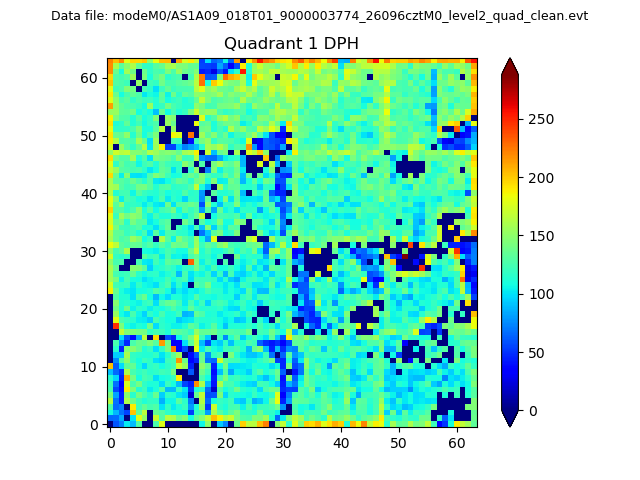 |
Quadrant B |
|---|---|---|---|
| Quadrant D | 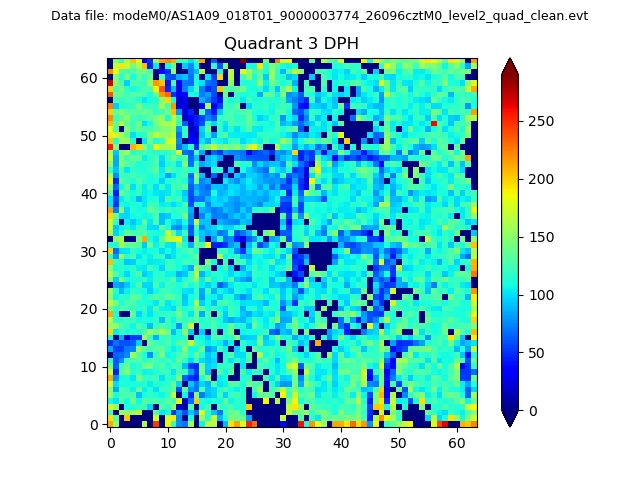 |
 |
Quadrant C |
| Plot type | Count rate plots | Images |
|---|---|---|
| Comparison with Poisson distribution Blue bars denote a histogram of data divided into 1 sec bins. Red curve is a Poisson curve with rate = median count rate of data. |
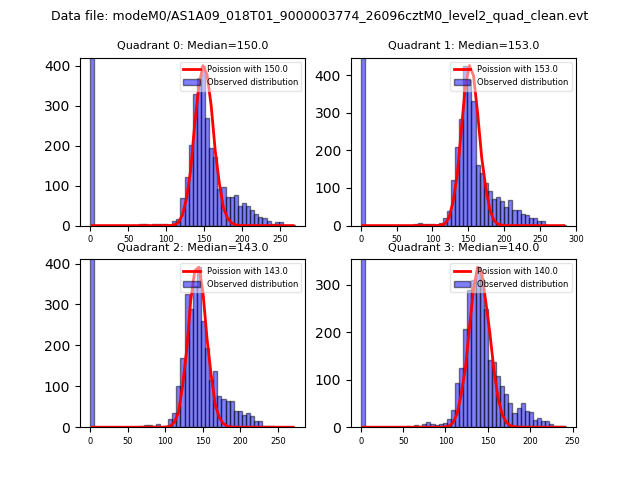 |
 |
| Quadrant-wise count rates Data is divided into 100 sec bins |
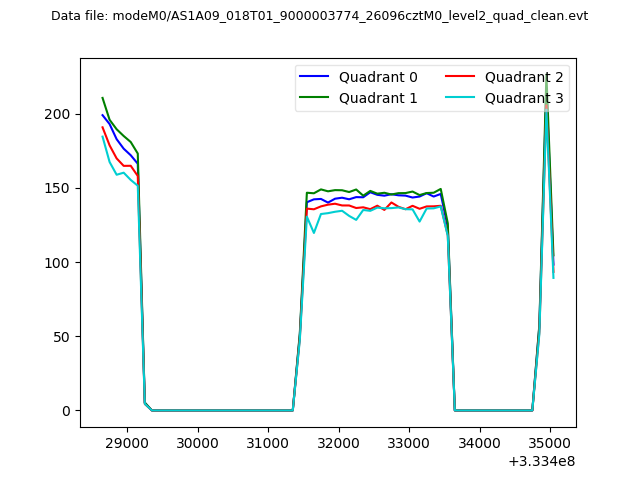 |
|
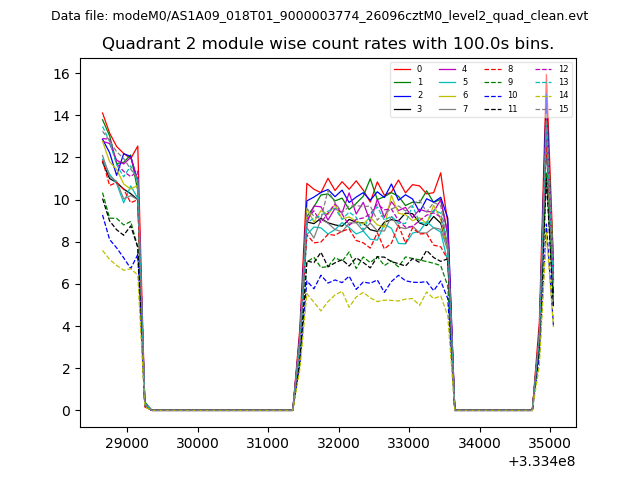
| Module-wise count rates for Quadrant A Data is divided into 100 sec bins |
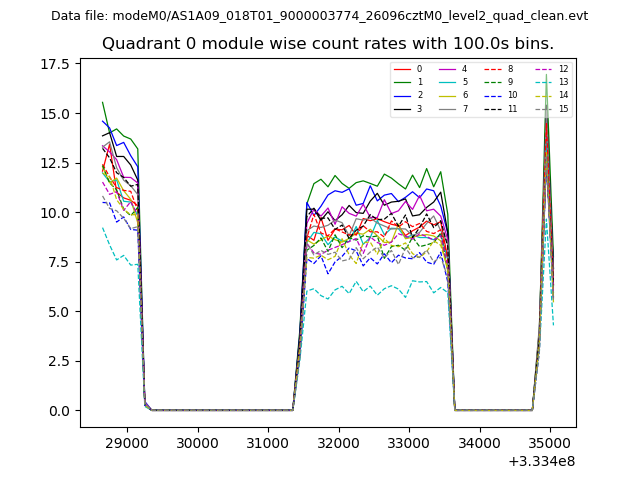 |
 |
| Module-wise count rates for Quadrant B Data is divided into 100 sec bins |
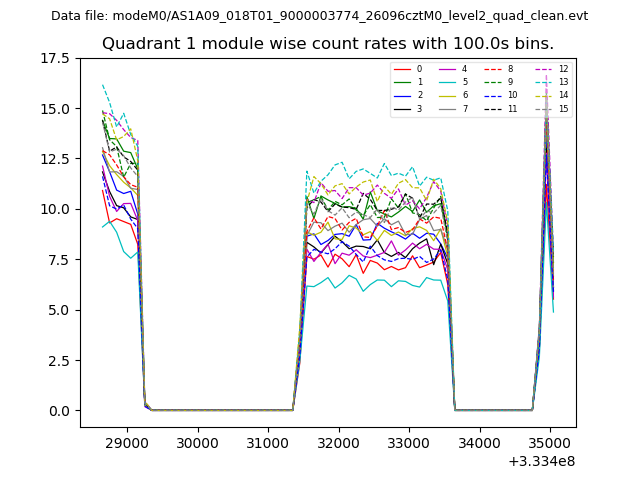 |
 |
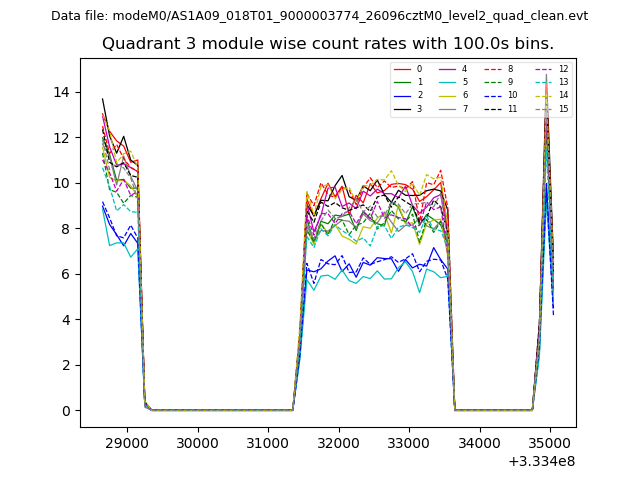
| Module-wise count rates for Quadrant C Data is divided into 100 sec bins |
 |
 |
| Module-wise count rates for Quadrant D Data is divided into 100 sec bins |
 |
 |
| Parameter | Plot |
|---|---|
| CZT HV Monitor | 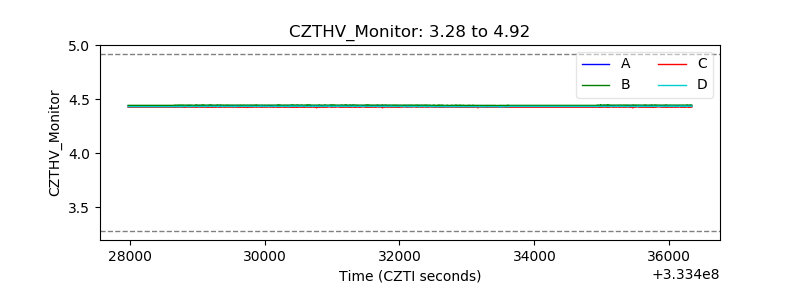 |
| D_VDD | 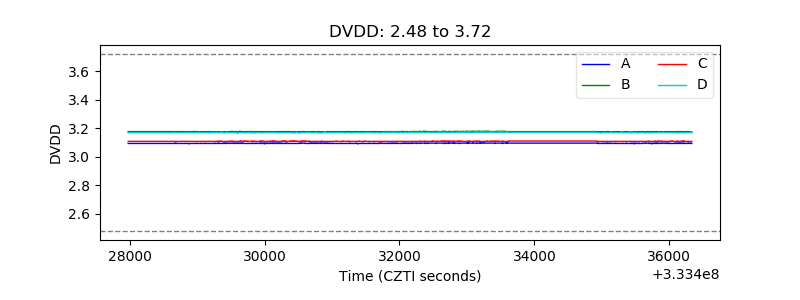 |
| Temperature 1 | 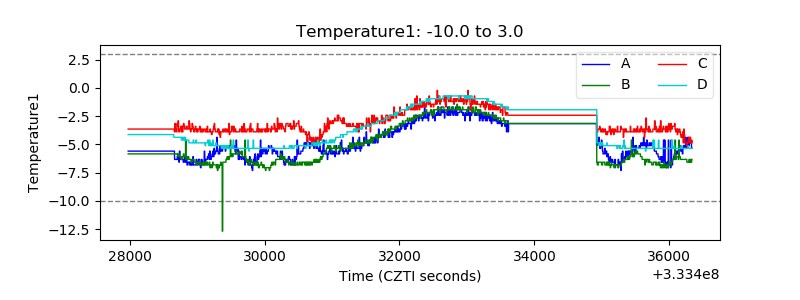 |
| Veto HV Monitor | 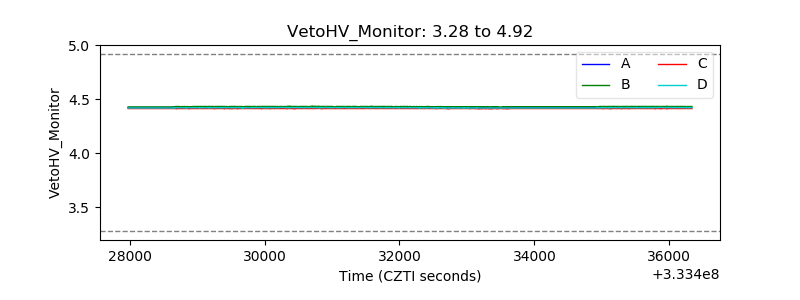 |
| Veto LLD | 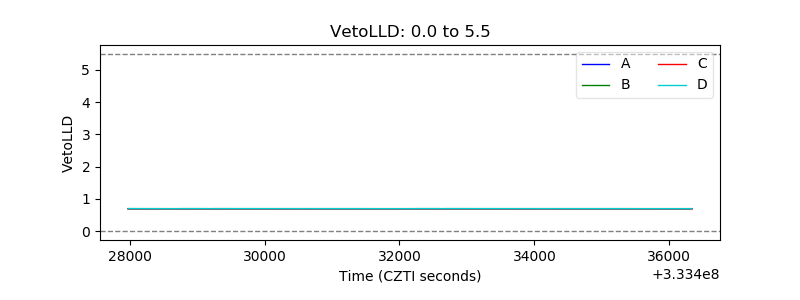 |
| Alpha Counter | 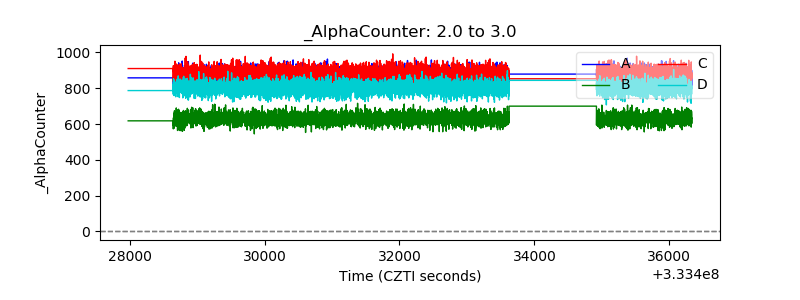 |
| _CPM_Rate | 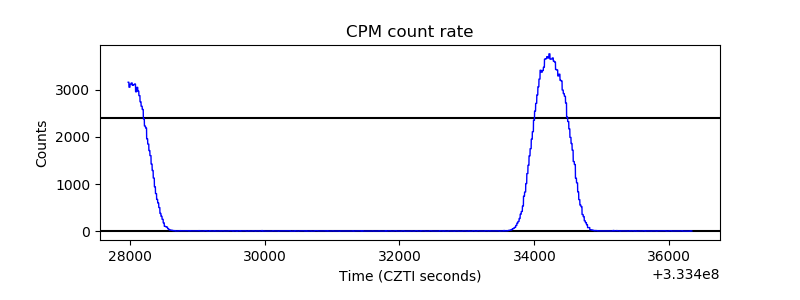 |
| CZT Counter | 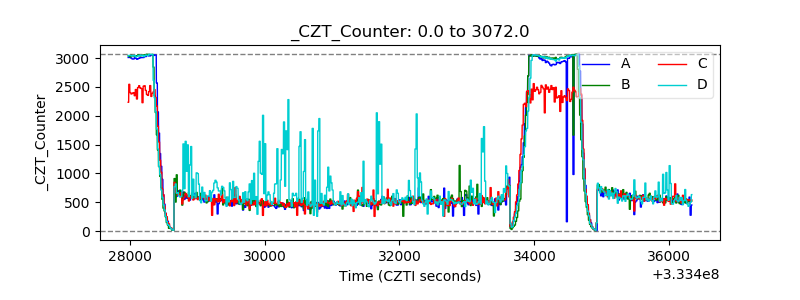 |
| +2.5 Volts monitor |  |
| +5 Volts monitor |  |
| _ROLL_ROT | 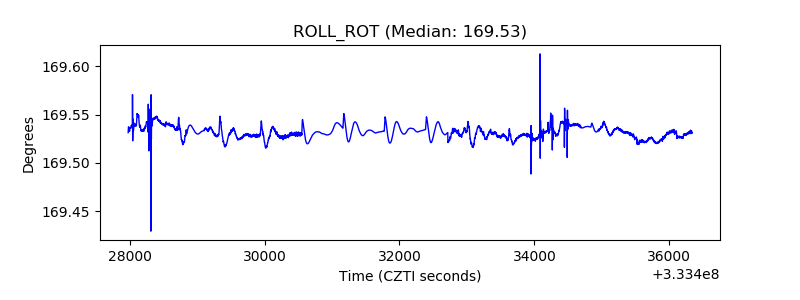 |
| _Roll_DEC | 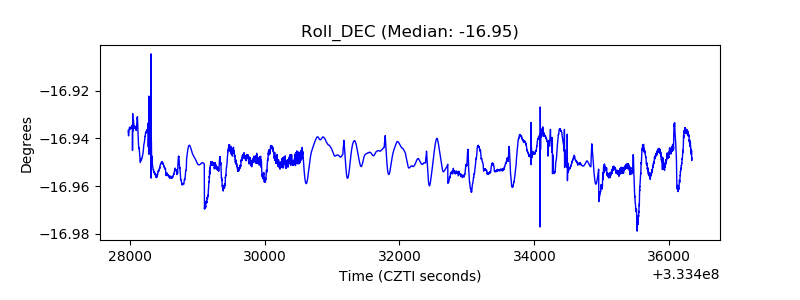 |
| _Roll_RA |  |
| Veto Counter | 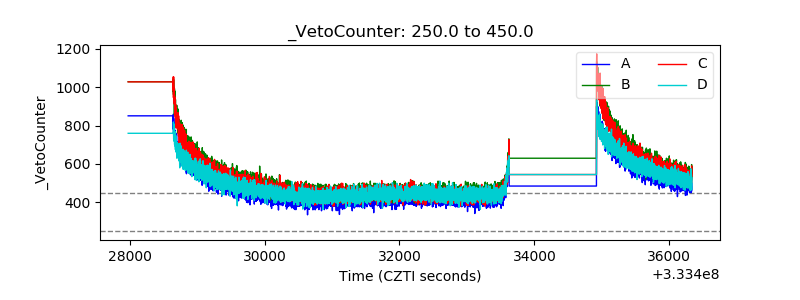 |