| Param | Original file | Final file |
|---|---|---|
| Filename | modeM0/AS1A09_018T01_9000003774_26097cztM0_level2.evt | modeM0/AS1A09_018T01_9000003774_26097cztM0_level2_quad_clean.evt |
| Size (bytes) | 511,274,880 | 67,227,840 |
| Size | 487.6 MB | 64.1 MB |
| Events in quadrant A | 3,554,751 | 407,094 |
| Events in quadrant B | 3,655,237 | 418,487 |
| Events in quadrant C | 3,573,056 | 385,825 |
| Events in quadrant D | 4,267,115 | 377,530 |
| Mode M0 | |||
|---|---|---|---|
| Quadrant | BADHDUFLAG | Total packets | Discarded packets |
| A | 0 | 14240 | 0 |
| B | 0 | 14665 | 0 |
| C | 0 | 14374 | 0 |
| D | 0 | 16842 | 0 |
| Mode M9 | |||
|---|---|---|---|
| Quadrant | BADHDUFLAG | Total packets | Discarded packets |
| A | 0 | 22 | 0 |
| B | 0 | 23 | 0 |
| C | 0 | 23 | 0 |
| D | 0 | 23 | 0 |
| Quadrant | Total seconds | Saturated seconds | Saturation percentage |
|---|---|---|---|
| A | 6401 | 48 | 0.749883% |
| B | 6401 | 60 | 0.937354% |
| C | 6401 | 111 | 1.734104% |
| D | 6401 | 105 | 1.640369% |
Noise dominated data is calculated using 1-second bins in cleaned event files. If a bin has >2000 counts, and if more than 50% of those come from <1% of pixels, then it is considered to be noise-dominated and hence unusable.
| Quadrant | # 1 sec bins | Bins with >0 counts | Bins with >2000 counts | High rate bins dominated by noise | Noise dominated (total time) | Noise dominated (detector-on time) | Marked lightcurve |
|---|---|---|---|---|---|---|---|
| A | 7736 | 6401 | 0 | 0 | 0.00% | 0.00% | 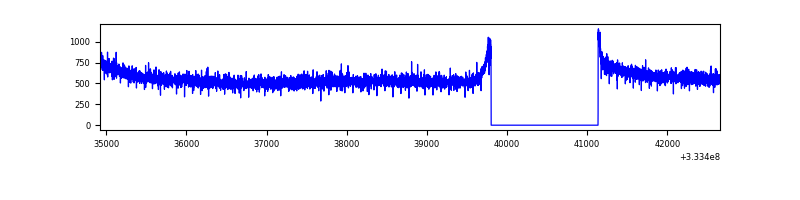 |
| B | 7736 | 6401 | 3 | 3 | 0.04% | 0.05% | 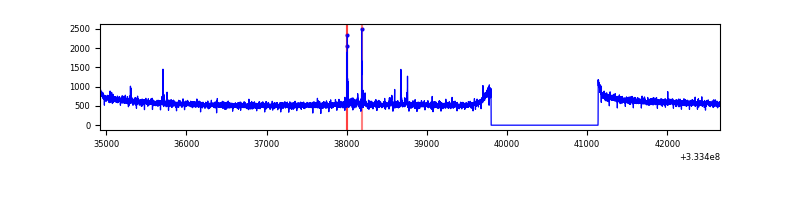 |
| C | 7736 | 6401 | 1 | 1 | 0.01% | 0.02% | 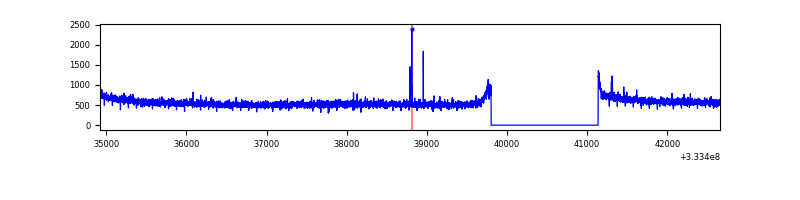 |
| D | 7736 | 6401 | 60 | 60 | 0.78% | 0.94% | 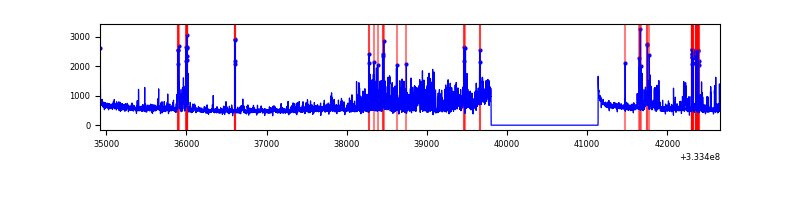 |
Top three noisy pixels from each quadrant. If the there are fewer than three noisy pixels in the level2.evt file, extra rows are filled as -1
| Pixel properties | Quadrant properties | ||||||
|---|---|---|---|---|---|---|---|
| Quadrant | DetID | PixID | Counts | Sigma | Mean | Median | Sigma |
| A | 13 | 254 | 9322 | 45.96 | 923 | 908 | 183.1 |
| A | 0 | 226 | 7957 | 38.5 | 923 | 908 | 183.1 |
| A | 3 | 137 | 7666 | 36.92 | 923 | 908 | 183.1 |
| B | 12 | 111 | 19907 | 111.58 | 921 | 904 | 170.3 |
| B | 11 | 111 | 17717 | 98.72 | 921 | 904 | 170.3 |
| B | 0 | 245 | 17668 | 98.43 | 921 | 904 | 170.3 |
| C | 14 | 238 | 144068 | 707.92 | 874 | 884 | 202.3 |
| C | 2 | 16 | 11930 | 54.61 | 874 | 884 | 202.3 |
| C | 3 | 233 | 11680 | 53.38 | 874 | 884 | 202.3 |
| D | 7 | 80 | 811335 | 3905.29 | 875 | 856 | 207.5 |
| D | 1 | 52 | 51343 | 243.27 | 875 | 856 | 207.5 |
| D | 7 | 223 | 37592 | 177.01 | 875 | 856 | 207.5 |
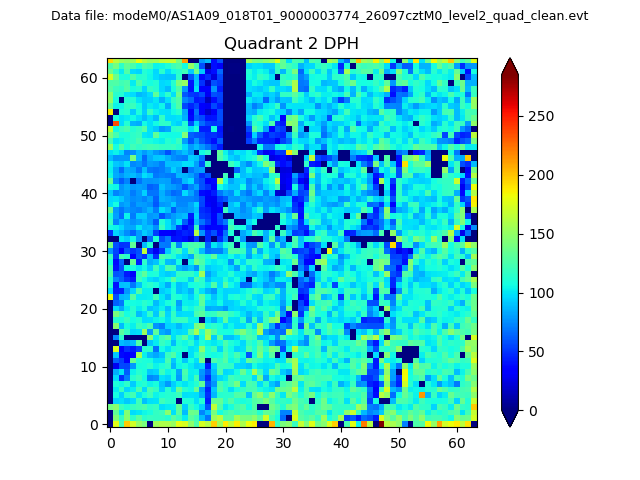
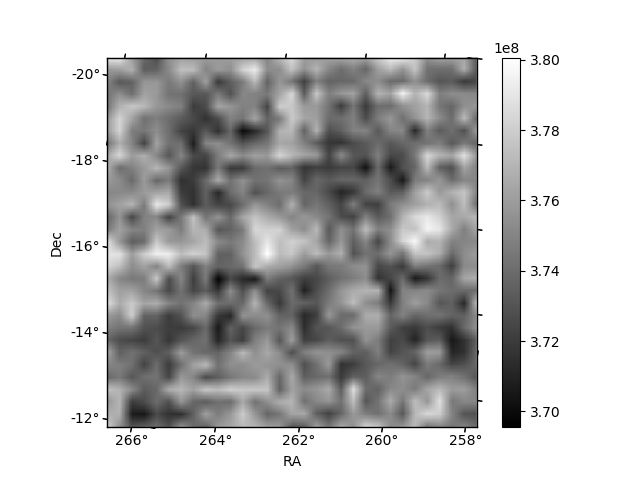
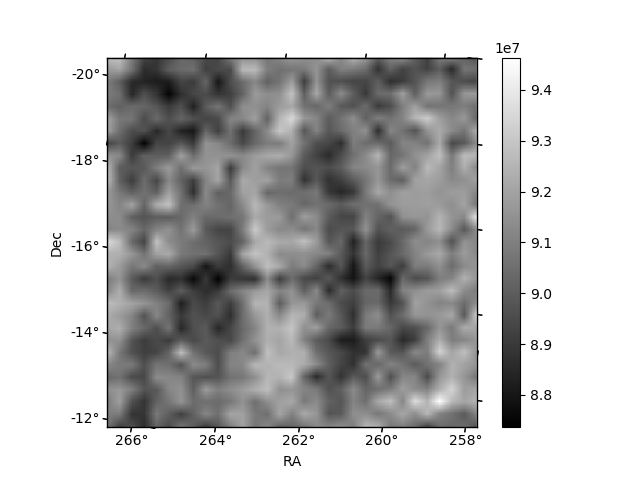
Histogram calculated using DETX and DETY for each event in the final _common_clean file
| Quadrant A | 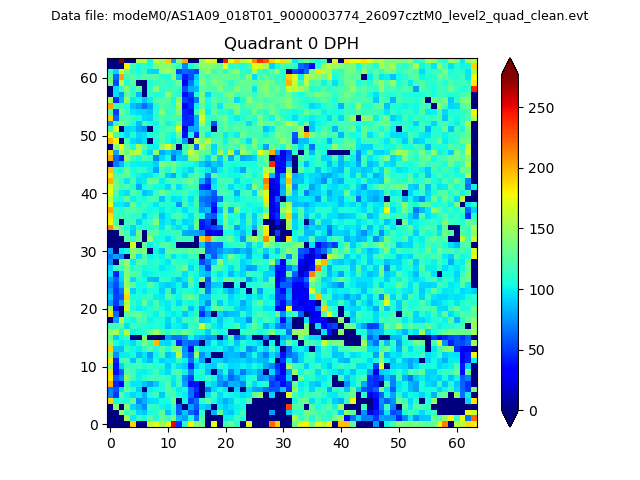 |
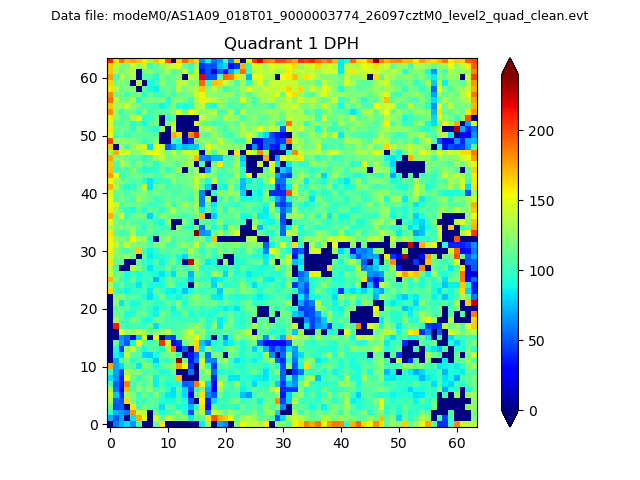 |
Quadrant B |
|---|---|---|---|
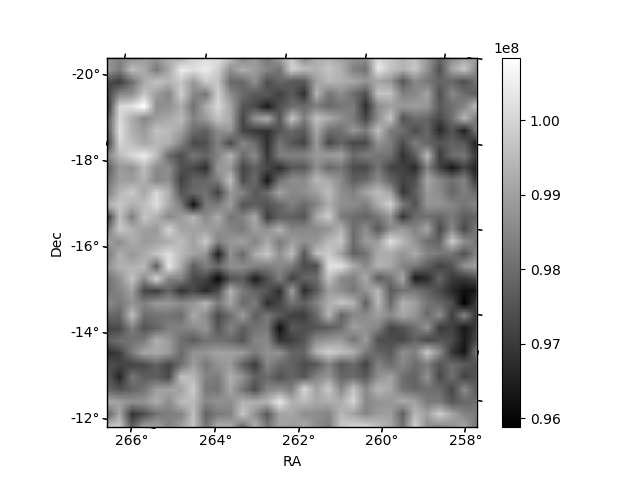
| Quadrant D | 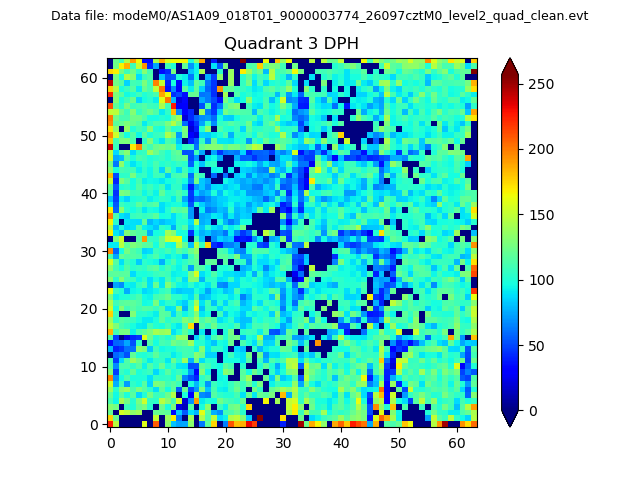 |
 |
Quadrant C |
| Plot type | Count rate plots | Images |
|---|---|---|
| Comparison with Poisson distribution Blue bars denote a histogram of data divided into 1 sec bins. Red curve is a Poisson curve with rate = median count rate of data. |
 |
 |
| Quadrant-wise count rates Data is divided into 100 sec bins |
 |
|
| Module-wise count rates for Quadrant A Data is divided into 100 sec bins |
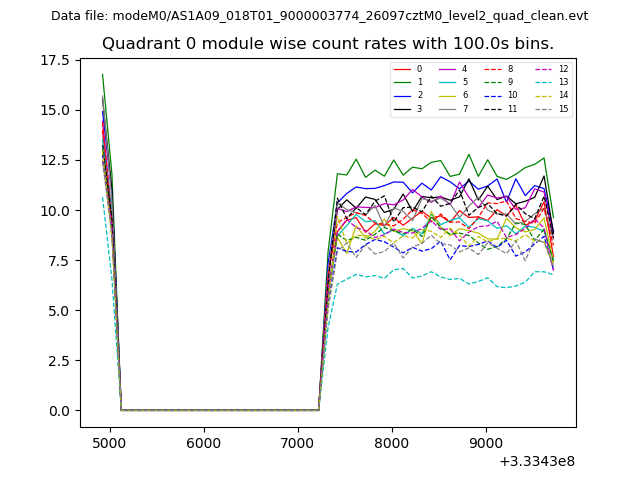 |
 |
| Module-wise count rates for Quadrant B Data is divided into 100 sec bins |
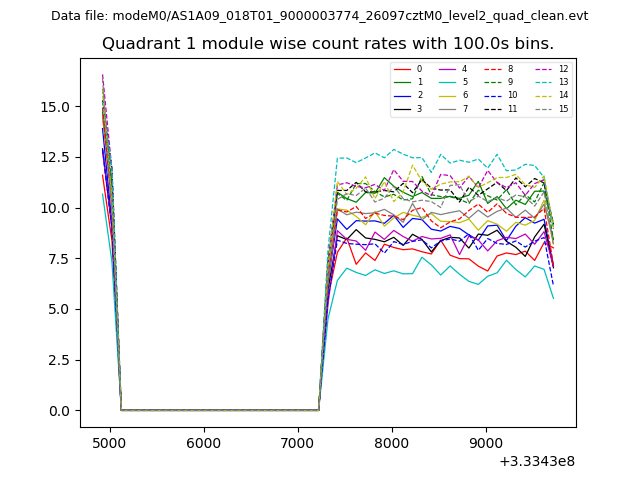 |
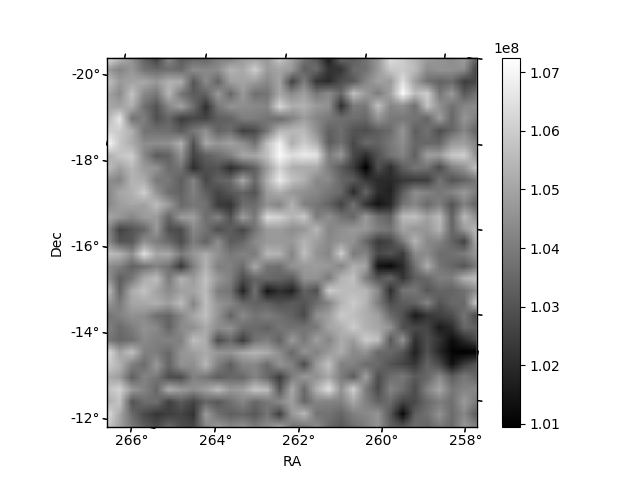 |
| Module-wise count rates for Quadrant C Data is divided into 100 sec bins |
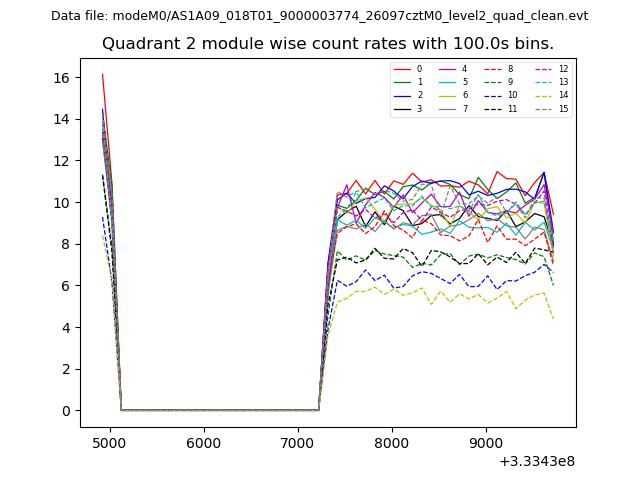 |
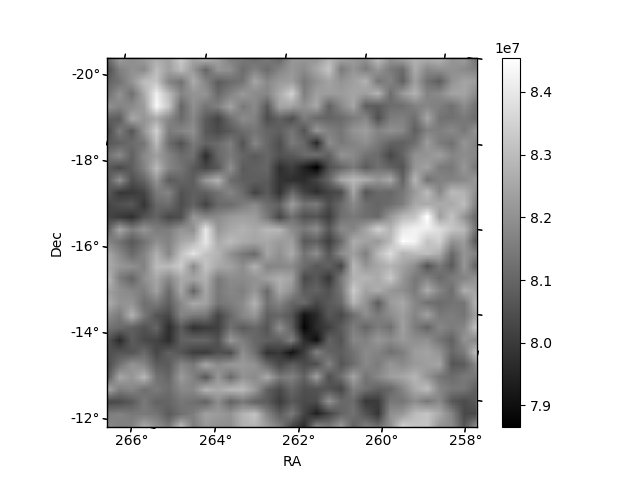 |
| Module-wise count rates for Quadrant D Data is divided into 100 sec bins |
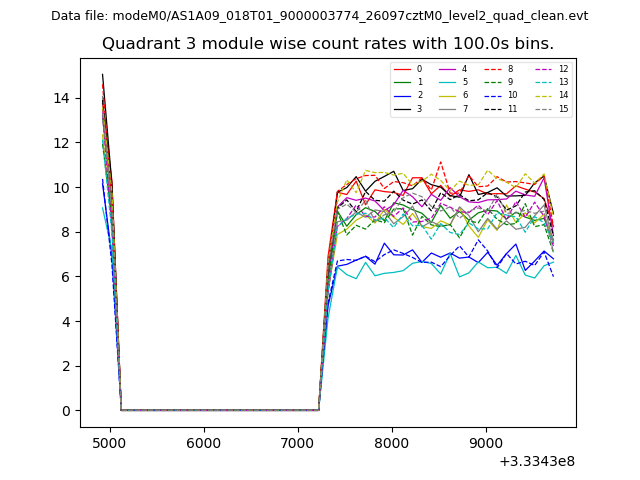 |
 |
| Parameter | Plot |
|---|---|
| CZT HV Monitor | 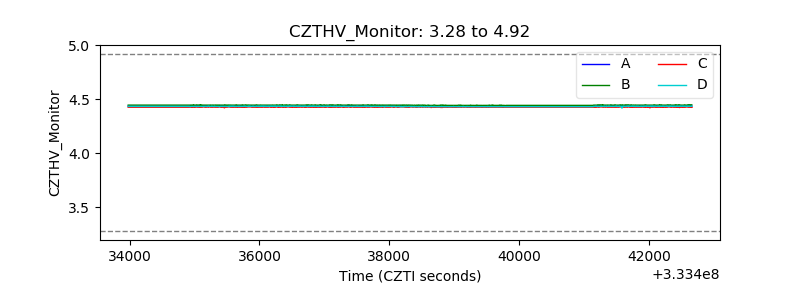 |
| D_VDD | 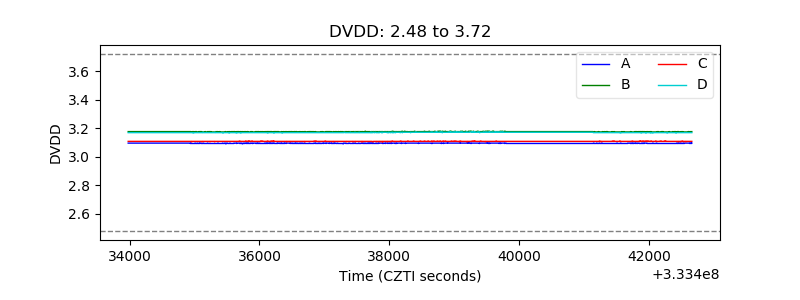 |
| Temperature 1 | 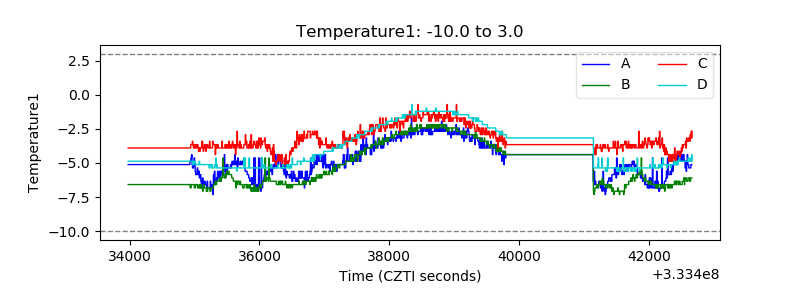 |
| Veto HV Monitor | 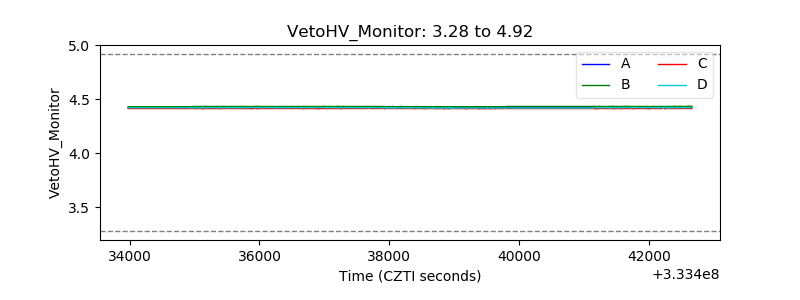 |
| Veto LLD | 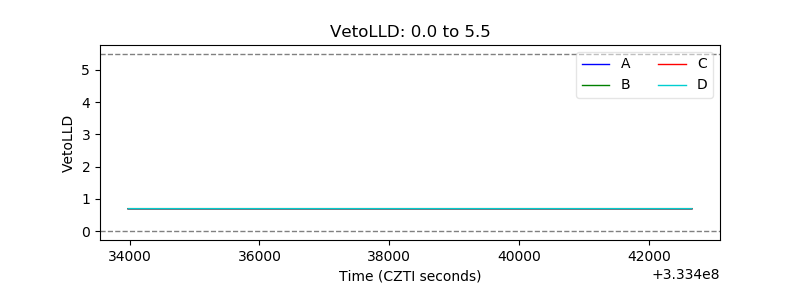 |
| Alpha Counter |  |
| _CPM_Rate |  |
| CZT Counter | 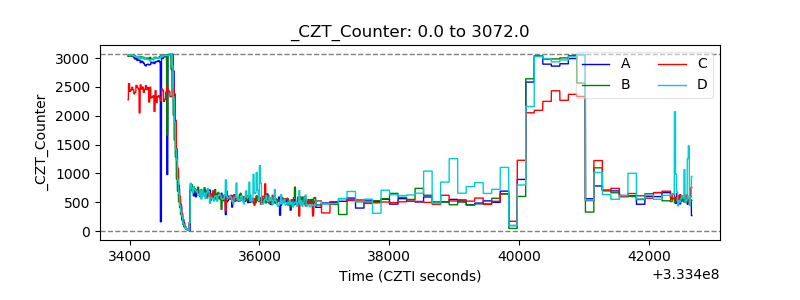 |
| +2.5 Volts monitor |  |
| +5 Volts monitor |  |
| _ROLL_ROT | 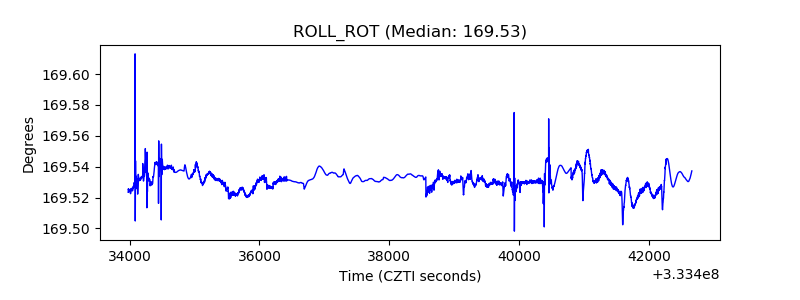 |
| _Roll_DEC | 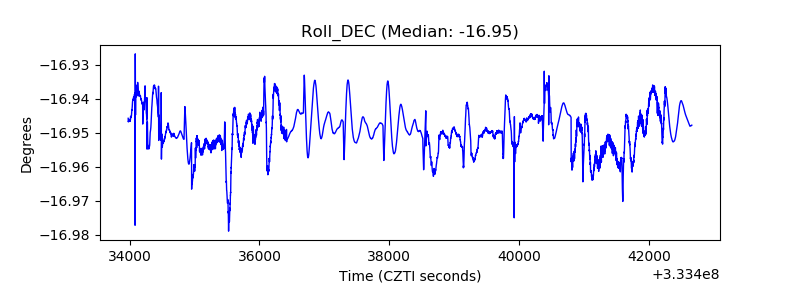 |
| _Roll_RA | 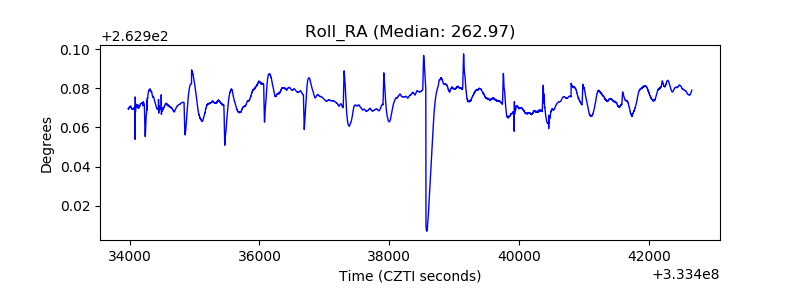 |
| Veto Counter | 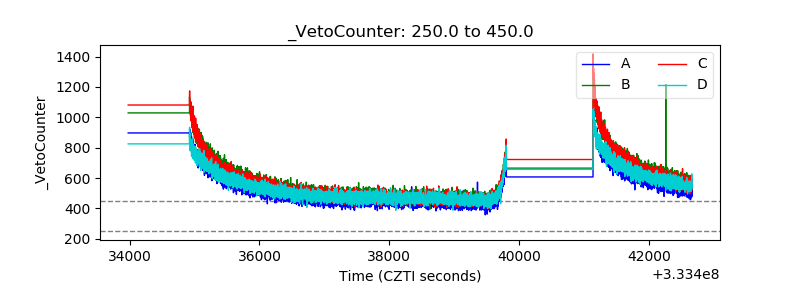 |