| Param | Original file | Final file |
|---|---|---|
| Filename | modeM0/AS1A09_018T01_9000003774_26098cztM0_level2.evt | modeM0/AS1A09_018T01_9000003774_26098cztM0_level2_quad_clean.evt |
| Size (bytes) | 496,906,560 | 70,709,760 |
| Size | 473.9 MB | 67.4 MB |
| Events in quadrant A | 3,528,913 | 438,811 |
| Events in quadrant B | 3,560,856 | 447,090 |
| Events in quadrant C | 3,548,870 | 415,259 |
| Events in quadrant D | 3,990,391 | 407,609 |
| Mode M0 | |||
|---|---|---|---|
| Quadrant | BADHDUFLAG | Total packets | Discarded packets |
| A | 0 | 14141 | 0 |
| B | 0 | 14337 | 0 |
| C | 0 | 14288 | 0 |
| D | 0 | 15685 | 0 |
| Mode M9 | |||
|---|---|---|---|
| Quadrant | BADHDUFLAG | Total packets | Discarded packets |
| A | 0 | 14 | 0 |
| B | 0 | 15 | 0 |
| C | 0 | 15 | 0 |
| D | 0 | 15 | 0 |
| Quadrant | Total seconds | Saturated seconds | Saturation percentage |
|---|---|---|---|
| A | 6183 | 75 | 1.213003% |
| B | 6183 | 96 | 1.552644% |
| C | 6183 | 145 | 2.345140% |
| D | 6183 | 106 | 1.714378% |
Noise dominated data is calculated using 1-second bins in cleaned event files. If a bin has >2000 counts, and if more than 50% of those come from <1% of pixels, then it is considered to be noise-dominated and hence unusable.
| Quadrant | # 1 sec bins | Bins with >0 counts | Bins with >2000 counts | High rate bins dominated by noise | Noise dominated (total time) | Noise dominated (detector-on time) | Marked lightcurve |
|---|---|---|---|---|---|---|---|
| A | 7553 | 6183 | 0 | 0 | 0.00% | 0.00% | 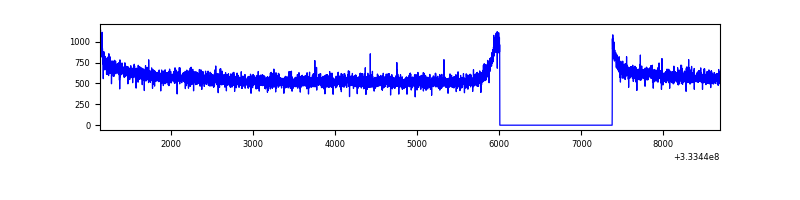 |
| B | 7553 | 6183 | 0 | 0 | 0.00% | 0.00% | 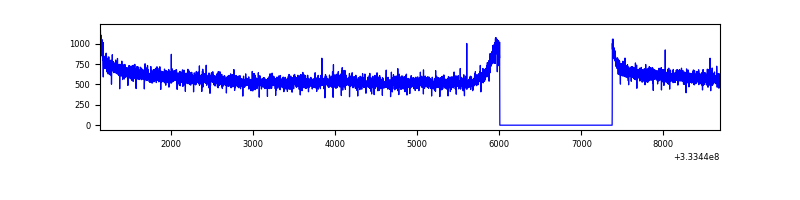 |
| C | 7553 | 6183 | 0 | 0 | 0.00% | 0.00% | 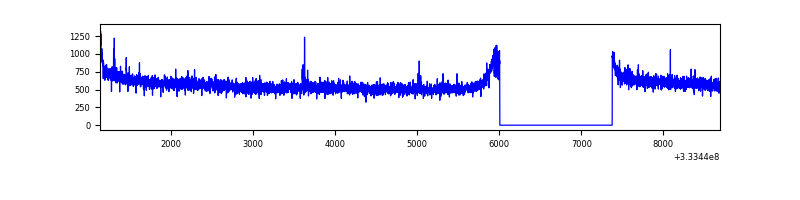 |
| D | 7553 | 6183 | 47 | 47 | 0.62% | 0.76% | 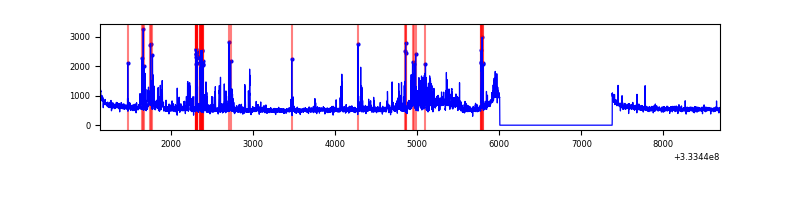 |
Top three noisy pixels from each quadrant. If the there are fewer than three noisy pixels in the level2.evt file, extra rows are filled as -1
| Pixel properties | Quadrant properties | ||||||
|---|---|---|---|---|---|---|---|
| Quadrant | DetID | PixID | Counts | Sigma | Mean | Median | Sigma |
| A | 13 | 254 | 9555 | 47.71 | 915 | 902 | 181.4 |
| A | 0 | 226 | 7809 | 38.09 | 915 | 902 | 181.4 |
| A | 3 | 137 | 7490 | 36.33 | 915 | 902 | 181.4 |
| B | 12 | 111 | 19684 | 111.47 | 910 | 891 | 168.6 |
| B | 11 | 111 | 17851 | 100.6 | 910 | 891 | 168.6 |
| B | 14 | 111 | 16733 | 93.97 | 910 | 891 | 168.6 |
| C | 14 | 238 | 142338 | 712.06 | 866 | 876 | 198.7 |
| C | 3 | 233 | 22530 | 109.0 | 866 | 876 | 198.7 |
| C | 13 | 250 | 10204 | 46.95 | 866 | 876 | 198.7 |
| D | 7 | 80 | 287389 | 1387.95 | 875 | 857 | 206.4 |
| D | 13 | 168 | 234841 | 1133.41 | 875 | 857 | 206.4 |
| D | 12 | 233 | 47483 | 225.85 | 875 | 857 | 206.4 |
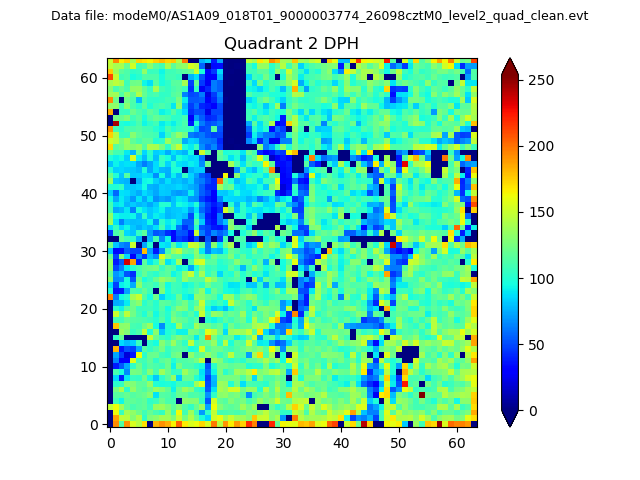
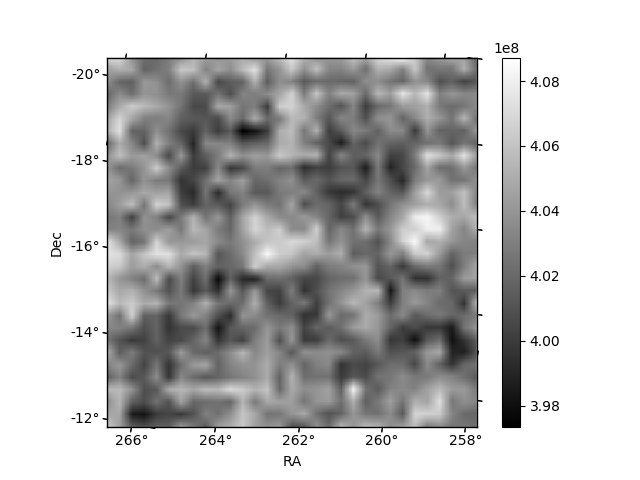
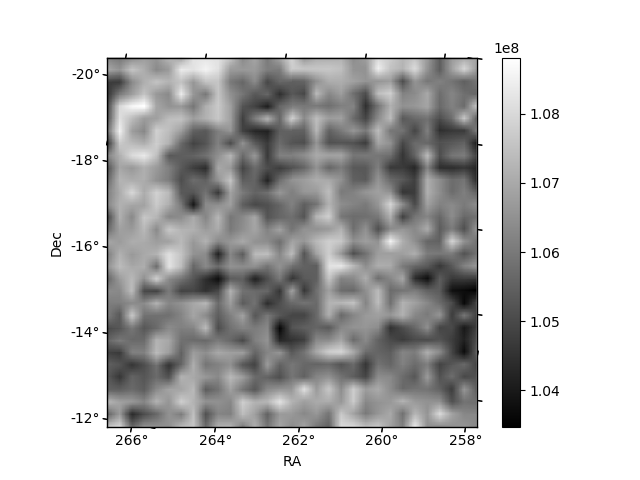
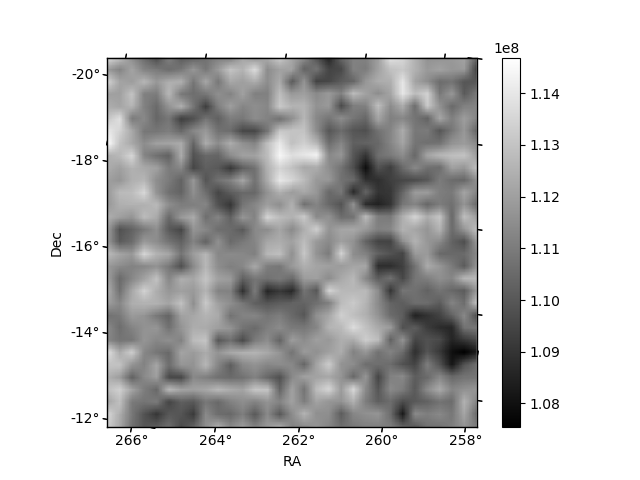
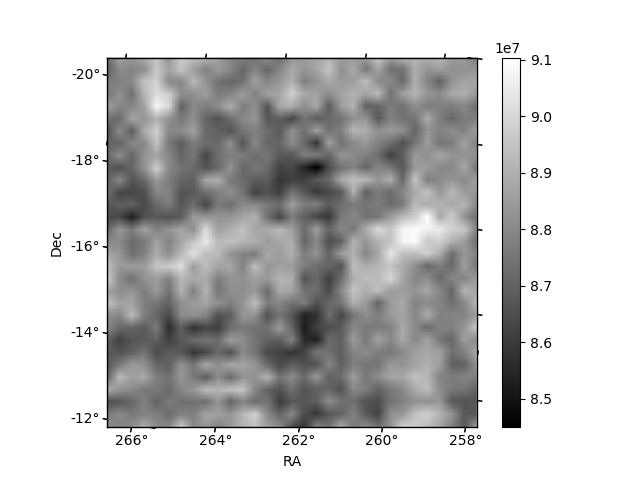
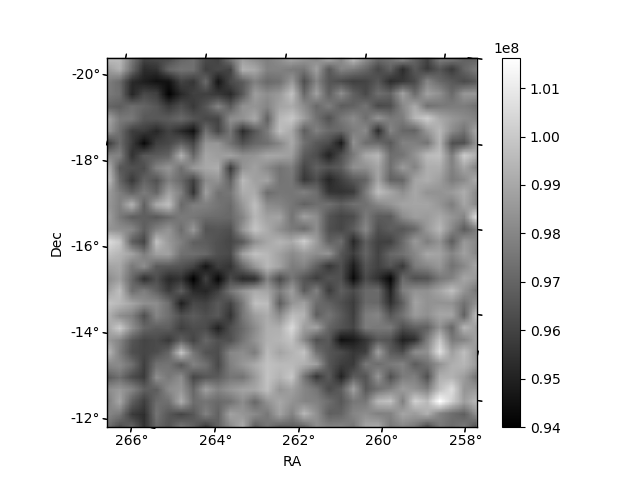
Histogram calculated using DETX and DETY for each event in the final _common_clean file
| Quadrant A | 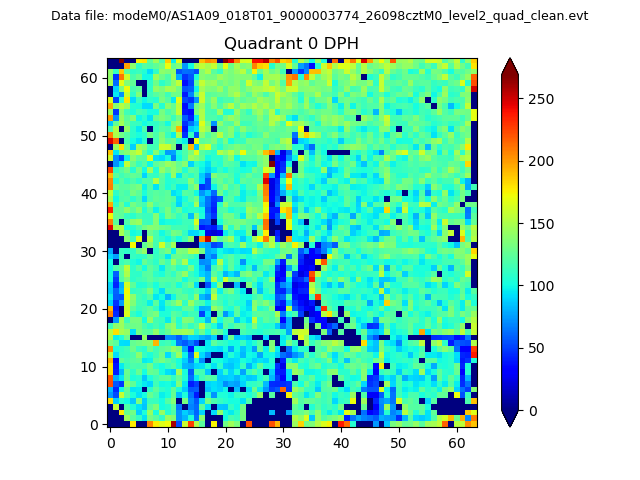 |
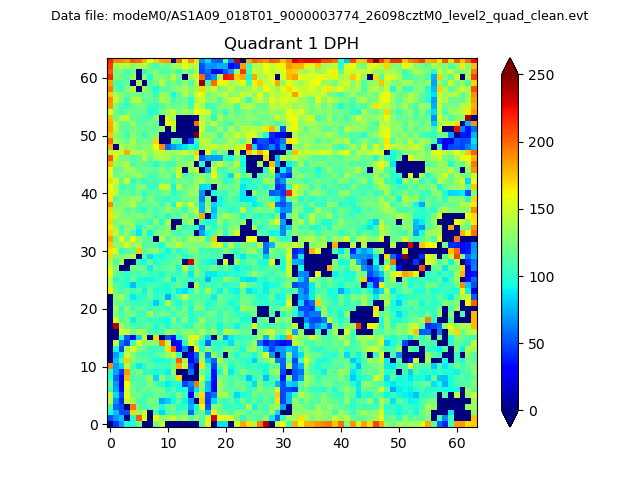 |
Quadrant B |
|---|---|---|---|
| Quadrant D | 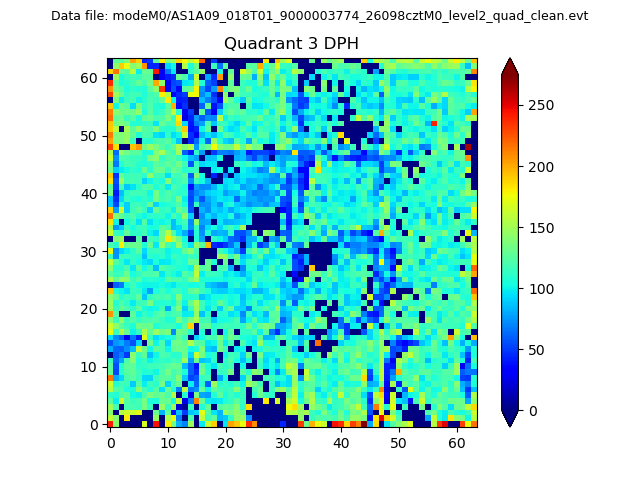 |
 |
Quadrant C |
| Plot type | Count rate plots | Images |
|---|---|---|
| Comparison with Poisson distribution Blue bars denote a histogram of data divided into 1 sec bins. Red curve is a Poisson curve with rate = median count rate of data. |
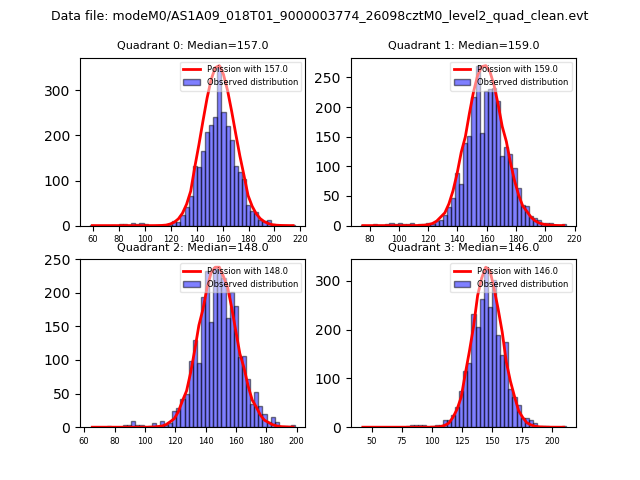 |
 |
| Quadrant-wise count rates Data is divided into 100 sec bins |
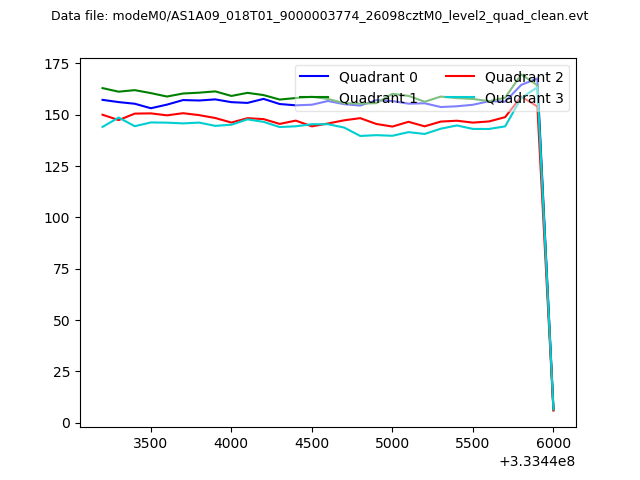 |
|
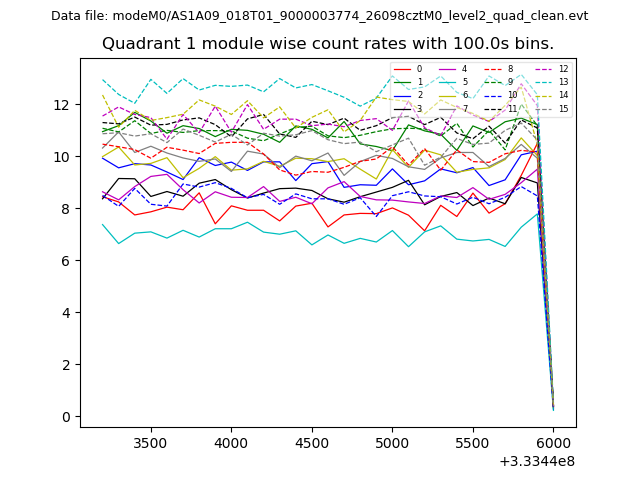
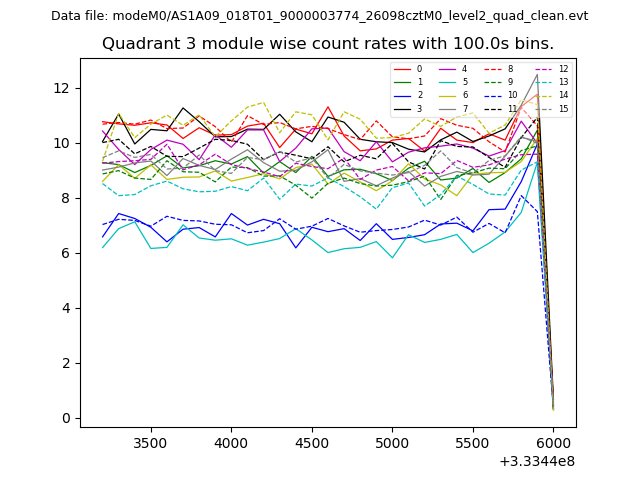
| Module-wise count rates for Quadrant A Data is divided into 100 sec bins |
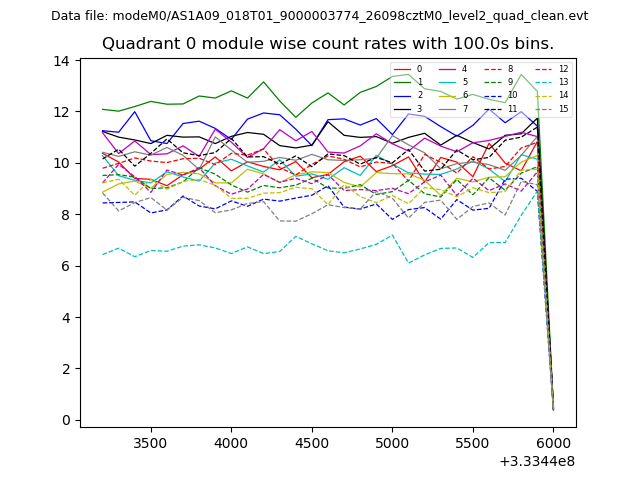 |
 |
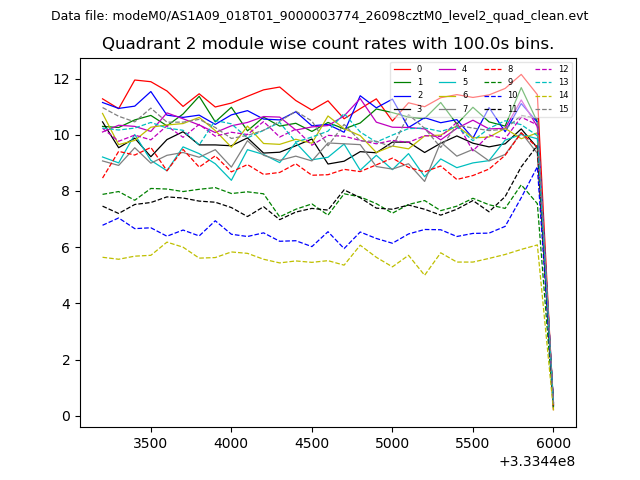
| Module-wise count rates for Quadrant B Data is divided into 100 sec bins |
 |
 |
| Module-wise count rates for Quadrant C Data is divided into 100 sec bins |
 |
 |
| Module-wise count rates for Quadrant D Data is divided into 100 sec bins |
 |
 |
| Parameter | Plot |
|---|---|
| CZT HV Monitor | 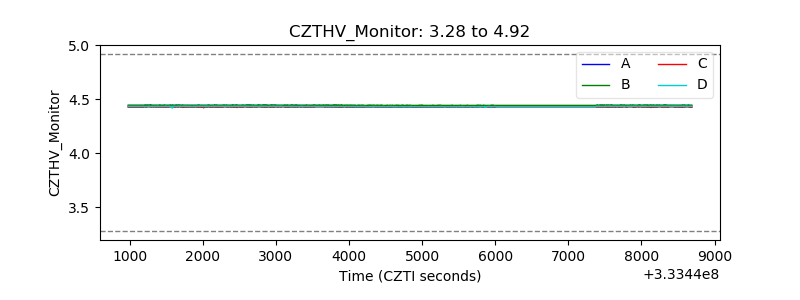 |
| D_VDD | 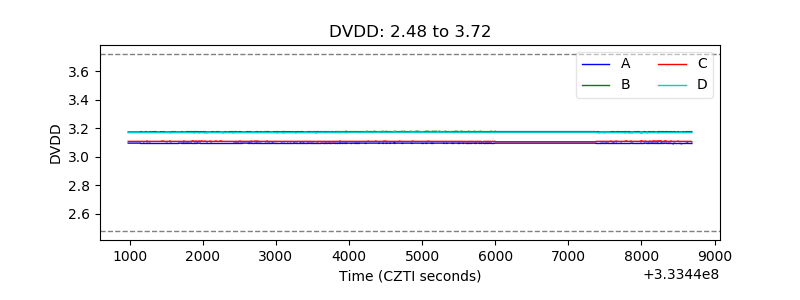 |
| Temperature 1 | 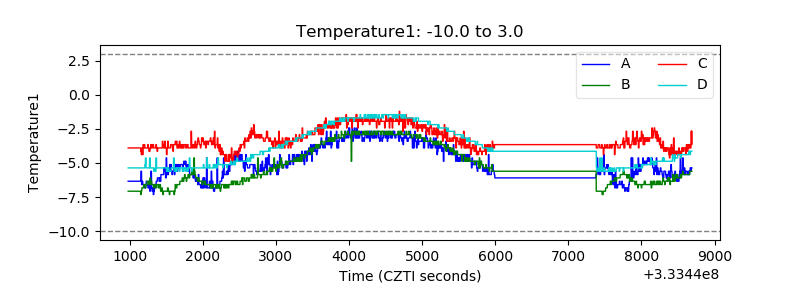 |
| Veto HV Monitor | 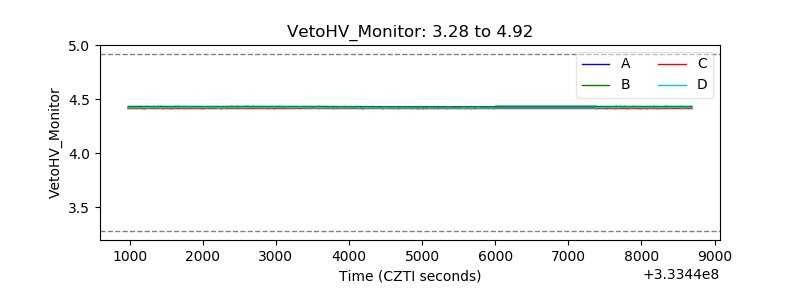 |
| Veto LLD | 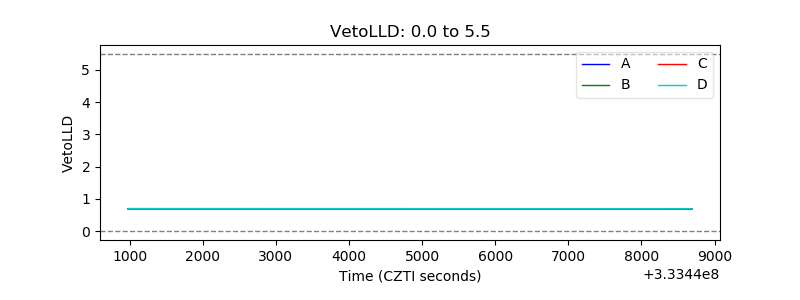 |
| Alpha Counter | 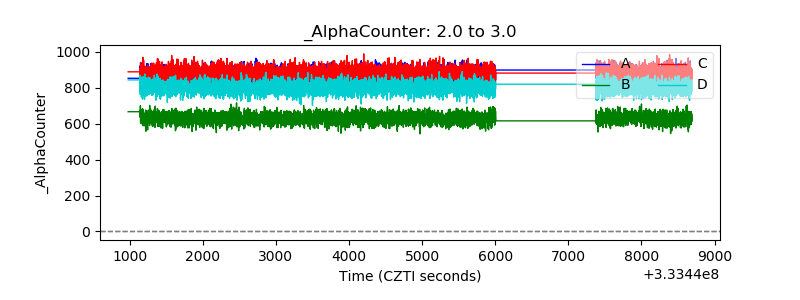 |
| _CPM_Rate | 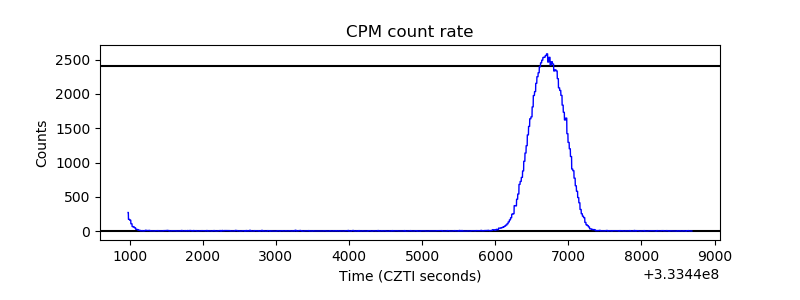 |
| CZT Counter | 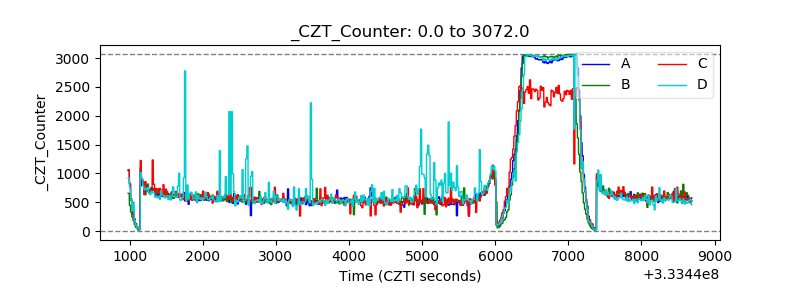 |
| +2.5 Volts monitor |  |
| +5 Volts monitor |  |
| _ROLL_ROT | 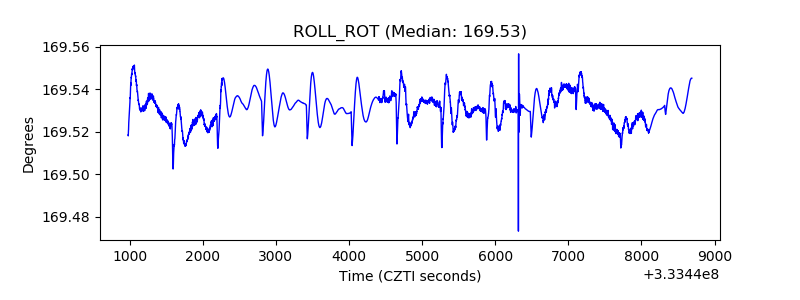 |
| _Roll_DEC | 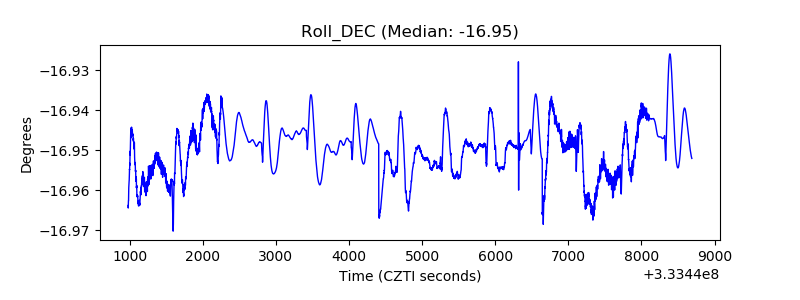 |
| _Roll_RA | 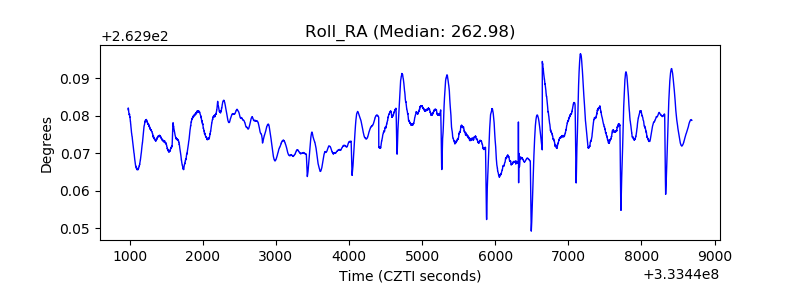 |
| Veto Counter | 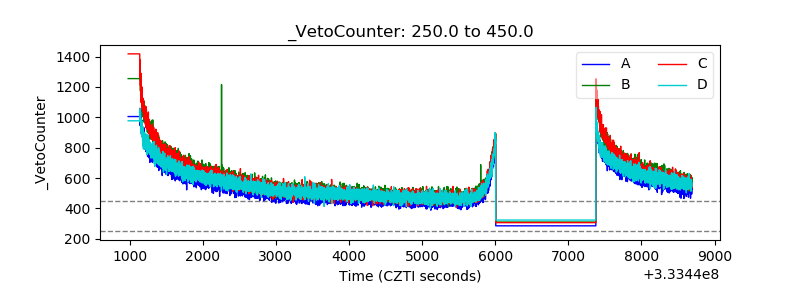 |