| Param | Original file | Final file |
|---|---|---|
| Filename | modeM0/AS1A09_018T01_9000003774_26099cztM0_level2.evt | modeM0/AS1A09_018T01_9000003774_26099cztM0_level2_quad_clean.evt |
| Size (bytes) | 473,394,240 | 79,634,880 |
| Size | 451.5 MB | 75.9 MB |
| Events in quadrant A | 3,467,059 | 507,210 |
| Events in quadrant B | 3,527,250 | 514,787 |
| Events in quadrant C | 3,468,534 | 479,816 |
| Events in quadrant D | 3,452,387 | 476,103 |
| Mode M0 | |||
|---|---|---|---|
| Quadrant | BADHDUFLAG | Total packets | Discarded packets |
| A | 0 | 13879 | 0 |
| B | 0 | 14167 | 0 |
| C | 0 | 13983 | 0 |
| D | 0 | 13776 | 0 |
| Mode M9 | |||
|---|---|---|---|
| Quadrant | BADHDUFLAG | Total packets | Discarded packets |
| A | 0 | 17 | 0 |
| B | 0 | 18 | 0 |
| C | 0 | 18 | 0 |
| D | 0 | 18 | 0 |
| Quadrant | Total seconds | Saturated seconds | Saturation percentage |
|---|---|---|---|
| A | 6205 | 82 | 1.321515% |
| B | 6205 | 114 | 1.837228% |
| C | 6205 | 152 | 2.449637% |
| D | 6205 | 66 | 1.063658% |
Noise dominated data is calculated using 1-second bins in cleaned event files. If a bin has >2000 counts, and if more than 50% of those come from <1% of pixels, then it is considered to be noise-dominated and hence unusable.
| Quadrant | # 1 sec bins | Bins with >0 counts | Bins with >2000 counts | High rate bins dominated by noise | Noise dominated (total time) | Noise dominated (detector-on time) | Marked lightcurve |
|---|---|---|---|---|---|---|---|
| A | 7545 | 6205 | 0 | 0 | 0.00% | 0.00% | 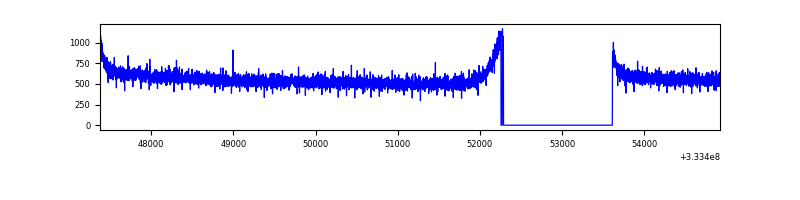 |
| B | 7545 | 6205 | 2 | 2 | 0.03% | 0.03% | 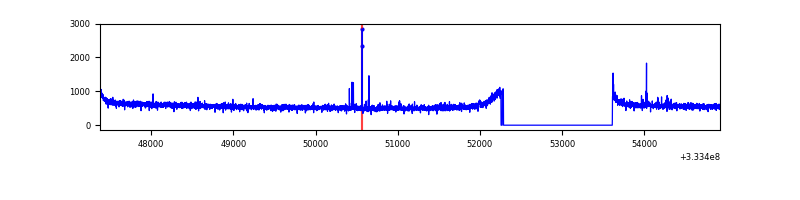 |
| C | 7545 | 6206 | 0 | 0 | 0.00% | 0.00% | 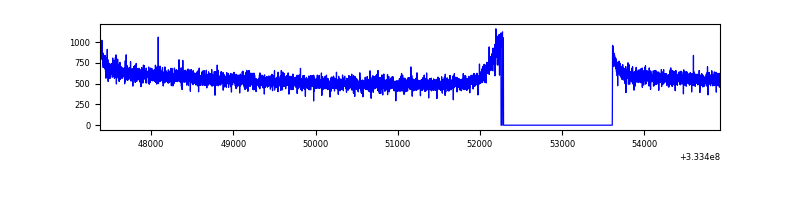 |
| D | 7545 | 6205 | 14 | 14 | 0.19% | 0.23% | 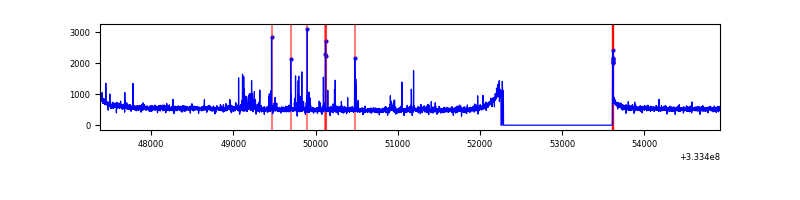 |
Top three noisy pixels from each quadrant. If the there are fewer than three noisy pixels in the level2.evt file, extra rows are filled as -1
| Pixel properties | Quadrant properties | ||||||
|---|---|---|---|---|---|---|---|
| Quadrant | DetID | PixID | Counts | Sigma | Mean | Median | Sigma |
| A | 13 | 254 | 9423 | 47.87 | 900 | 884 | 178.4 |
| A | 3 | 137 | 7750 | 38.49 | 900 | 884 | 178.4 |
| A | 0 | 226 | 7700 | 38.21 | 900 | 884 | 178.4 |
| B | 4 | 80 | 21572 | 125.79 | 888 | 871 | 164.6 |
| B | 12 | 111 | 19636 | 114.02 | 888 | 871 | 164.6 |
| B | 11 | 111 | 17739 | 102.49 | 888 | 871 | 164.6 |
| C | 14 | 238 | 138991 | 704.59 | 849 | 858 | 196.0 |
| C | 13 | 250 | 12374 | 58.74 | 849 | 858 | 196.0 |
| C | 13 | 61 | 5868 | 25.56 | 849 | 858 | 196.0 |
| D | 12 | 233 | 41658 | 202.39 | 860 | 842 | 201.7 |
| D | 1 | 52 | 39612 | 192.25 | 860 | 842 | 201.7 |
| D | 2 | 234 | 24910 | 119.34 | 860 | 842 | 201.7 |
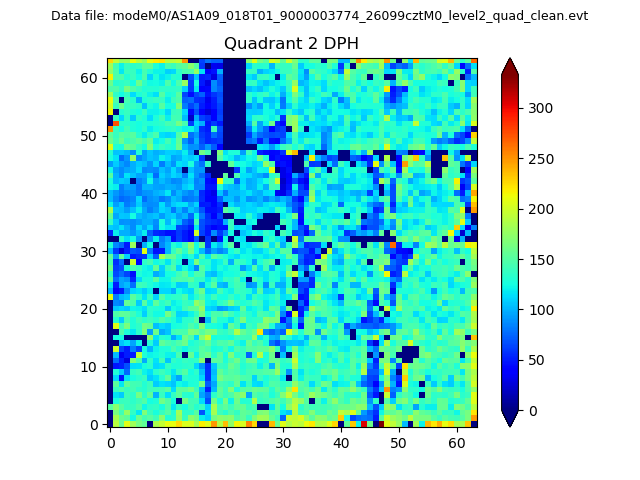
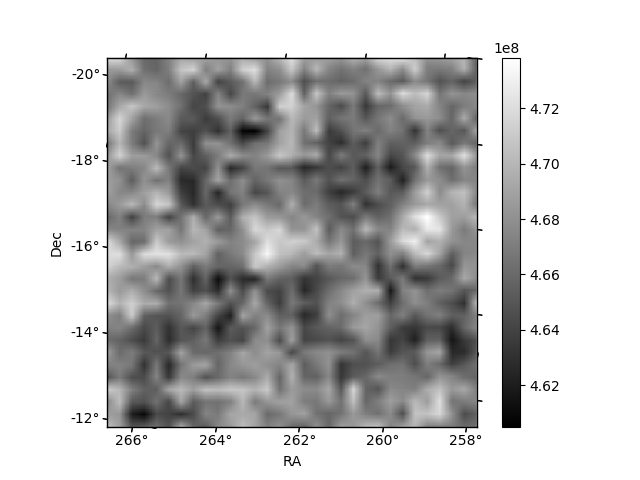
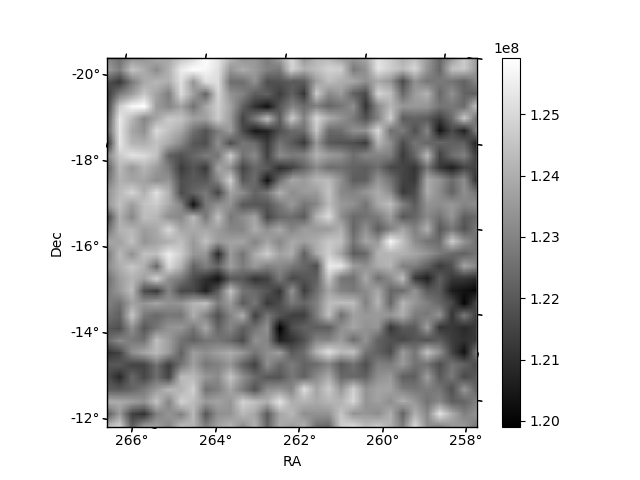
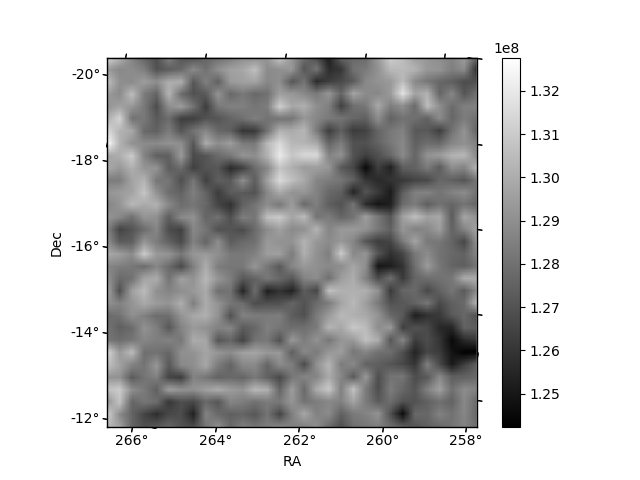
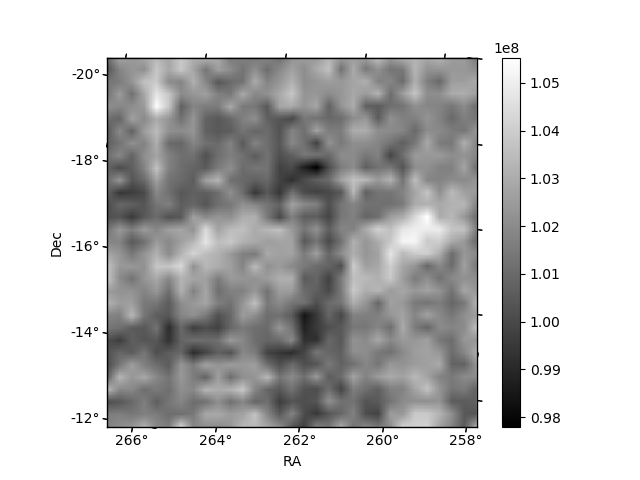
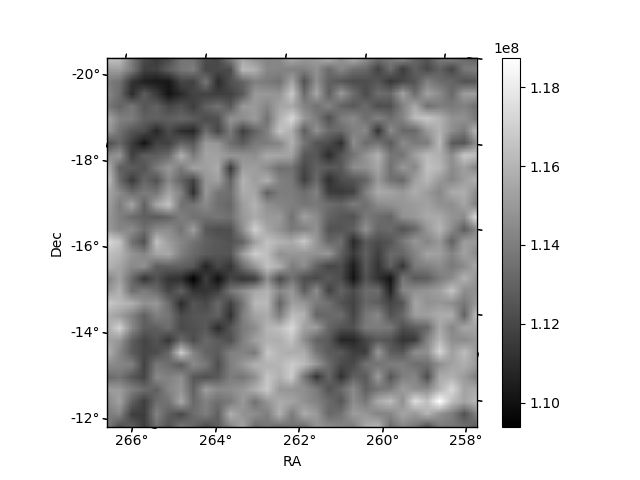
Histogram calculated using DETX and DETY for each event in the final _common_clean file
| Quadrant A | 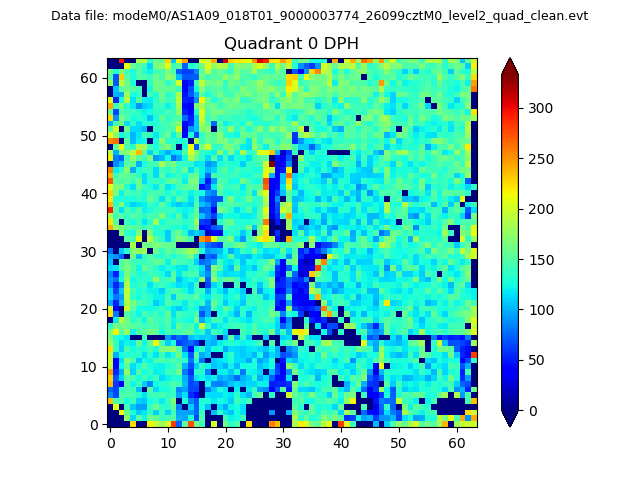 |
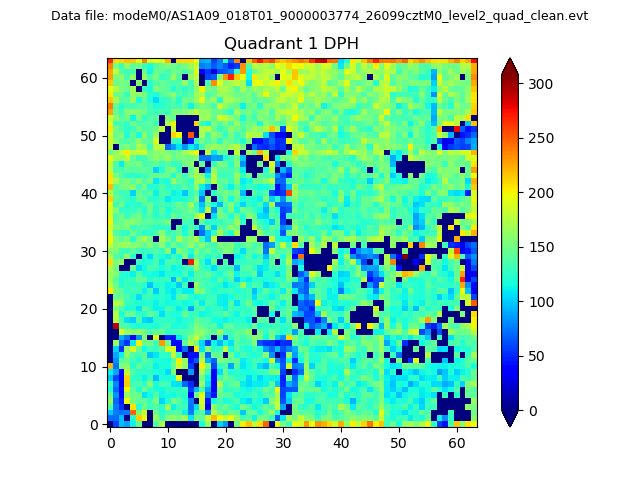 |
Quadrant B |
|---|---|---|---|
| Quadrant D | 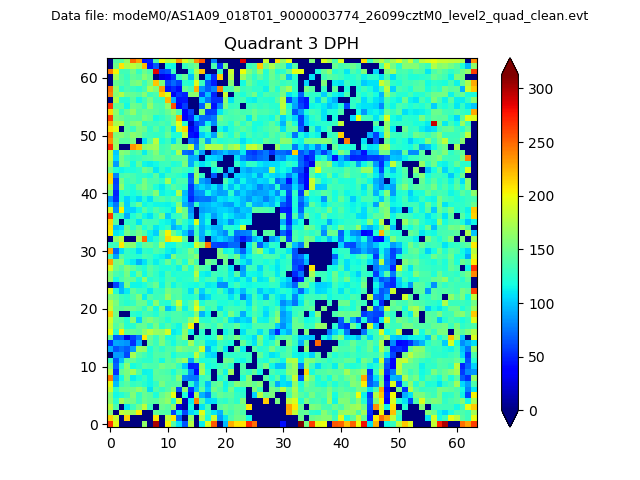 |
 |
Quadrant C |
| Plot type | Count rate plots | Images |
|---|---|---|
| Comparison with Poisson distribution Blue bars denote a histogram of data divided into 1 sec bins. Red curve is a Poisson curve with rate = median count rate of data. |
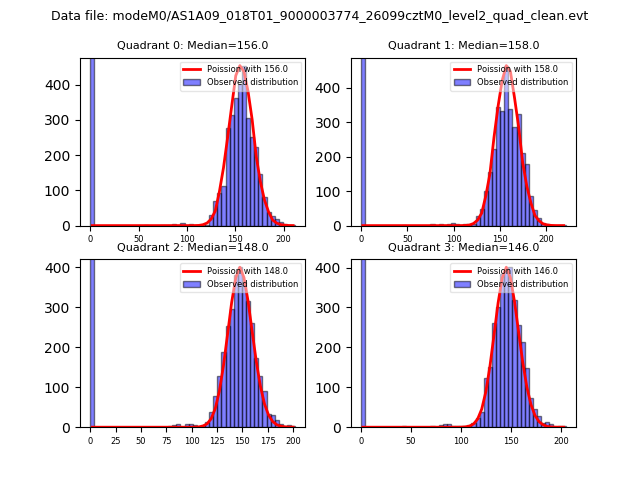 |
 |
| Quadrant-wise count rates Data is divided into 100 sec bins |
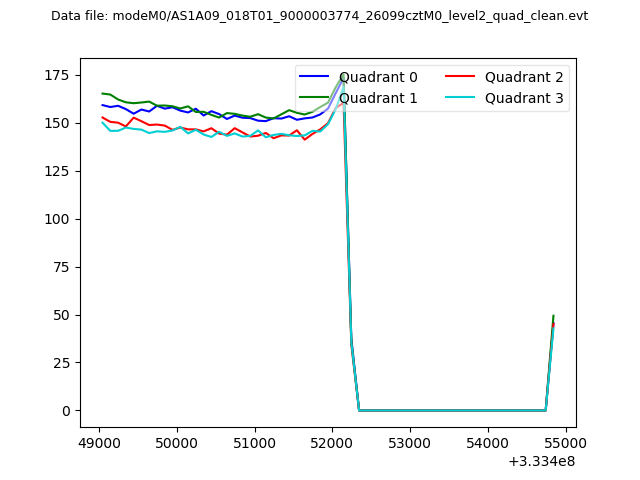 |
|
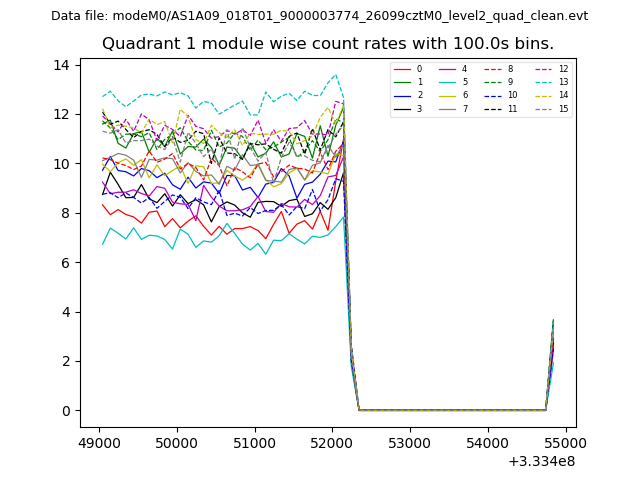
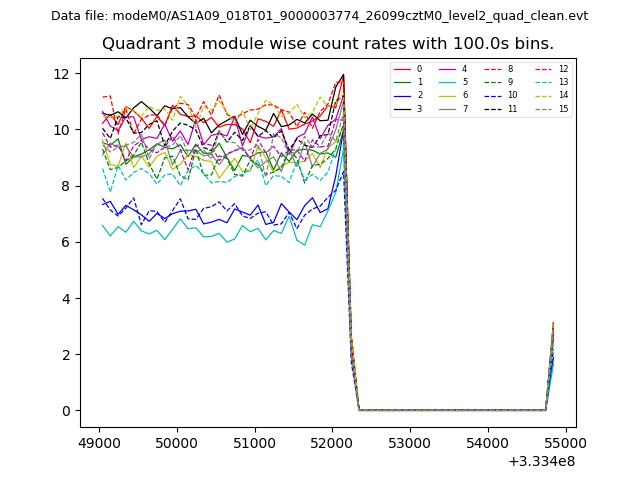
| Module-wise count rates for Quadrant A Data is divided into 100 sec bins |
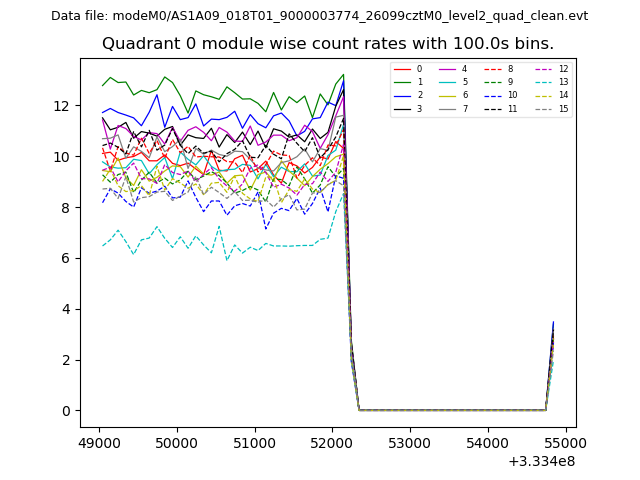 |
 |
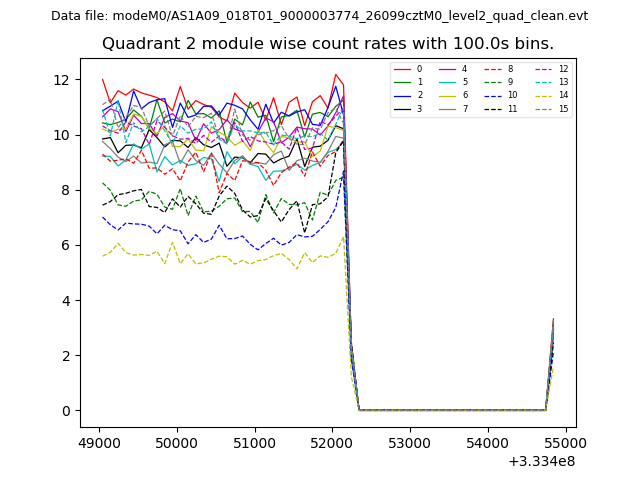
| Module-wise count rates for Quadrant B Data is divided into 100 sec bins |
 |
 |
| Module-wise count rates for Quadrant C Data is divided into 100 sec bins |
 |
 |
| Module-wise count rates for Quadrant D Data is divided into 100 sec bins |
 |
 |
| Parameter | Plot |
|---|---|
| CZT HV Monitor | 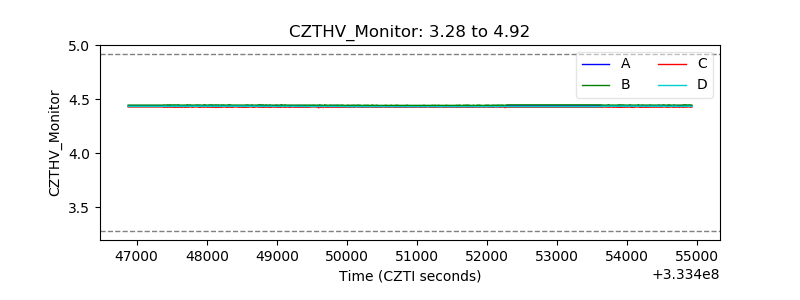 |
| D_VDD | 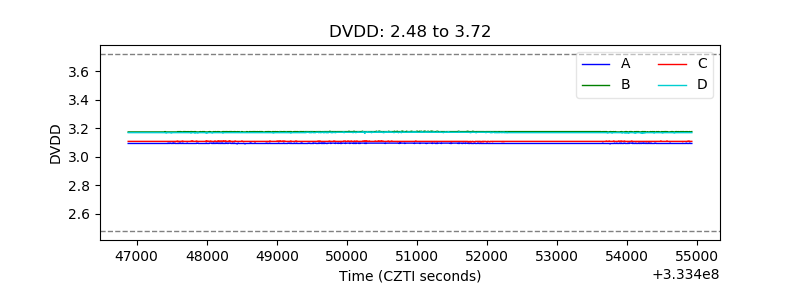 |
| Temperature 1 | 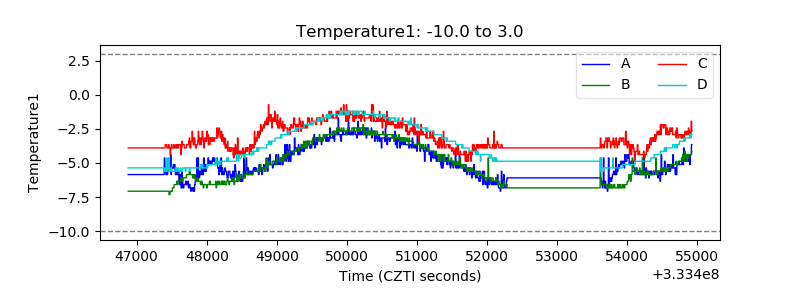 |
| Veto HV Monitor | 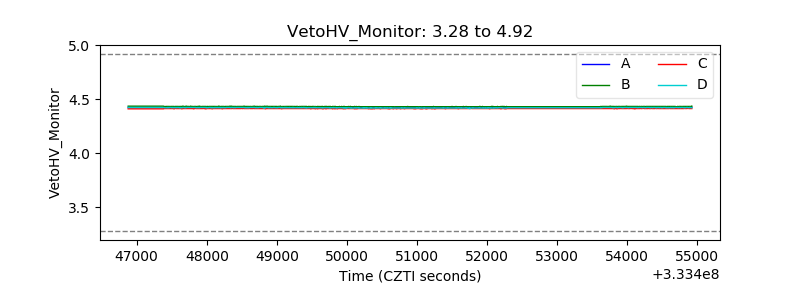 |
| Veto LLD | 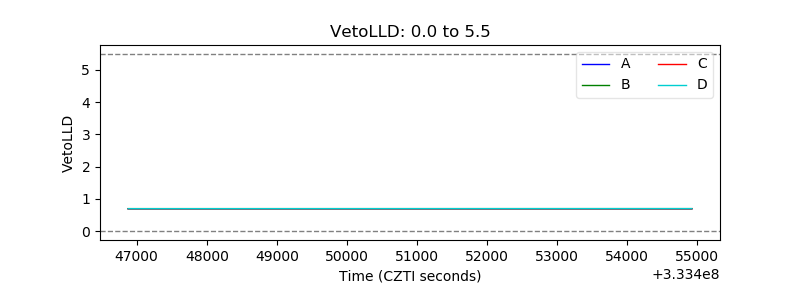 |
| Alpha Counter | 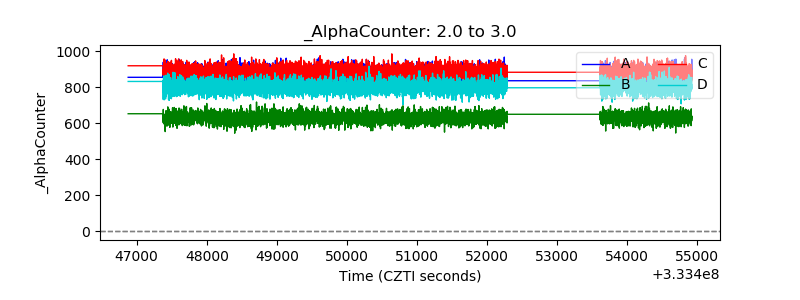 |
| _CPM_Rate | 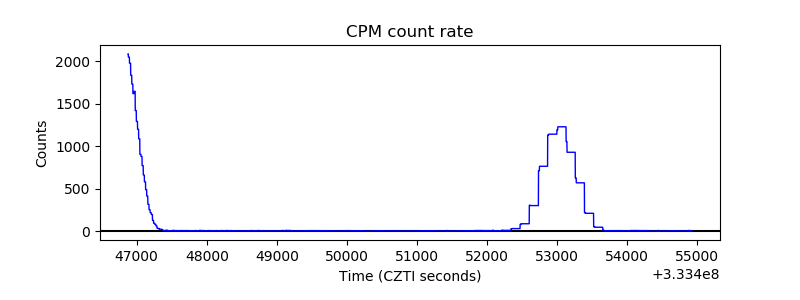 |
| CZT Counter | 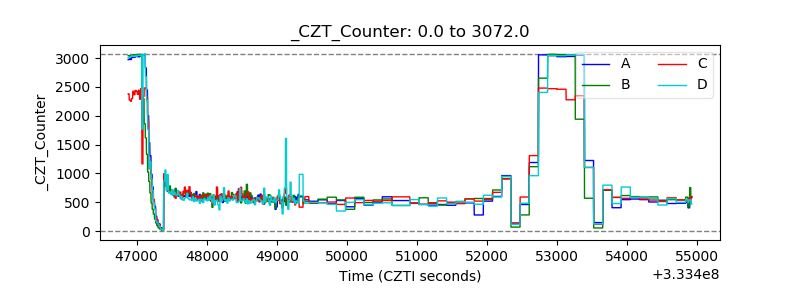 |
| +2.5 Volts monitor |  |
| +5 Volts monitor |  |
| _ROLL_ROT | 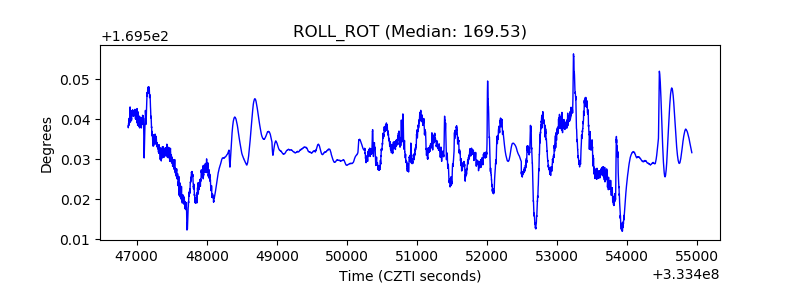 |
| _Roll_DEC | 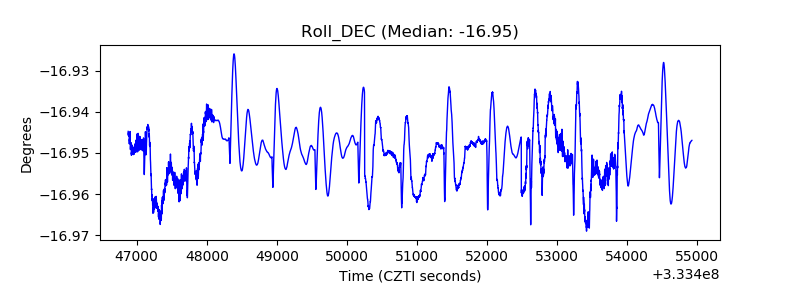 |
| _Roll_RA | 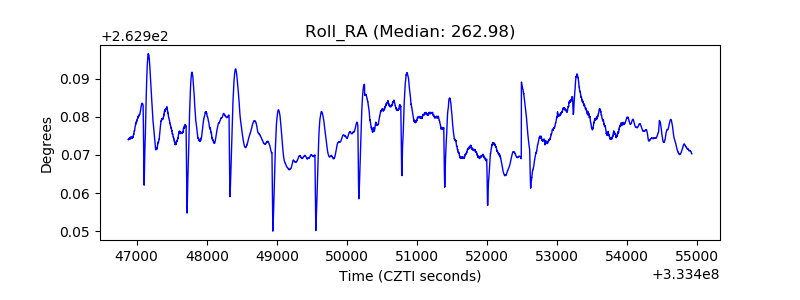 |
| Veto Counter | 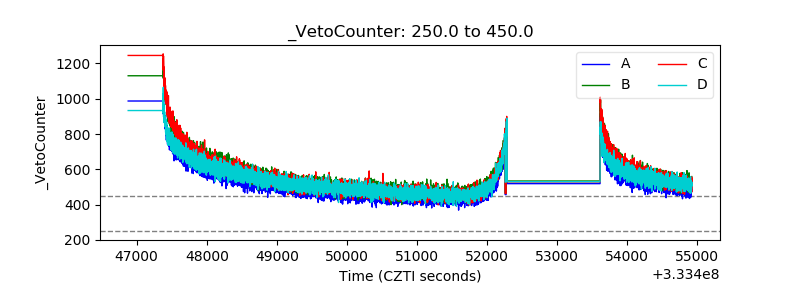 |