| Param | Original file | Final file |
|---|---|---|
| Filename | modeM0/AS1A09_018T01_9000003774_26100cztM0_level2.evt | modeM0/AS1A09_018T01_9000003774_26100cztM0_level2_quad_clean.evt |
| Size (bytes) | 489,395,520 | 93,107,520 |
| Size | 466.7 MB | 88.8 MB |
| Events in quadrant A | 3,507,958 | 604,246 |
| Events in quadrant B | 3,630,506 | 612,644 |
| Events in quadrant C | 3,505,820 | 574,483 |
| Events in quadrant D | 3,730,391 | 569,747 |
| Mode M0 | |||
|---|---|---|---|
| Quadrant | BADHDUFLAG | Total packets | Discarded packets |
| A | 0 | 14090 | 0 |
| B | 0 | 14485 | 0 |
| C | 0 | 14189 | 0 |
| D | 0 | 14858 | 0 |
| Mode M9 | |||
|---|---|---|---|
| Quadrant | BADHDUFLAG | Total packets | Discarded packets |
| A | 0 | 16 | 0 |
| B | 0 | 17 | 0 |
| C | 0 | 17 | 0 |
| D | 0 | 17 | 0 |
| Quadrant | Total seconds | Saturated seconds | Saturation percentage |
|---|---|---|---|
| A | 6581 | 145 | 2.203313% |
| B | 6581 | 167 | 2.537608% |
| C | 6581 | 199 | 3.023857% |
| D | 6581 | 166 | 2.522413% |
Noise dominated data is calculated using 1-second bins in cleaned event files. If a bin has >2000 counts, and if more than 50% of those come from <1% of pixels, then it is considered to be noise-dominated and hence unusable.
| Quadrant | # 1 sec bins | Bins with >0 counts | Bins with >2000 counts | High rate bins dominated by noise | Noise dominated (total time) | Noise dominated (detector-on time) | Marked lightcurve |
|---|---|---|---|---|---|---|---|
| A | 7641 | 6581 | 0 | 0 | 0.00% | 0.00% | 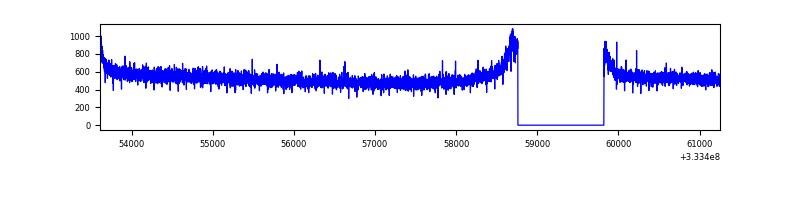 |
| B | 7641 | 6581 | 4 | 4 | 0.05% | 0.06% | 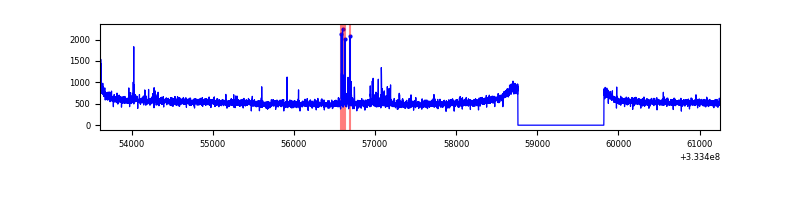 |
| C | 7641 | 6581 | 0 | 0 | 0.00% | 0.00% | 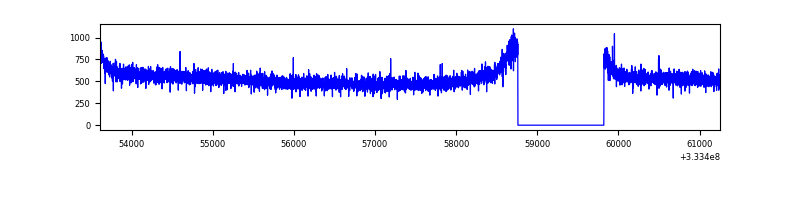 |
| D | 7641 | 6581 | 64 | 64 | 0.84% | 0.97% | 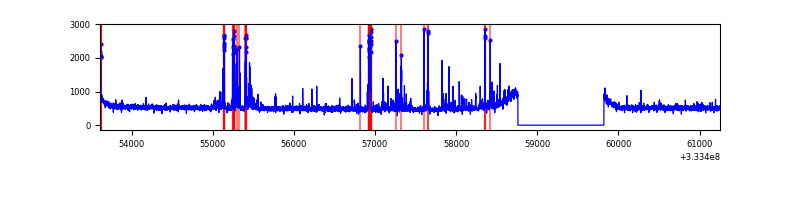 |
Top three noisy pixels from each quadrant. If the there are fewer than three noisy pixels in the level2.evt file, extra rows are filled as -1
| Pixel properties | Quadrant properties | ||||||
|---|---|---|---|---|---|---|---|
| Quadrant | DetID | PixID | Counts | Sigma | Mean | Median | Sigma |
| A | 13 | 254 | 9984 | 49.37 | 910 | 894 | 184.1 |
| A | 3 | 137 | 8084 | 39.05 | 910 | 894 | 184.1 |
| A | 0 | 226 | 7784 | 37.43 | 910 | 894 | 184.1 |
| B | 4 | 80 | 75878 | 440.37 | 897 | 877 | 170.3 |
| B | 3 | 64 | 32863 | 187.8 | 897 | 877 | 170.3 |
| B | 12 | 111 | 20765 | 116.77 | 897 | 877 | 170.3 |
| C | 14 | 238 | 139073 | 691.09 | 860 | 865 | 200.0 |
| C | 6 | 80 | 7783 | 34.59 | 860 | 865 | 200.0 |
| C | 13 | 61 | 6013 | 25.74 | 860 | 865 | 200.0 |
| D | 12 | 233 | 252414 | 1215.44 | 874 | 857 | 207.0 |
| D | 7 | 80 | 42572 | 201.55 | 874 | 857 | 207.0 |
| D | 7 | 223 | 37413 | 176.63 | 874 | 857 | 207.0 |
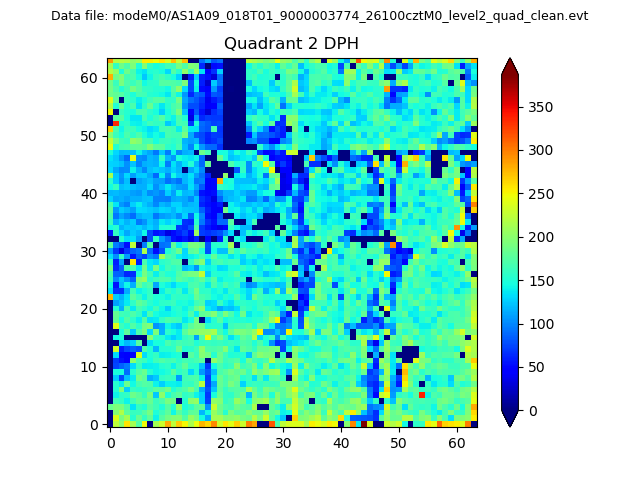
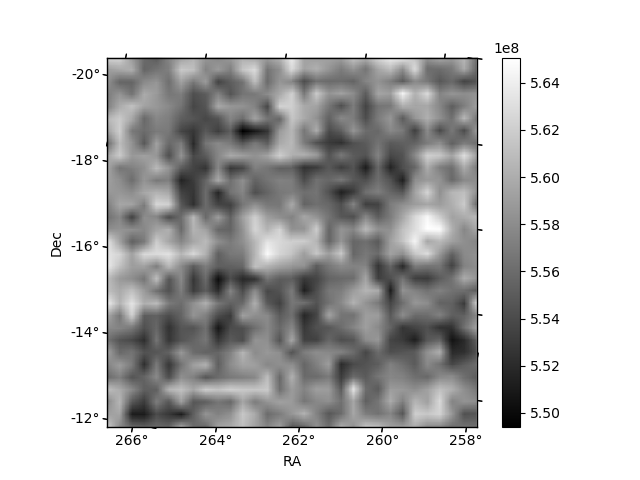
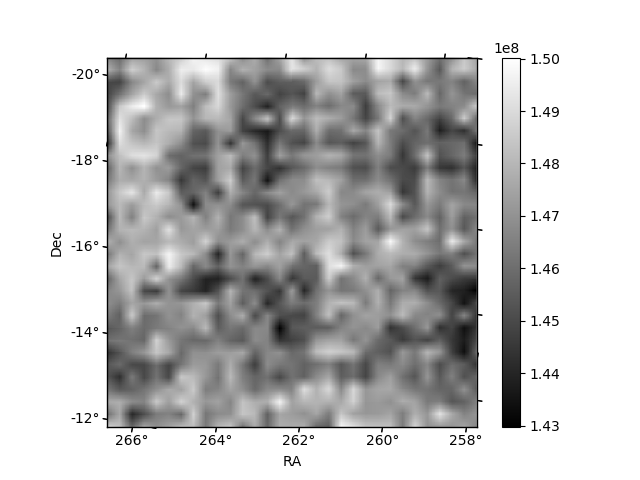
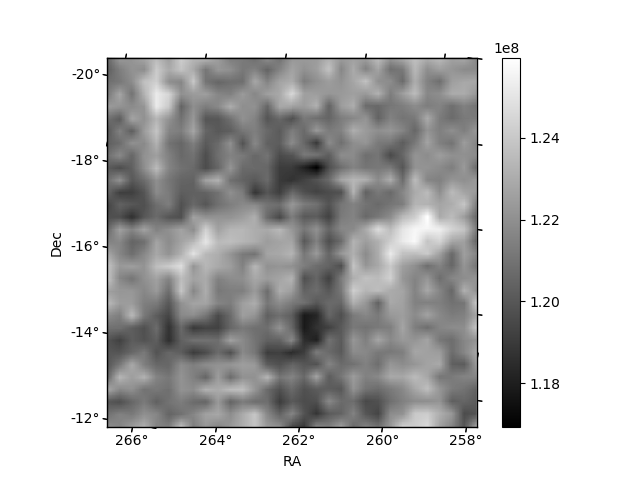
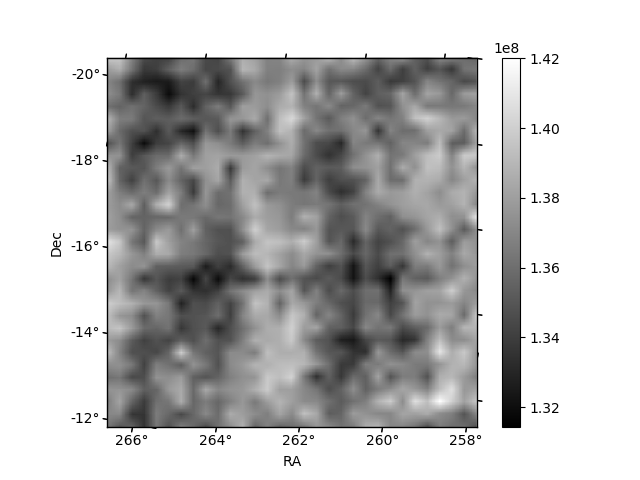
Histogram calculated using DETX and DETY for each event in the final _common_clean file
| Quadrant A | 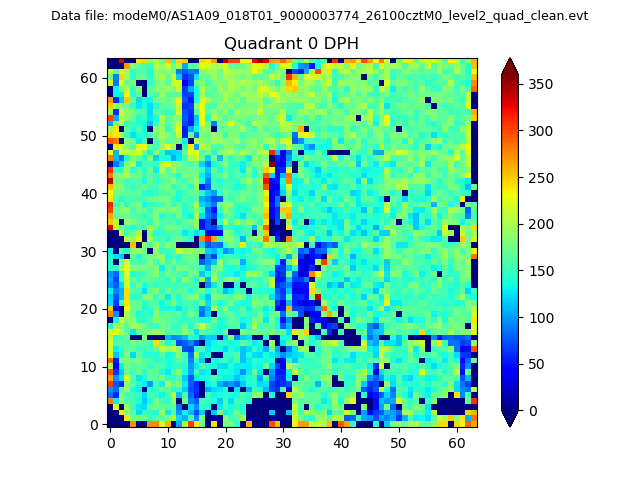 |
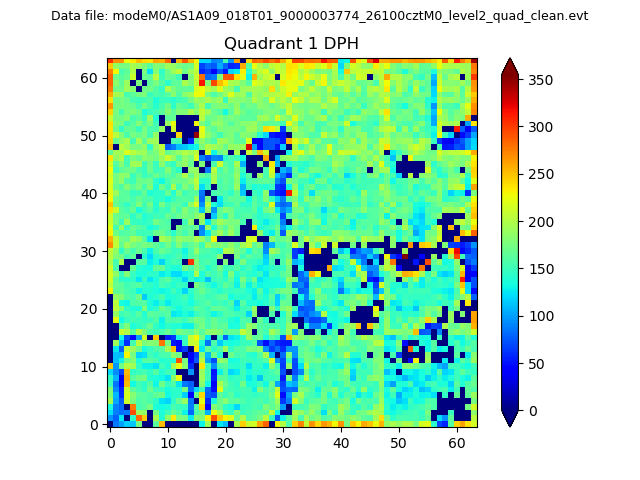 |
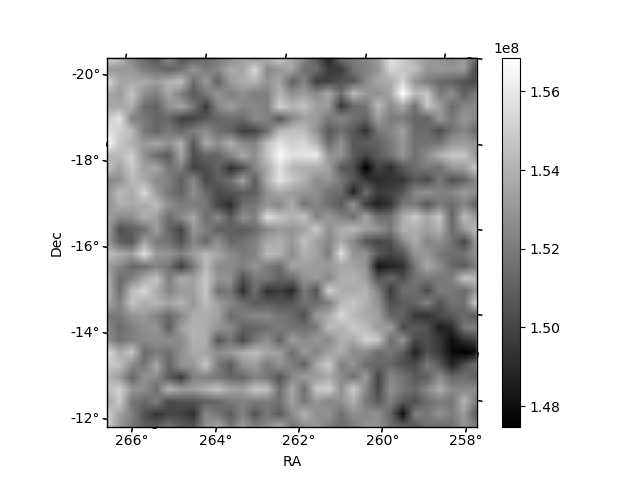
Quadrant B |
|---|---|---|---|
| Quadrant D | 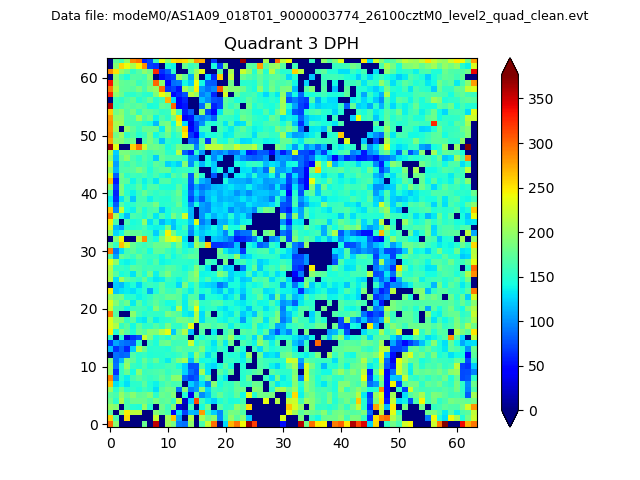 |
 |
Quadrant C |
| Plot type | Count rate plots | Images |
|---|---|---|
| Comparison with Poisson distribution Blue bars denote a histogram of data divided into 1 sec bins. Red curve is a Poisson curve with rate = median count rate of data. |
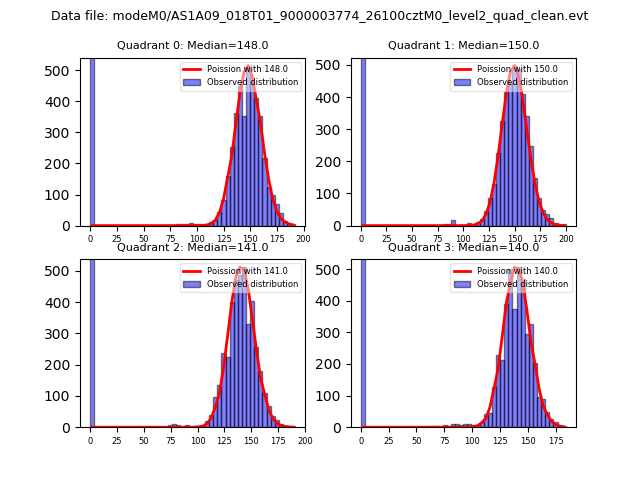 |
 |
| Quadrant-wise count rates Data is divided into 100 sec bins |
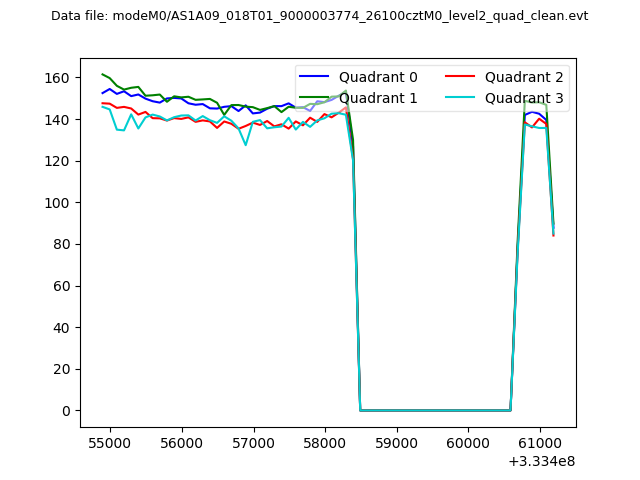 |
|
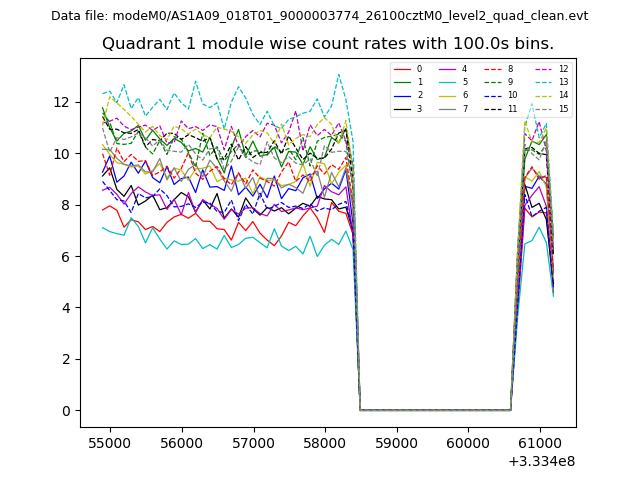
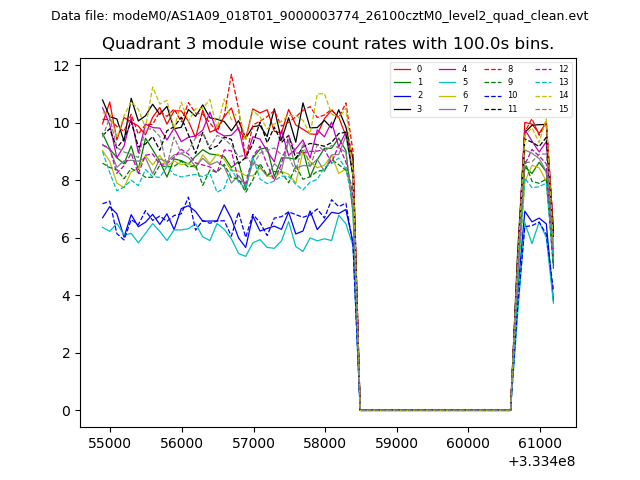
| Module-wise count rates for Quadrant A Data is divided into 100 sec bins |
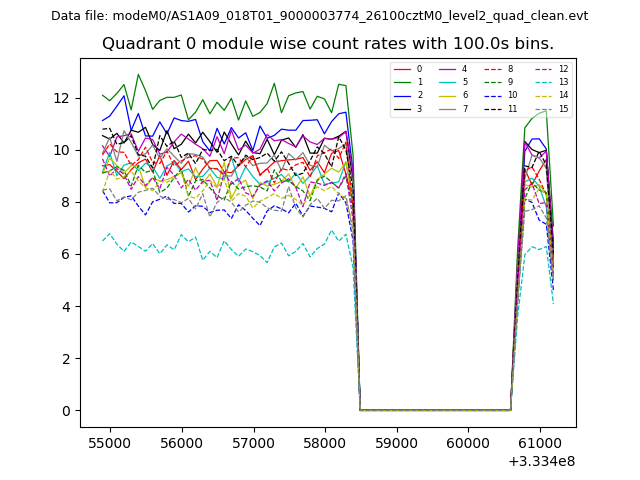 |
 |
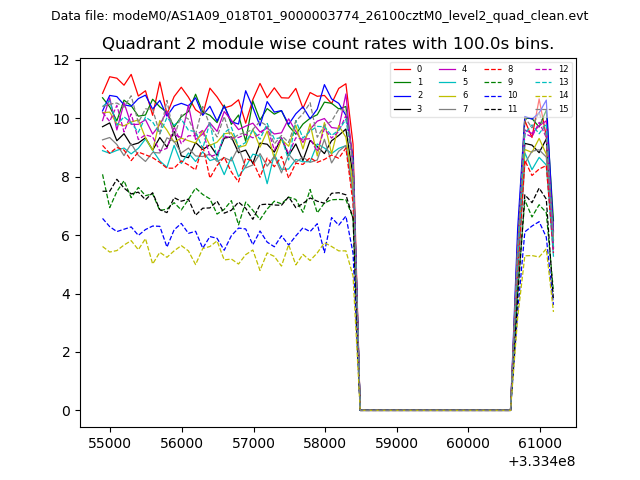
| Module-wise count rates for Quadrant B Data is divided into 100 sec bins |
 |
 |
| Module-wise count rates for Quadrant C Data is divided into 100 sec bins |
 |
 |
| Module-wise count rates for Quadrant D Data is divided into 100 sec bins |
 |
 |
| Parameter | Plot |
|---|---|
| CZT HV Monitor |  |
| D_VDD | 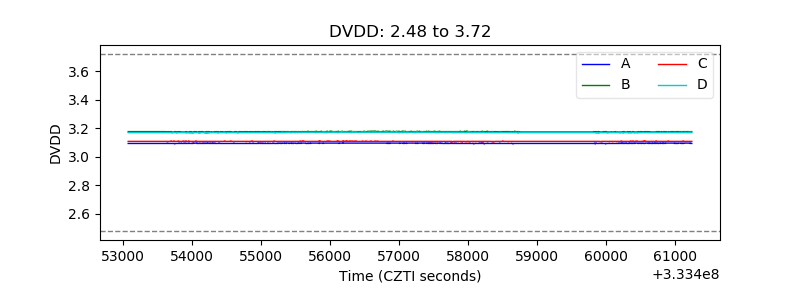 |
| Temperature 1 | 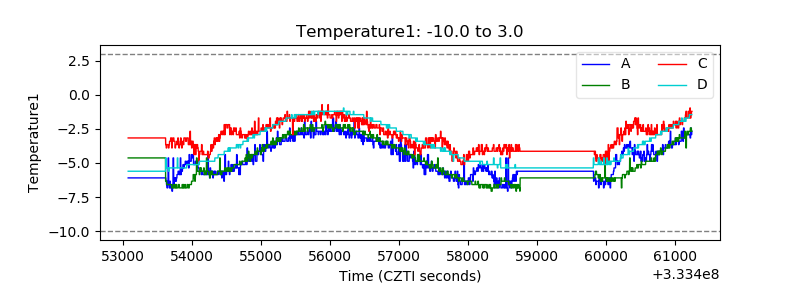 |
| Veto HV Monitor | 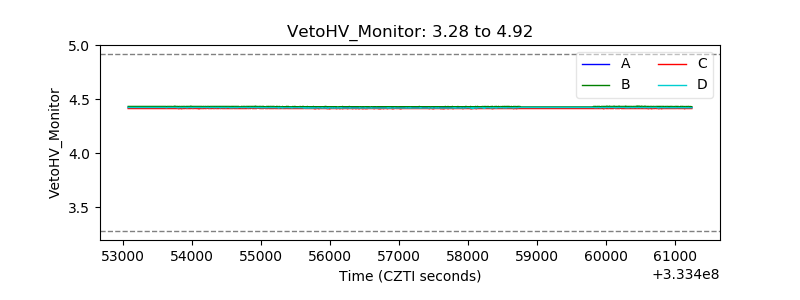 |
| Veto LLD | 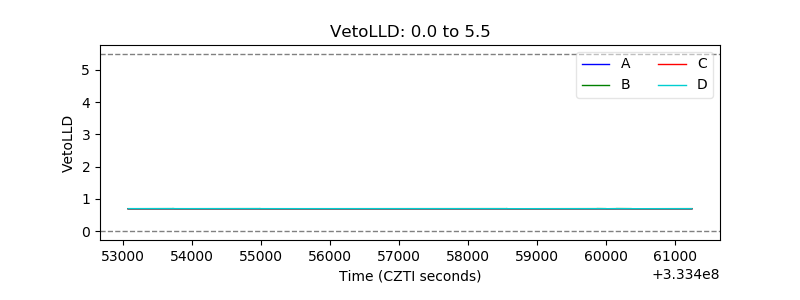 |
| Alpha Counter | 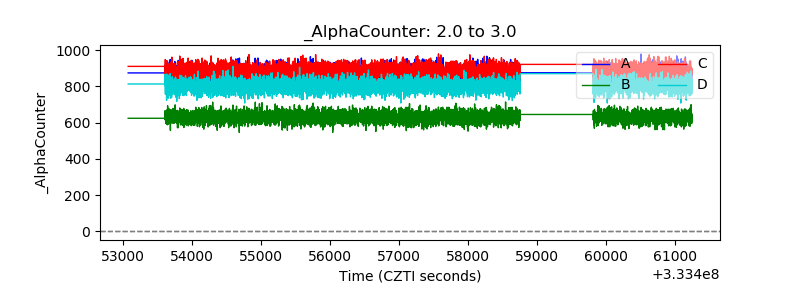 |
| _CPM_Rate | 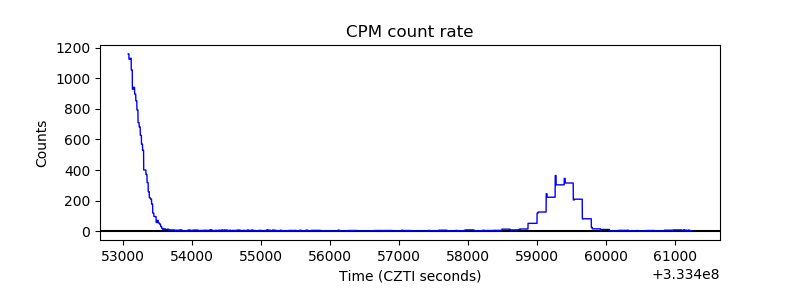 |
| CZT Counter | 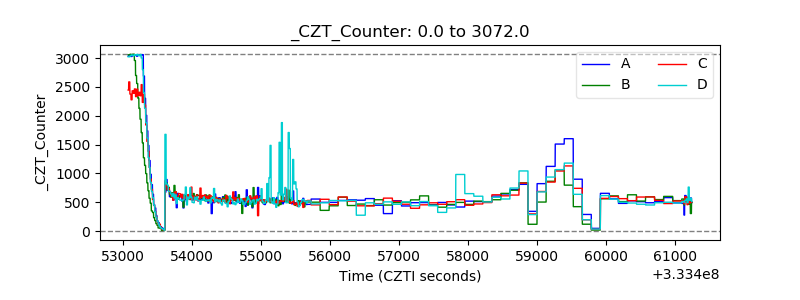 |
| +2.5 Volts monitor |  |
| +5 Volts monitor | 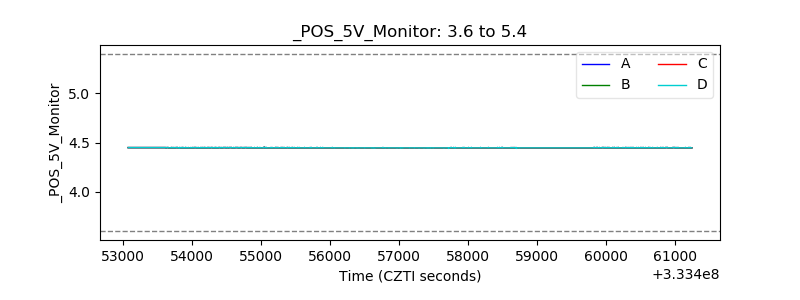 |
| _ROLL_ROT |  |
| _Roll_DEC | 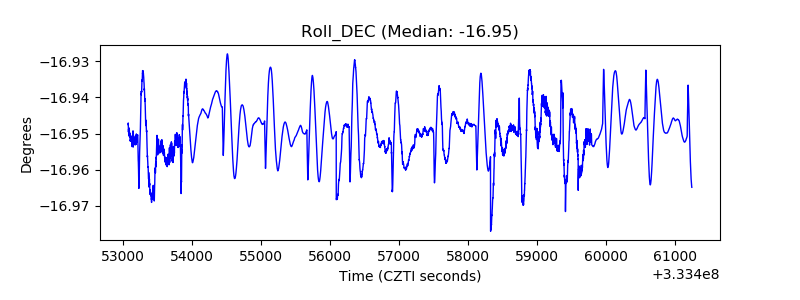 |
| _Roll_RA | 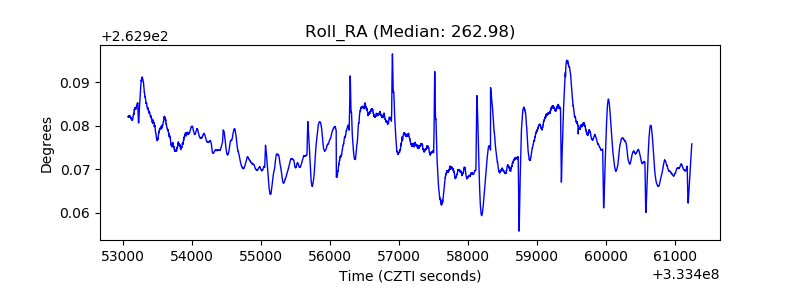 |
| Veto Counter |  |