| Param | Original file | Final file |
|---|---|---|
| Filename | modeM0/AS1A09_018T01_9000003774_26101cztM0_level2.evt | modeM0/AS1A09_018T01_9000003774_26101cztM0_level2_quad_clean.evt |
| Size (bytes) | 559,422,720 | 96,007,680 |
| Size | 533.5 MB | 91.6 MB |
| Events in quadrant A | 3,541,212 | 623,990 |
| Events in quadrant B | 3,610,394 | 634,561 |
| Events in quadrant C | 3,568,868 | 597,183 |
| Events in quadrant D | 5,746,096 | 563,298 |
| Mode M0 | |||
|---|---|---|---|
| Quadrant | BADHDUFLAG | Total packets | Discarded packets |
| A | 0 | 14586 | 0 |
| B | 0 | 14770 | 0 |
| C | 0 | 14749 | 0 |
| D | 0 | 21544 | 0 |
| Mode M9 | |||
|---|---|---|---|
| Quadrant | BADHDUFLAG | Total packets | Discarded packets |
| A | 0 | 10 | 0 |
| B | 0 | 11 | 0 |
| C | 0 | 11 | 0 |
| D | 0 | 11 | 0 |
| Quadrant | Total seconds | Saturated seconds | Saturation percentage |
|---|---|---|---|
| A | 7011 | 131 | 1.868492% |
| B | 7011 | 156 | 2.225075% |
| C | 7011 | 187 | 2.667237% |
| D | 7011 | 555 | 7.916132% |
Noise dominated data is calculated using 1-second bins in cleaned event files. If a bin has >2000 counts, and if more than 50% of those come from <1% of pixels, then it is considered to be noise-dominated and hence unusable.
| Quadrant | # 1 sec bins | Bins with >0 counts | Bins with >2000 counts | High rate bins dominated by noise | Noise dominated (total time) | Noise dominated (detector-on time) | Marked lightcurve |
|---|---|---|---|---|---|---|---|
| A | 7701 | 7011 | 0 | 0 | 0.00% | 0.00% | 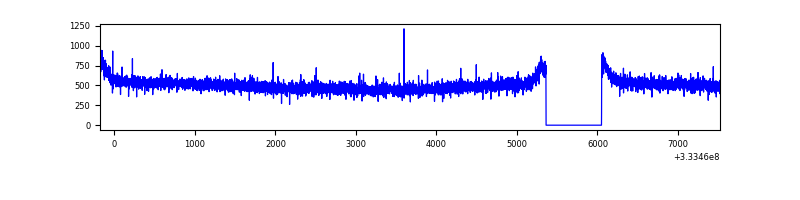 |
| B | 7701 | 7011 | 0 | 0 | 0.00% | 0.00% | 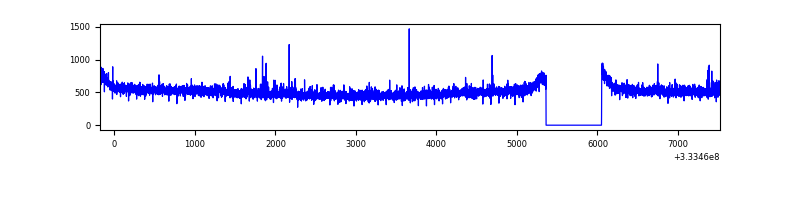 |
| C | 7701 | 7011 | 0 | 0 | 0.00% | 0.00% | 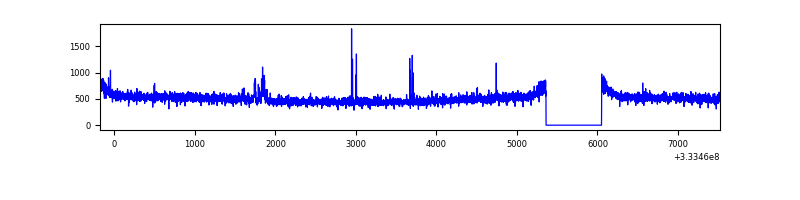 |
| D | 7701 | 7011 | 498 | 498 | 6.47% | 7.10% | 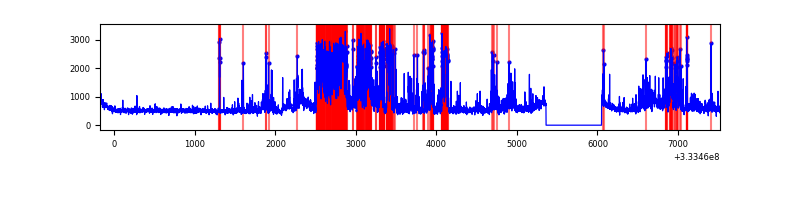 |
Top three noisy pixels from each quadrant. If the there are fewer than three noisy pixels in the level2.evt file, extra rows are filled as -1
| Pixel properties | Quadrant properties | ||||||
|---|---|---|---|---|---|---|---|
| Quadrant | DetID | PixID | Counts | Sigma | Mean | Median | Sigma |
| A | 13 | 254 | 11819 | 58.71 | 918 | 900 | 186.0 |
| A | 3 | 137 | 8326 | 39.93 | 918 | 900 | 186.0 |
| A | 0 | 226 | 7616 | 36.11 | 918 | 900 | 186.0 |
| B | 12 | 111 | 21325 | 116.96 | 906 | 884 | 174.8 |
| B | 0 | 190 | 20683 | 113.29 | 906 | 884 | 174.8 |
| B | 11 | 111 | 19394 | 105.91 | 906 | 884 | 174.8 |
| C | 14 | 238 | 137960 | 674.92 | 867 | 873 | 203.1 |
| C | 3 | 233 | 39944 | 192.36 | 867 | 873 | 203.1 |
| C | 6 | 80 | 10315 | 46.49 | 867 | 873 | 203.1 |
| D | 1 | 52 | 1456562 | 7008.2 | 867 | 846 | 207.7 |
| D | 12 | 233 | 684827 | 3292.87 | 867 | 846 | 207.7 |
| D | 7 | 80 | 201916 | 968.0 | 867 | 846 | 207.7 |
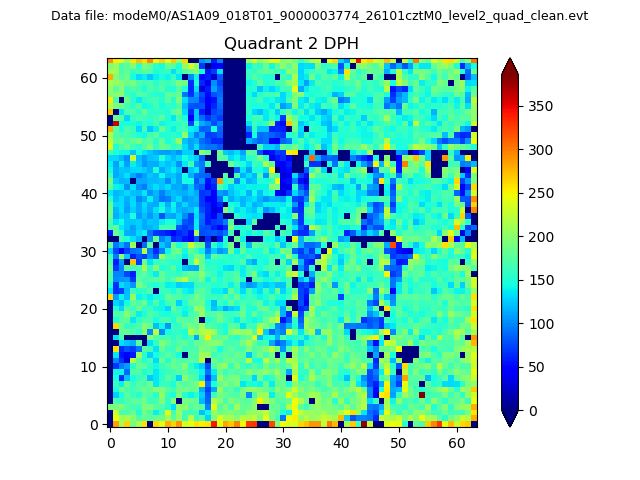
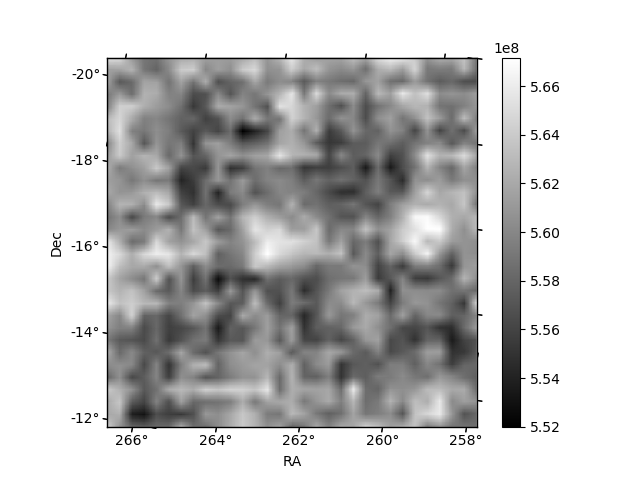
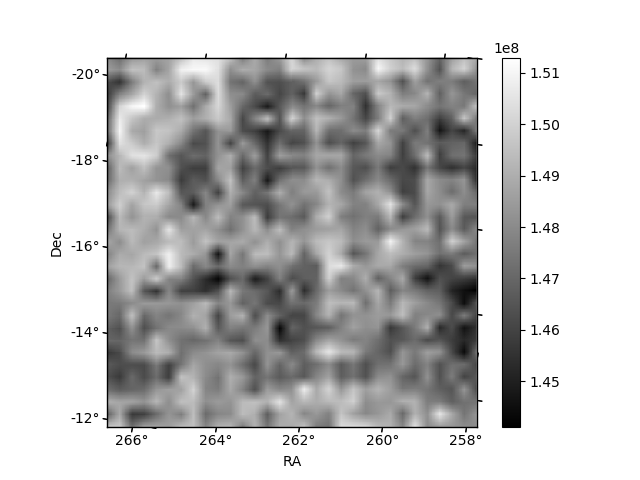
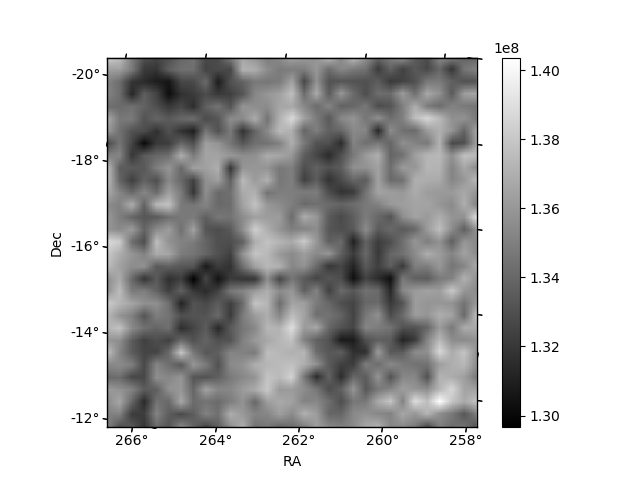
Histogram calculated using DETX and DETY for each event in the final _common_clean file
| Quadrant A | 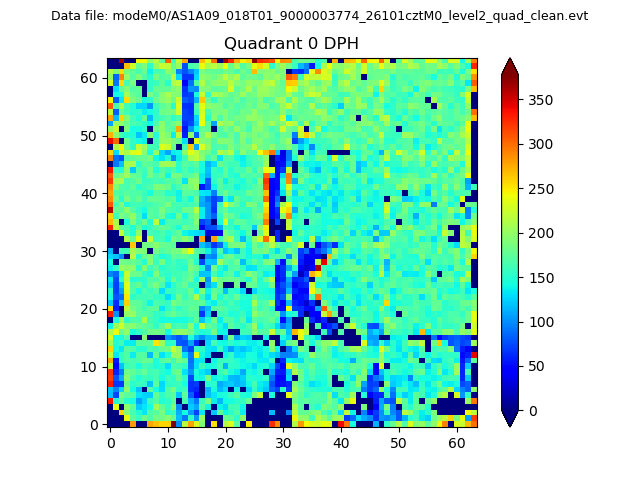 |
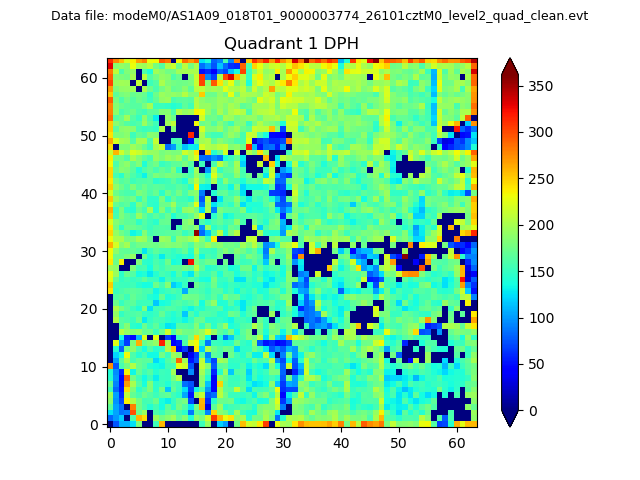 |
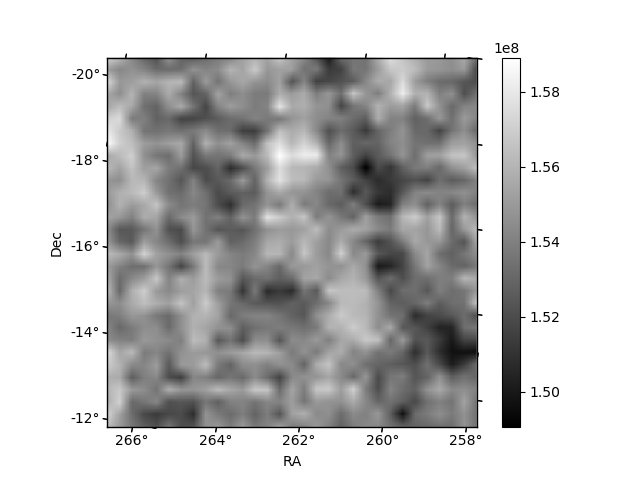
Quadrant B |
|---|---|---|---|
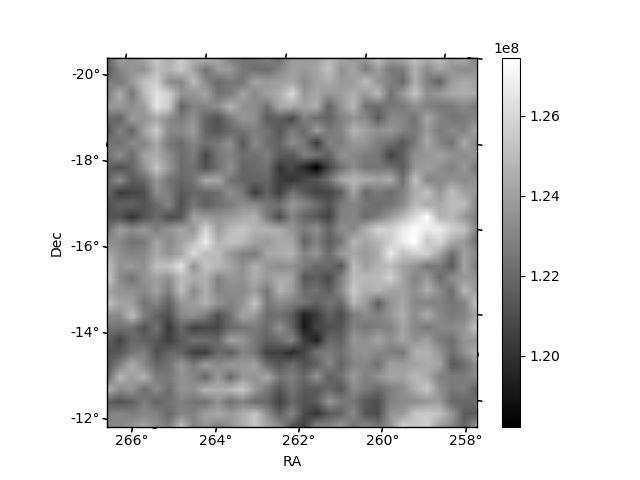
| Quadrant D | 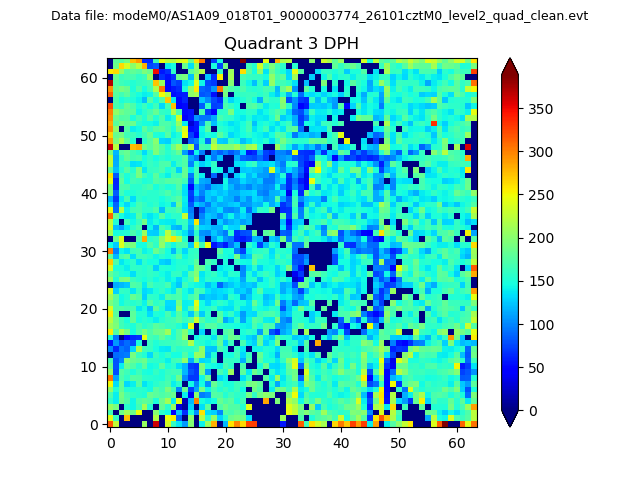 |
 |
Quadrant C |
| Plot type | Count rate plots | Images |
|---|---|---|
| Comparison with Poisson distribution Blue bars denote a histogram of data divided into 1 sec bins. Red curve is a Poisson curve with rate = median count rate of data. |
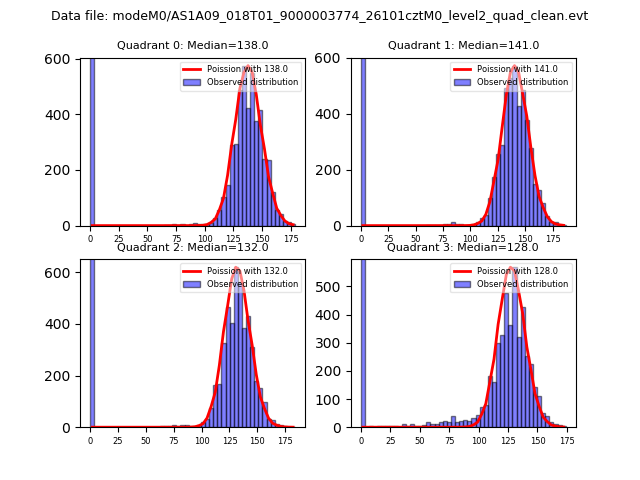 |
 |
| Quadrant-wise count rates Data is divided into 100 sec bins |
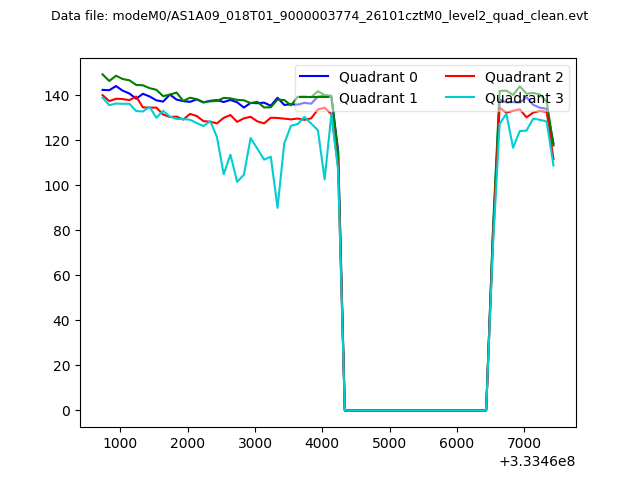 |
|
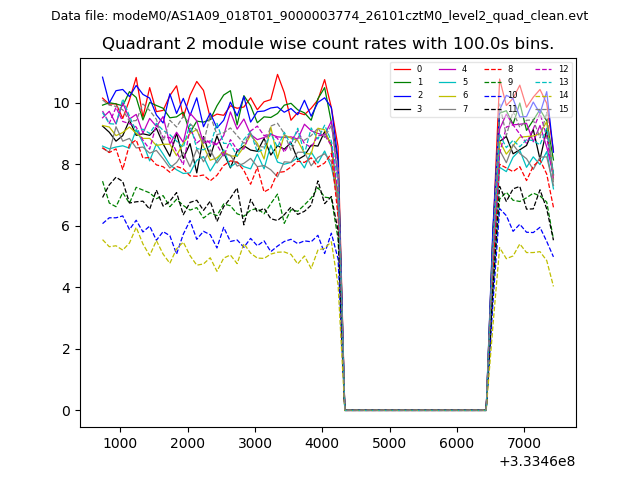
| Module-wise count rates for Quadrant A Data is divided into 100 sec bins |
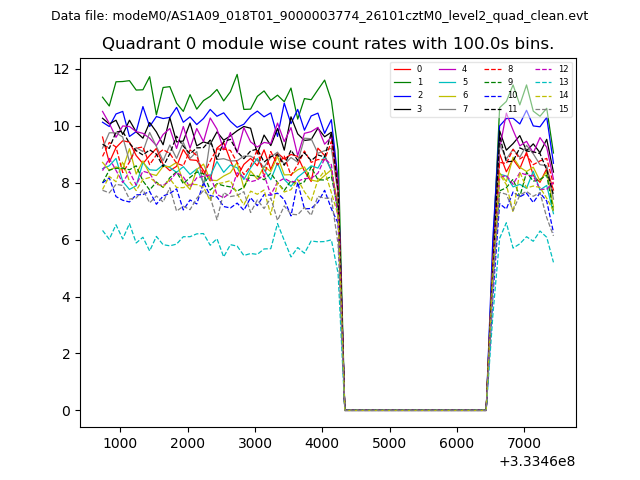 |
 |
| Module-wise count rates for Quadrant B Data is divided into 100 sec bins |
 |
 |
| Module-wise count rates for Quadrant C Data is divided into 100 sec bins |
 |
 |
| Module-wise count rates for Quadrant D Data is divided into 100 sec bins |
 |
 |
| Parameter | Plot |
|---|---|
| CZT HV Monitor | 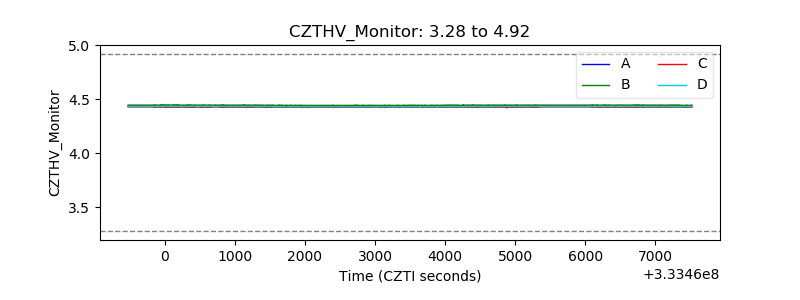 |
| D_VDD | 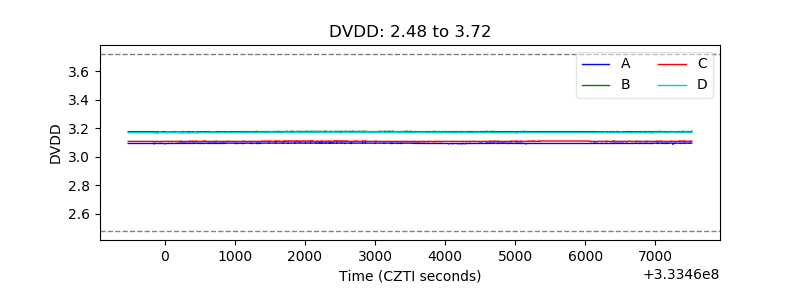 |
| Temperature 1 | 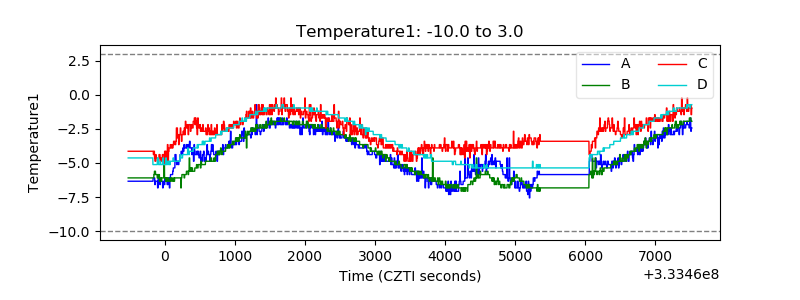 |
| Veto HV Monitor | 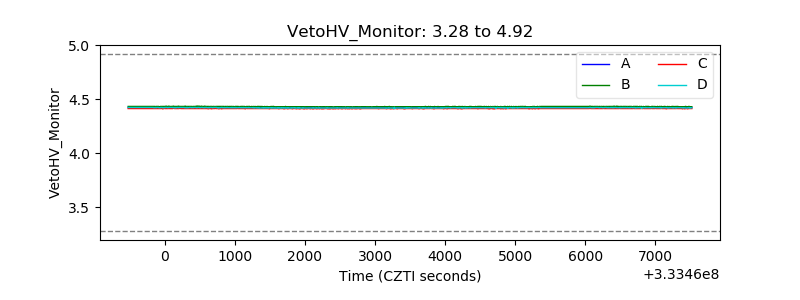 |
| Veto LLD |  |
| Alpha Counter |  |
| _CPM_Rate | 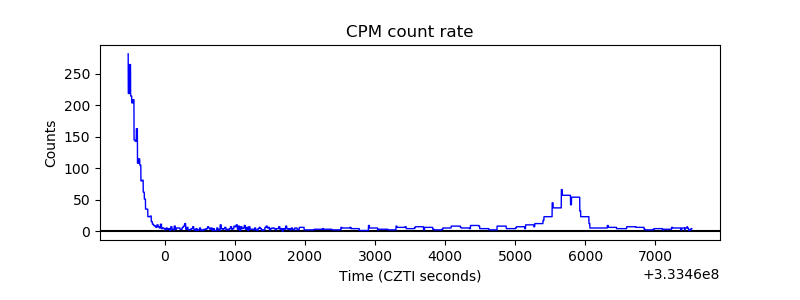 |
| CZT Counter | 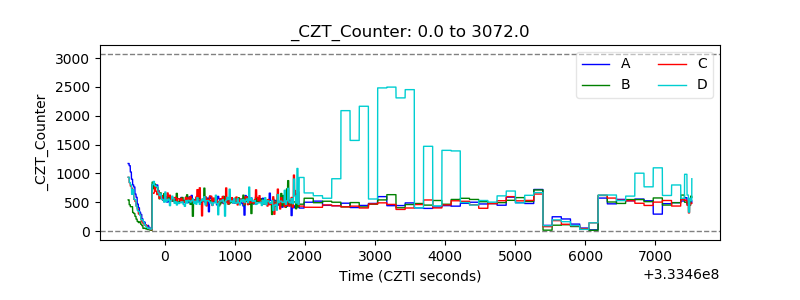 |
| +2.5 Volts monitor |  |
| +5 Volts monitor | 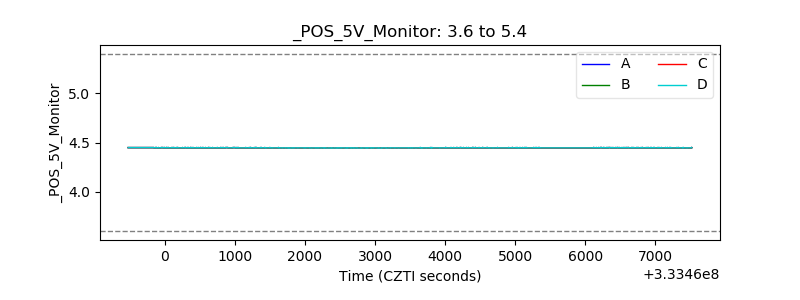 |
| _ROLL_ROT | 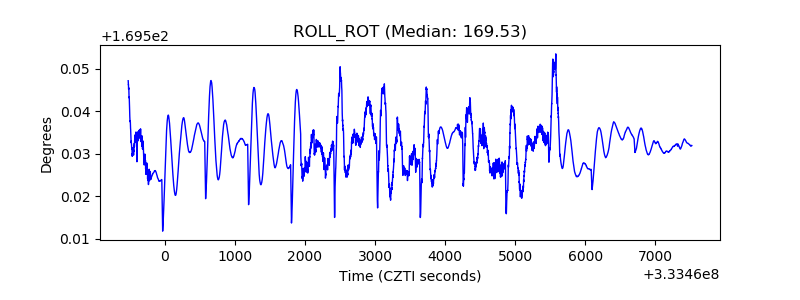 |
| _Roll_DEC |  |
| _Roll_RA | 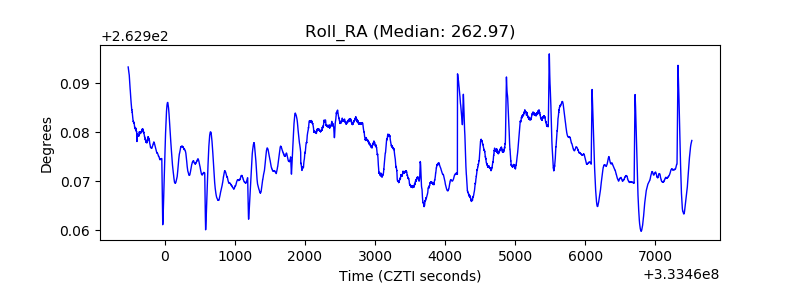 |
| Veto Counter | 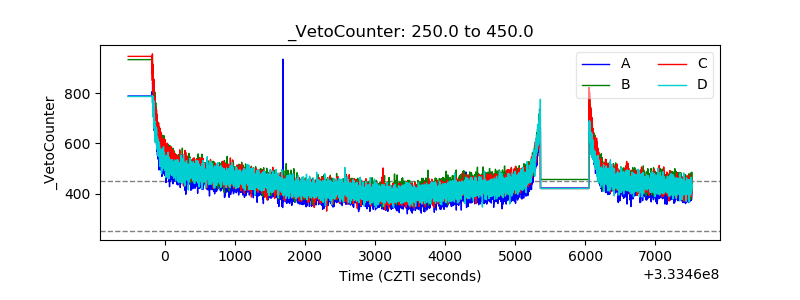 |