| Param | Original file | Final file |
|---|---|---|
| Filename | modeM0/AS1A09_018T01_9000003774_26102cztM0_level2.evt | modeM0/AS1A09_018T01_9000003774_26102cztM0_level2_quad_clean.evt |
| Size (bytes) | 554,636,160 | 103,930,560 |
| Size | 528.9 MB | 99.1 MB |
| Events in quadrant A | 3,804,315 | 669,846 |
| Events in quadrant B | 3,893,656 | 681,274 |
| Events in quadrant C | 3,932,094 | 641,554 |
| Events in quadrant D | 4,651,171 | 625,924 |
| Mode M0 | |||
|---|---|---|---|
| Quadrant | BADHDUFLAG | Total packets | Discarded packets |
| A | 0 | 15933 | 0 |
| B | 0 | 16143 | 0 |
| C | 0 | 16240 | 0 |
| D | 0 | 18788 | 0 |
| Mode M9 | |||
|---|---|---|---|
| Quadrant | BADHDUFLAG | Total packets | Discarded packets |
| A | 0 | 4 | 0 |
| B | 0 | 5 | 0 |
| C | 0 | 5 | 0 |
| D | 0 | 5 | 0 |
| Quadrant | Total seconds | Saturated seconds | Saturation percentage |
|---|---|---|---|
| A | 7602 | 186 | 2.446725% |
| B | 7602 | 224 | 2.946593% |
| C | 7602 | 240 | 3.157064% |
| D | 7602 | 250 | 3.288608% |
Noise dominated data is calculated using 1-second bins in cleaned event files. If a bin has >2000 counts, and if more than 50% of those come from <1% of pixels, then it is considered to be noise-dominated and hence unusable.
| Quadrant | # 1 sec bins | Bins with >0 counts | Bins with >2000 counts | High rate bins dominated by noise | Noise dominated (total time) | Noise dominated (detector-on time) | Marked lightcurve |
|---|---|---|---|---|---|---|---|
| A | 7812 | 7602 | 0 | 0 | 0.00% | 0.00% | 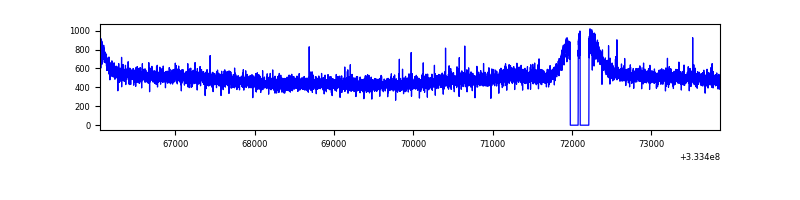 |
| B | 7812 | 7602 | 1 | 1 | 0.01% | 0.01% | 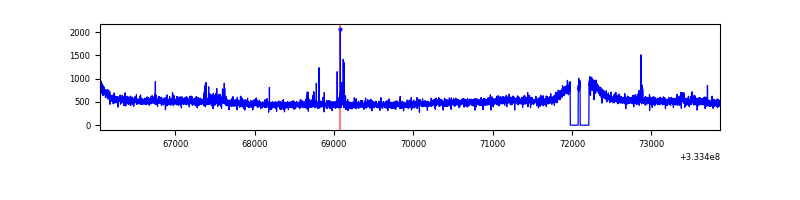 |
| C | 7812 | 7602 | 1 | 1 | 0.01% | 0.01% | 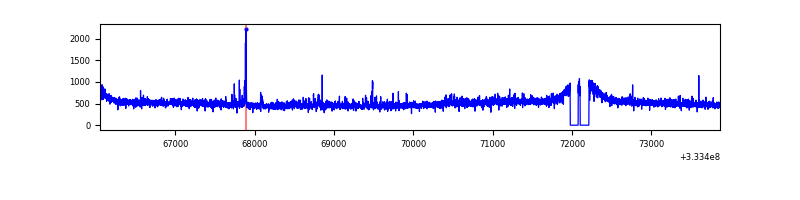 |
| D | 7812 | 7602 | 118 | 118 | 1.51% | 1.55% | 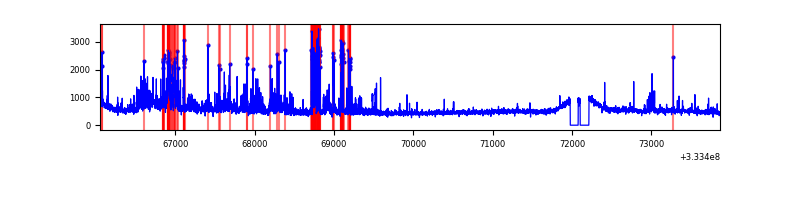 |
Top three noisy pixels from each quadrant. If the there are fewer than three noisy pixels in the level2.evt file, extra rows are filled as -1
| Pixel properties | Quadrant properties | ||||||
|---|---|---|---|---|---|---|---|
| Quadrant | DetID | PixID | Counts | Sigma | Mean | Median | Sigma |
| A | 13 | 254 | 11967 | 55.11 | 986 | 965 | 199.7 |
| A | 3 | 137 | 9341 | 41.95 | 986 | 965 | 199.7 |
| A | 0 | 226 | 8282 | 36.65 | 986 | 965 | 199.7 |
| B | 0 | 190 | 34545 | 176.99 | 975 | 949 | 189.8 |
| B | 12 | 111 | 23239 | 117.43 | 975 | 949 | 189.8 |
| B | 11 | 111 | 21463 | 108.07 | 975 | 949 | 189.8 |
| C | 14 | 238 | 147674 | 665.16 | 935 | 939 | 220.6 |
| C | 3 | 233 | 110747 | 497.77 | 935 | 939 | 220.6 |
| C | 13 | 250 | 20475 | 88.56 | 935 | 939 | 220.6 |
| D | 1 | 52 | 637274 | 2787.37 | 950 | 928 | 228.3 |
| D | 12 | 233 | 287892 | 1256.98 | 950 | 928 | 228.3 |
| D | 7 | 223 | 38962 | 166.6 | 950 | 928 | 228.3 |
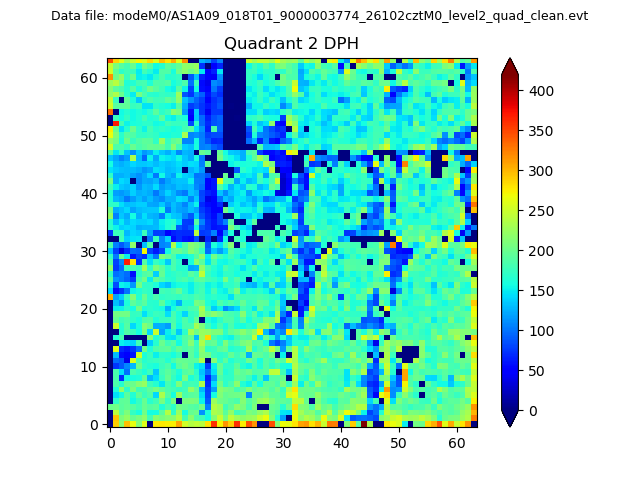
Histogram calculated using DETX and DETY for each event in the final _common_clean file
| Quadrant A | 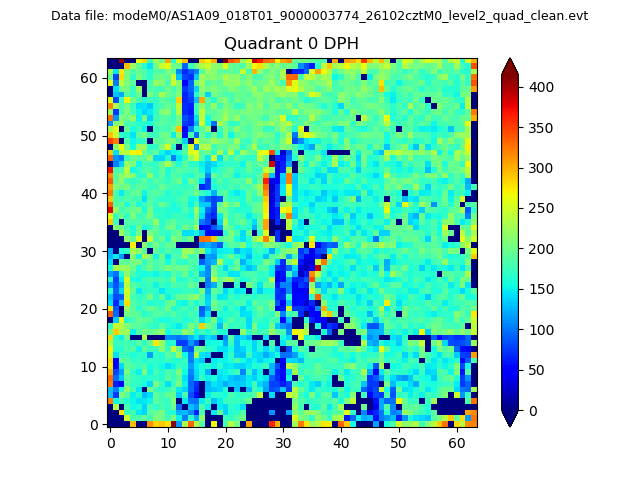 |
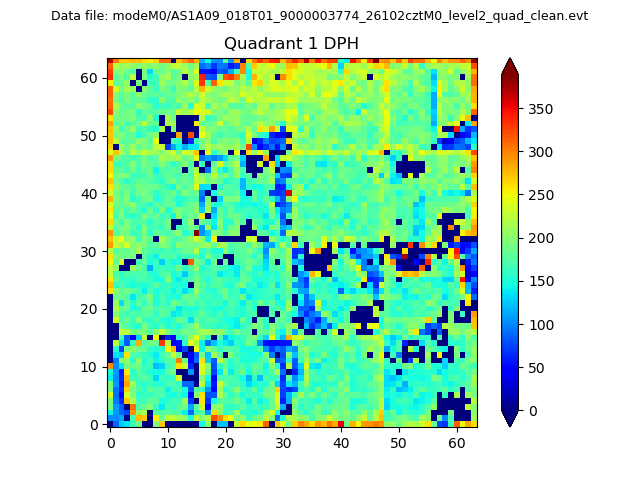 |
Quadrant B |
|---|---|---|---|
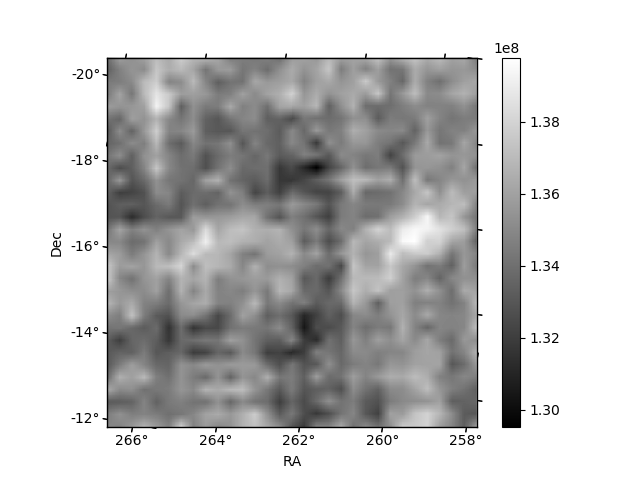
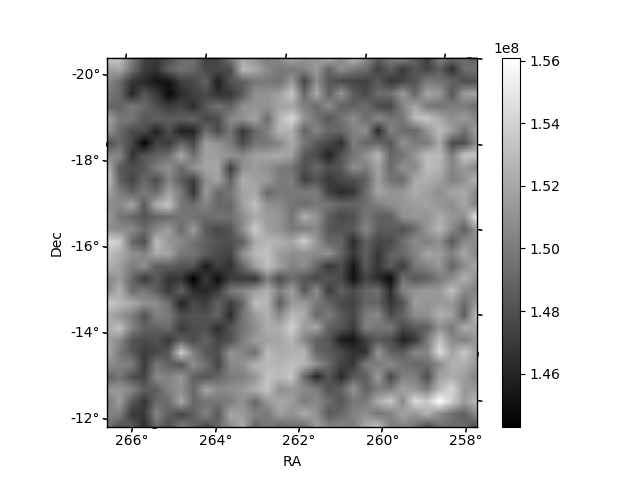
| Quadrant D | 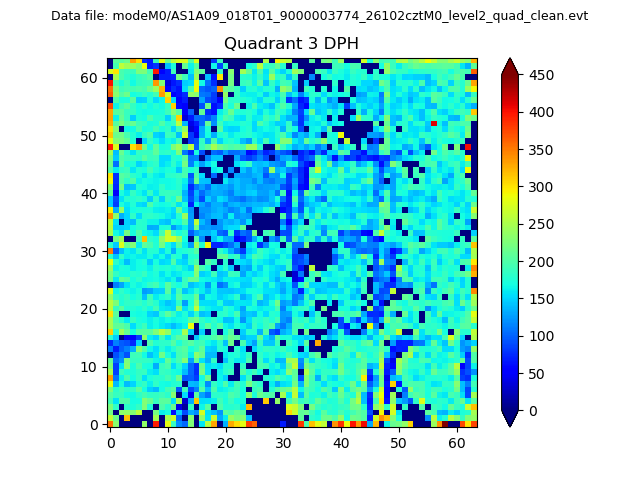 |
 |
Quadrant C |
| Plot type | Count rate plots | Images |
|---|---|---|
| Comparison with Poisson distribution Blue bars denote a histogram of data divided into 1 sec bins. Red curve is a Poisson curve with rate = median count rate of data. |
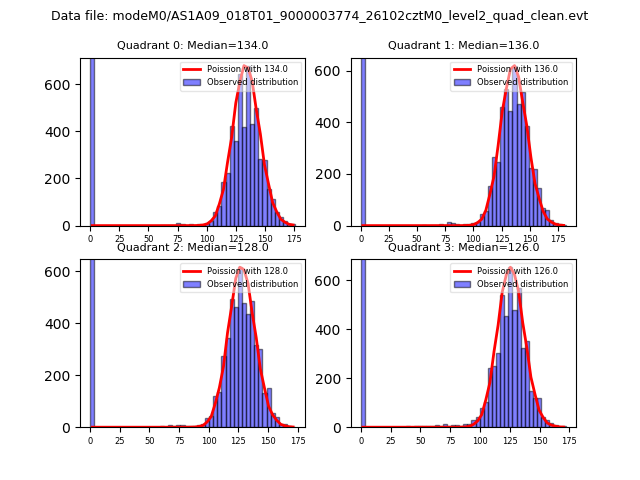 |
 |
| Quadrant-wise count rates Data is divided into 100 sec bins |
 |
|
| Module-wise count rates for Quadrant A Data is divided into 100 sec bins |
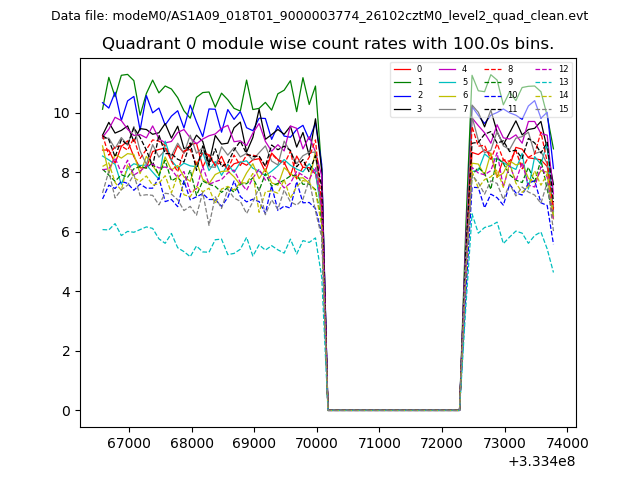 |
 |
| Module-wise count rates for Quadrant B Data is divided into 100 sec bins |
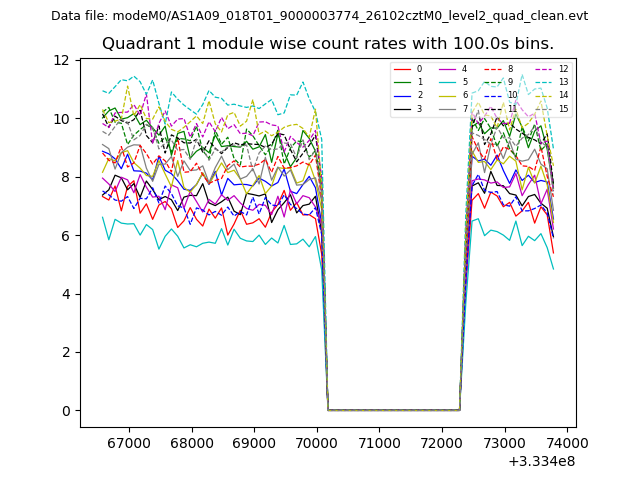 |
 |
| Module-wise count rates for Quadrant C Data is divided into 100 sec bins |
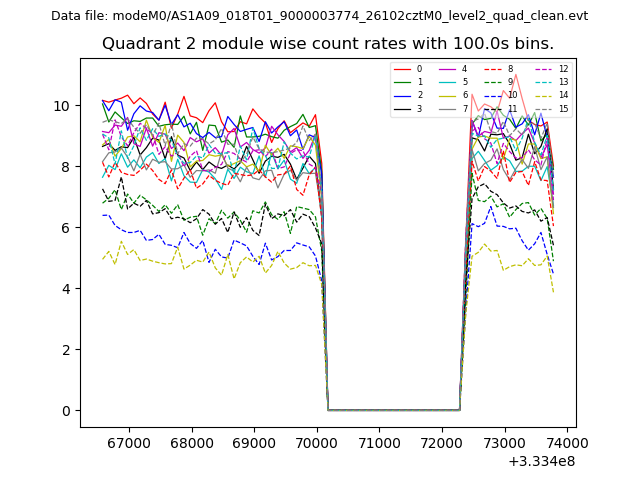 |
 |
| Module-wise count rates for Quadrant D Data is divided into 100 sec bins |
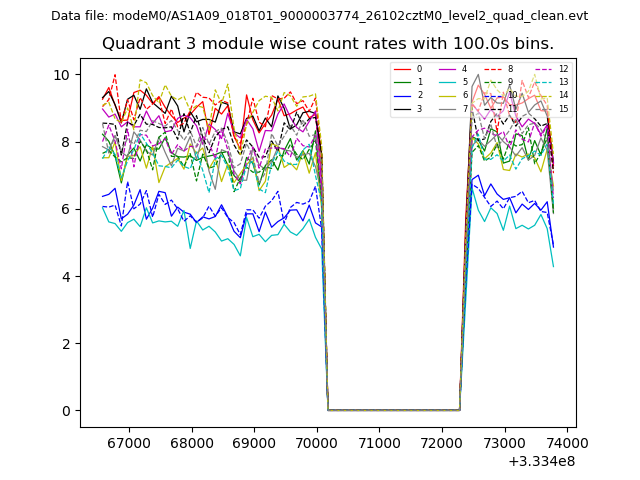 |
 |
| Parameter | Plot |
|---|---|
| CZT HV Monitor | 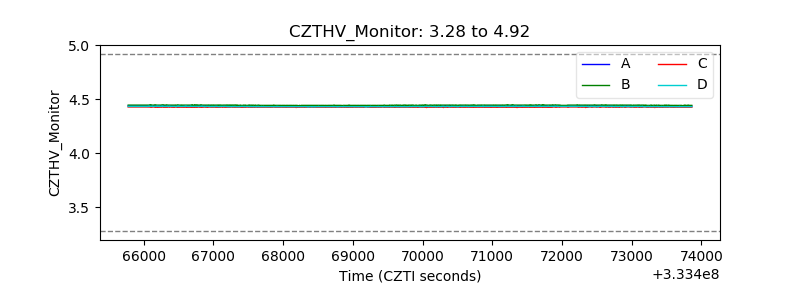 |
| D_VDD | 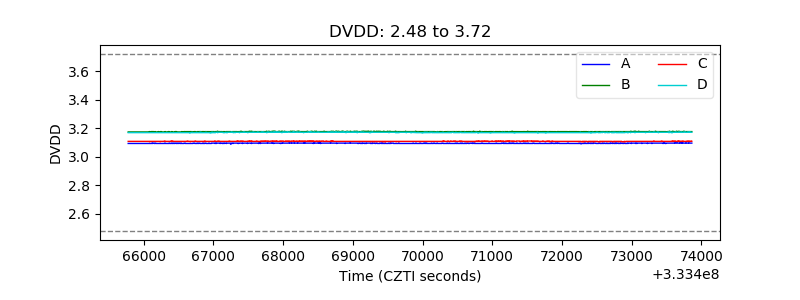 |
| Temperature 1 | 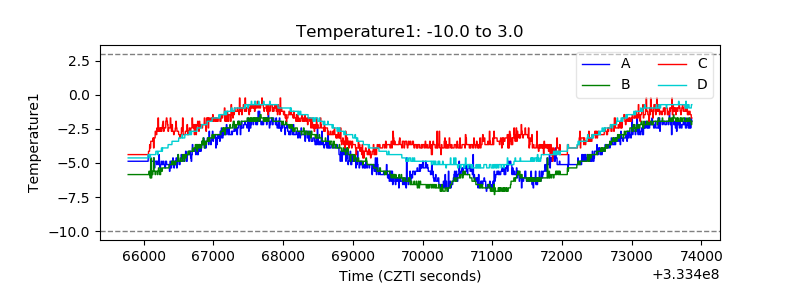 |
| Veto HV Monitor | 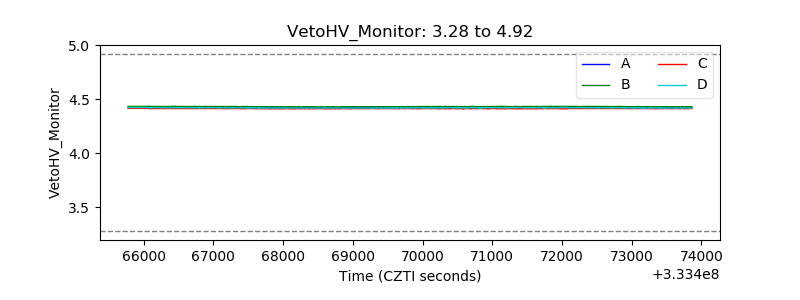 |
| Veto LLD | 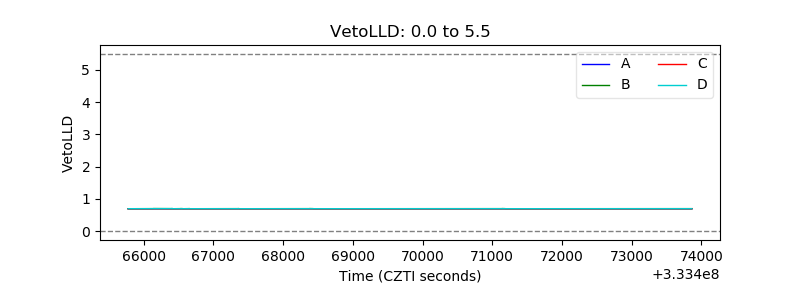 |
| Alpha Counter | 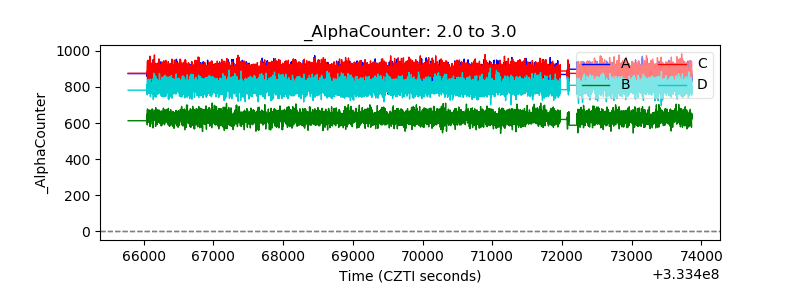 |
| _CPM_Rate | 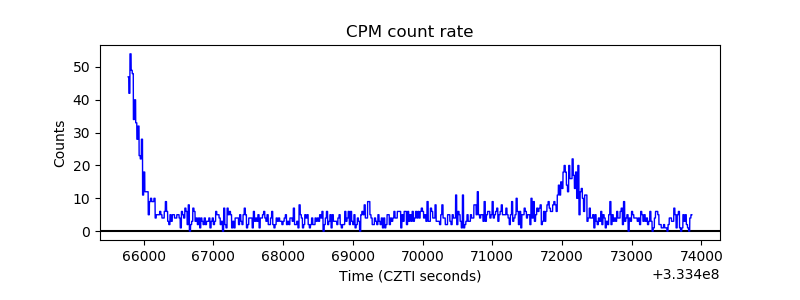 |
| CZT Counter |  |
| +2.5 Volts monitor |  |
| +5 Volts monitor |  |
| _ROLL_ROT | 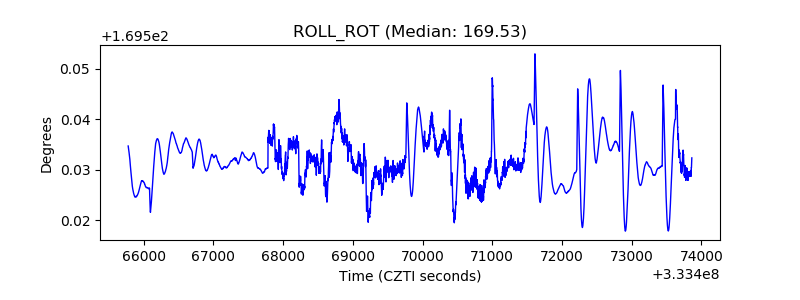 |
| _Roll_DEC | 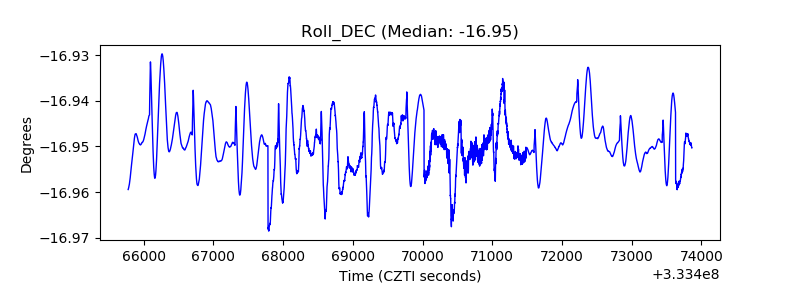 |
| _Roll_RA | 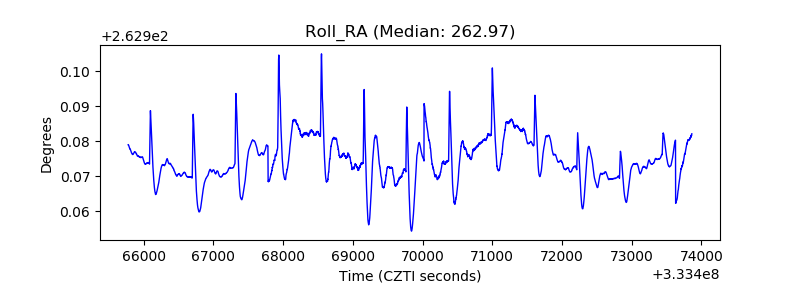 |
| Veto Counter | 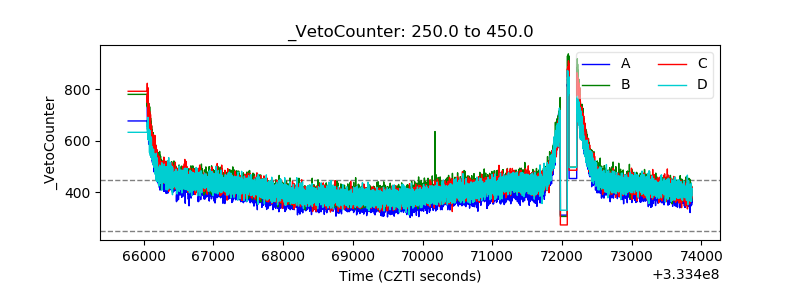 |