| Param | Original file | Final file |
|---|---|---|
| Filename | modeM0/AS1A09_018T01_9000003774_26106cztM0_level2.evt | modeM0/AS1A09_018T01_9000003774_26106cztM0_level2_quad_clean.evt |
| Size (bytes) | 1,088,588,160 | 168,641,280 |
| Size | 1.0 GB | 160.8 MB |
| Events in quadrant A | 6,137,303 | 1,102,341 |
| Events in quadrant B | 6,437,487 | 1,114,414 |
| Events in quadrant C | 7,702,788 | 1,036,760 |
| Events in quadrant D | 11,818,804 | 961,334 |
| Mode M0 | |||
|---|---|---|---|
| Quadrant | BADHDUFLAG | Total packets | Discarded packets |
| A | 0 | 26641 | 0 |
| B | 0 | 27254 | 0 |
| C | 0 | 31511 | 0 |
| D | 0 | 43894 | 0 |
| Mode M9 | |||
|---|---|---|---|
| Quadrant | BADHDUFLAG | Total packets | Discarded packets |
| A | 0 | 17 | 0 |
| B | 0 | 17 | 0 |
| C | 0 | 17 | 0 |
| D | 0 | 17 | 0 |
| Quadrant | Total seconds | Saturated seconds | Saturation percentage |
|---|---|---|---|
| A | 12908 | 103 | 0.797955% |
| B | 12909 | 146 | 1.130994% |
| C | 12909 | 585 | 4.531722% |
| D | 12908 | 1233 | 9.552216% |
Noise dominated data is calculated using 1-second bins in cleaned event files. If a bin has >2000 counts, and if more than 50% of those come from <1% of pixels, then it is considered to be noise-dominated and hence unusable.
| Quadrant | # 1 sec bins | Bins with >0 counts | Bins with >2000 counts | High rate bins dominated by noise | Noise dominated (total time) | Noise dominated (detector-on time) | Marked lightcurve |
|---|---|---|---|---|---|---|---|
| A | 14613 | 12910 | 0 | 0 | 0.00% | 0.00% | 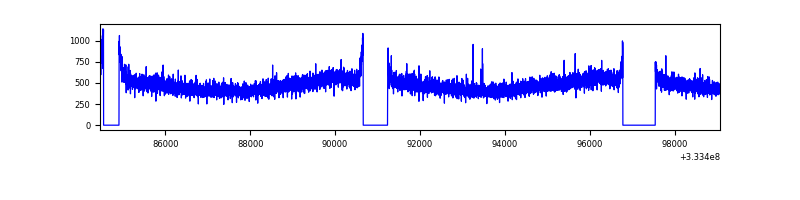 |
| B | 14614 | 12910 | 17 | 17 | 0.12% | 0.13% | 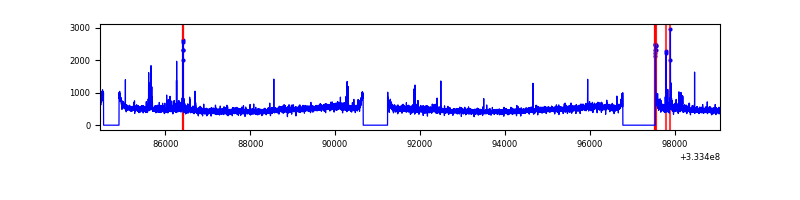 |
| C | 14614 | 12911 | 253 | 253 | 1.73% | 1.96% | 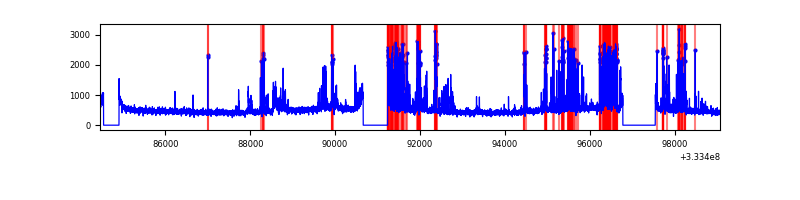 |
| D | 14613 | 12909 | 1073 | 1073 | 7.34% | 8.31% | 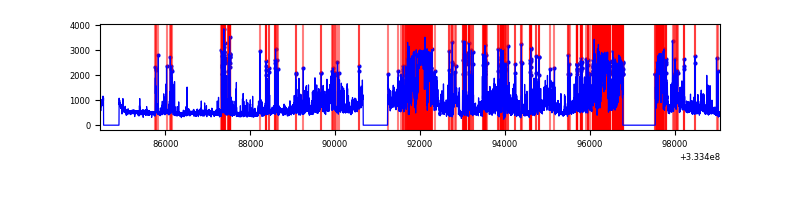 |
Top three noisy pixels from each quadrant. If the there are fewer than three noisy pixels in the level2.evt file, extra rows are filled as -1
| Pixel properties | Quadrant properties | ||||||
|---|---|---|---|---|---|---|---|
| Quadrant | DetID | PixID | Counts | Sigma | Mean | Median | Sigma |
| A | 13 | 254 | 20068 | 57.76 | 1591 | 1555 | 320.5 |
| A | 3 | 137 | 15012 | 41.99 | 1591 | 1555 | 320.5 |
| A | 0 | 226 | 13482 | 37.21 | 1591 | 1555 | 320.5 |
| B | 5 | 172 | 75411 | 242.18 | 1578 | 1539 | 305.0 |
| B | 4 | 80 | 55277 | 176.17 | 1578 | 1539 | 305.0 |
| B | 3 | 64 | 46509 | 147.43 | 1578 | 1539 | 305.0 |
| C | 2 | 16 | 1143547 | 3234.99 | 1494 | 1504 | 353.0 |
| C | 3 | 233 | 494918 | 1397.66 | 1494 | 1504 | 353.0 |
| C | 14 | 238 | 237197 | 667.63 | 1494 | 1504 | 353.0 |
| D | 1 | 52 | 5713856 | 16198.81 | 1465 | 1429 | 352.6 |
| D | 7 | 223 | 182298 | 512.89 | 1465 | 1429 | 352.6 |
| D | 13 | 238 | 107043 | 299.49 | 1465 | 1429 | 352.6 |
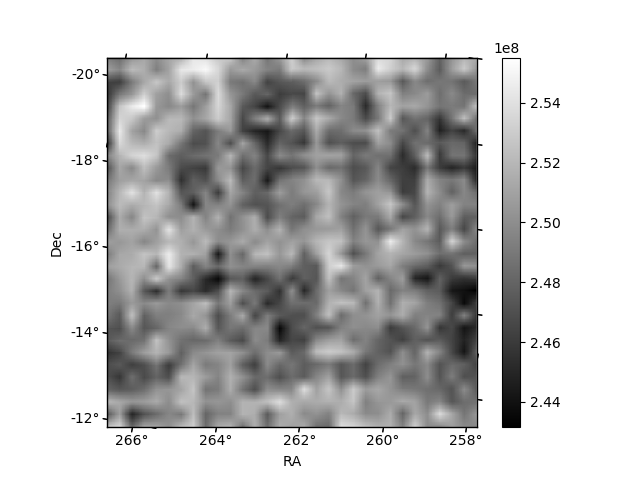
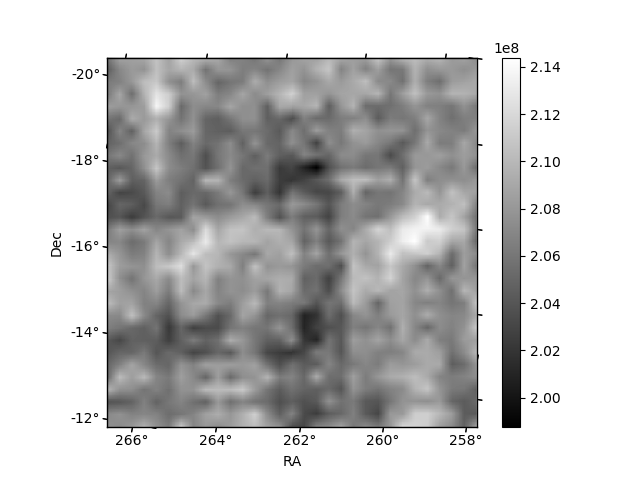
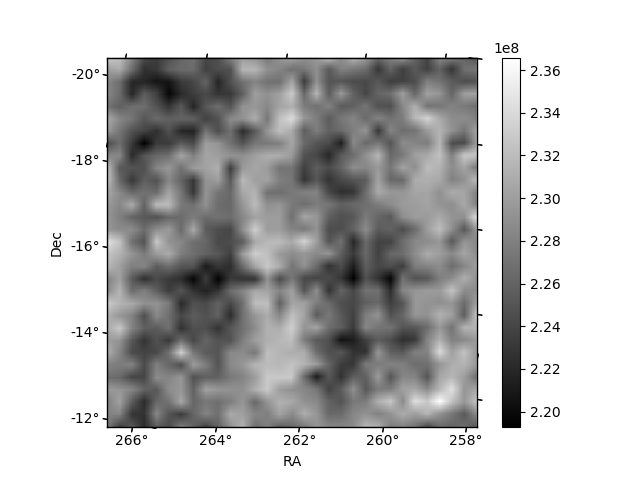
Histogram calculated using DETX and DETY for each event in the final _common_clean file
| Quadrant A | 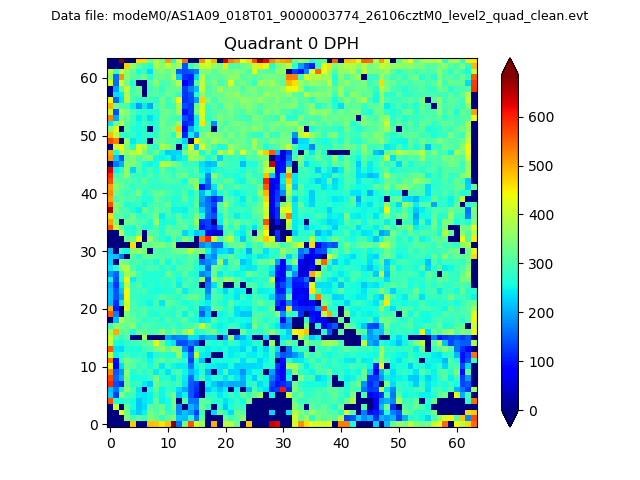 |
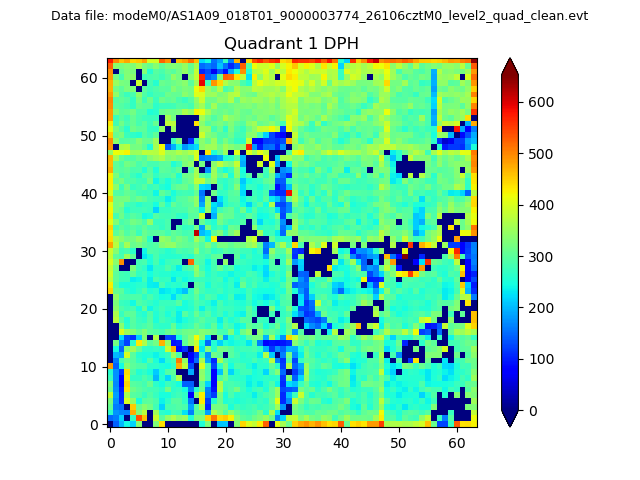 |
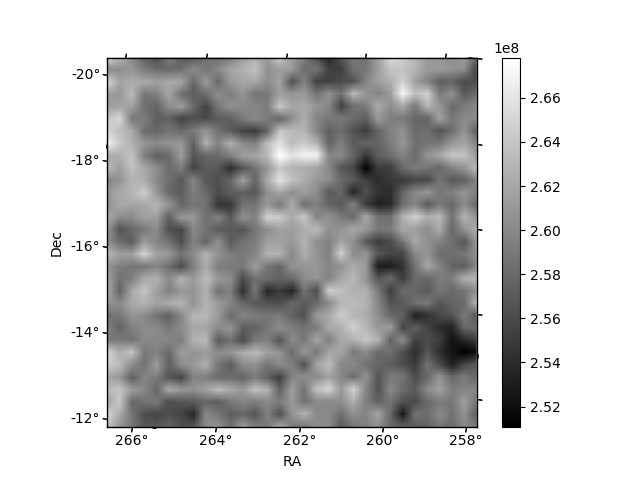
Quadrant B |
|---|---|---|---|
| Quadrant D | 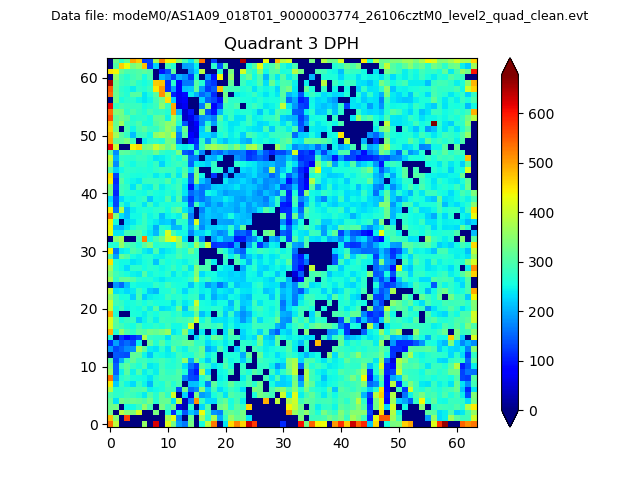 |
 |
Quadrant C |
| Plot type | Count rate plots | Images |
|---|---|---|
| Comparison with Poisson distribution Blue bars denote a histogram of data divided into 1 sec bins. Red curve is a Poisson curve with rate = median count rate of data. |
 |
 |
| Quadrant-wise count rates Data is divided into 100 sec bins |
 |
|
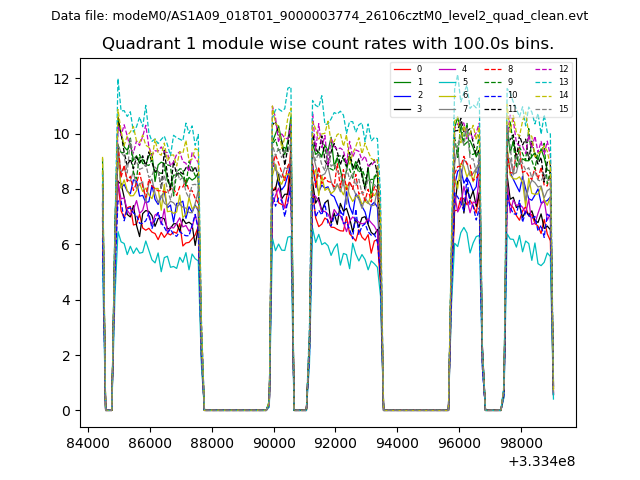
| Module-wise count rates for Quadrant A Data is divided into 100 sec bins |
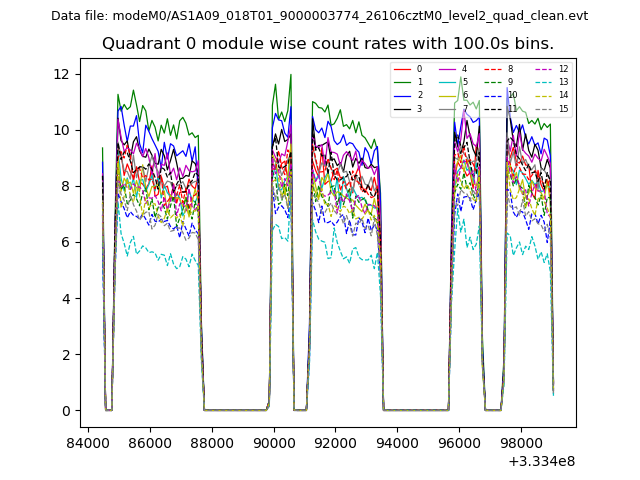 |
 |
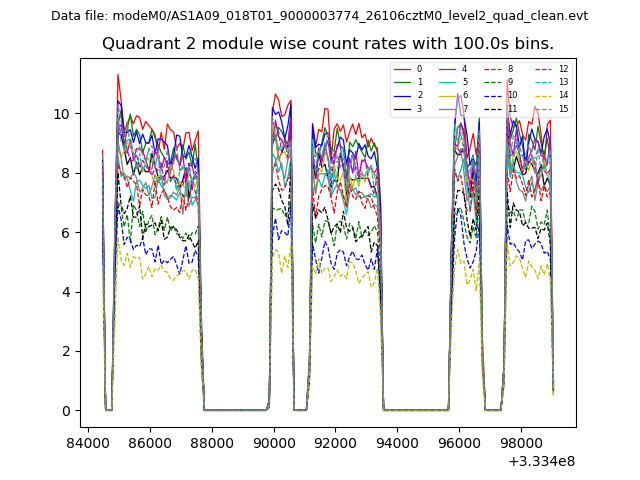
| Module-wise count rates for Quadrant B Data is divided into 100 sec bins |
 |
 |
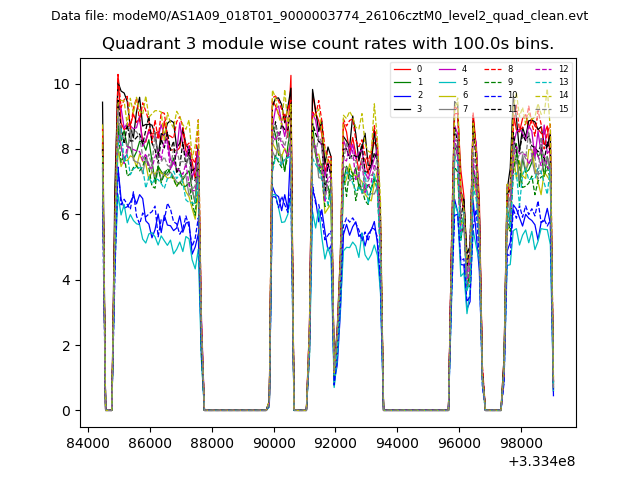
| Module-wise count rates for Quadrant C Data is divided into 100 sec bins |
 |
 |
| Module-wise count rates for Quadrant D Data is divided into 100 sec bins |
 |
 |
| Parameter | Plot |
|---|---|
| CZT HV Monitor | 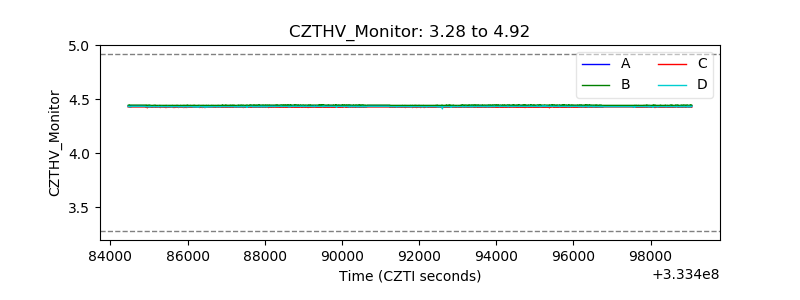 |
| D_VDD | 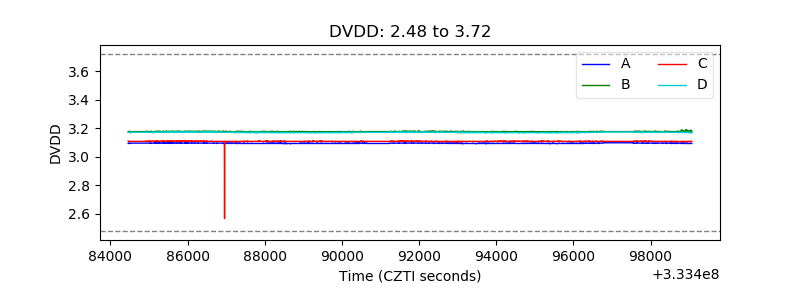 |
| Temperature 1 |  |
| Veto HV Monitor | 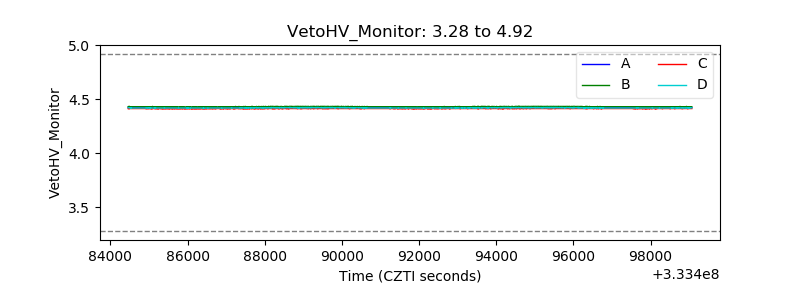 |
| Veto LLD | 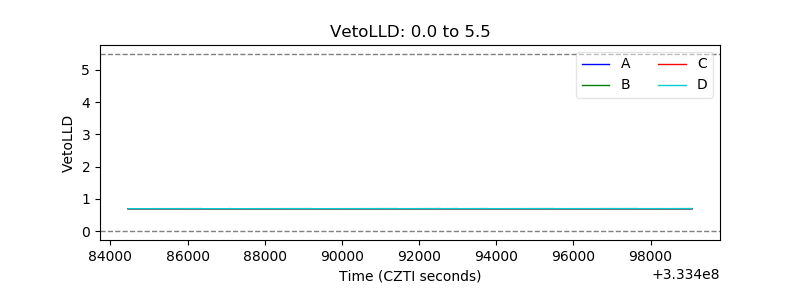 |
| Alpha Counter |  |
| _CPM_Rate | 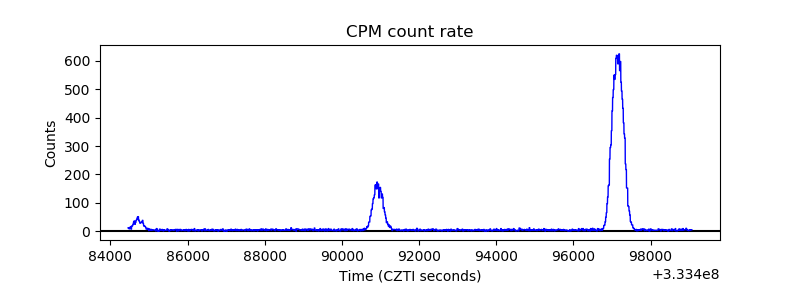 |
| CZT Counter | 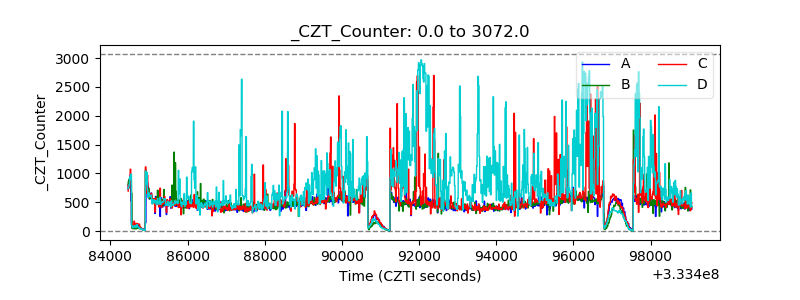 |
| +2.5 Volts monitor |  |
| +5 Volts monitor |  |
| _ROLL_ROT | 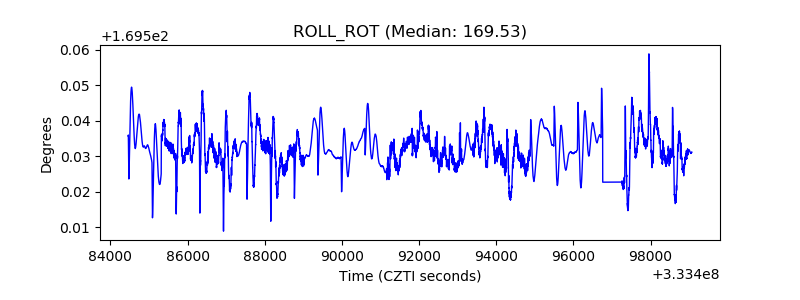 |
| _Roll_DEC | 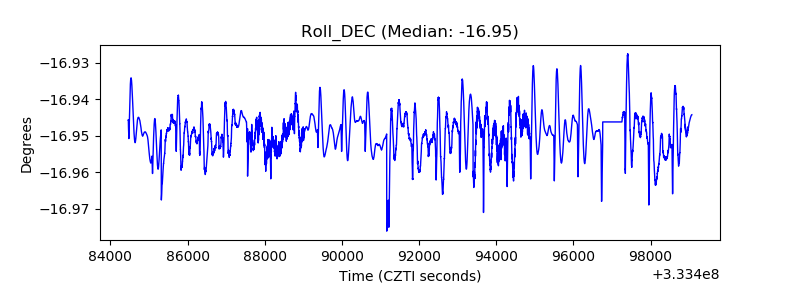 |
| _Roll_RA |  |
| Veto Counter | 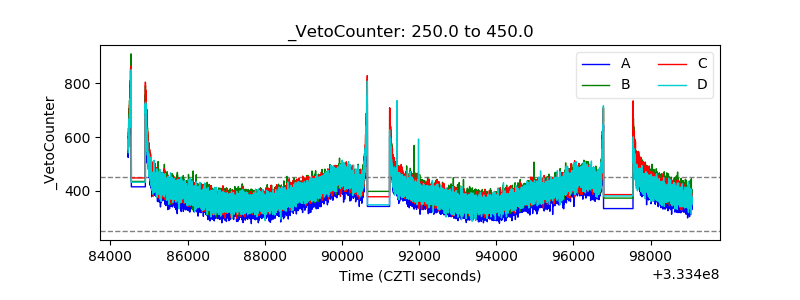 |