| Param | Original file | Final file |
|---|---|---|
| Filename | modeM0/AS1A09_018T01_9000003774_26107cztM0_level2.evt | modeM0/AS1A09_018T01_9000003774_26107cztM0_level2_quad_clean.evt |
| Size (bytes) | 535,826,880 | 91,140,480 |
| Size | 511.0 MB | 86.9 MB |
| Events in quadrant A | 3,157,277 | 599,052 |
| Events in quadrant B | 3,316,842 | 608,505 |
| Events in quadrant C | 3,580,138 | 569,128 |
| Events in quadrant D | 5,720,054 | 517,325 |
| Mode M0 | |||
|---|---|---|---|
| Quadrant | BADHDUFLAG | Total packets | Discarded packets |
| A | 0 | 13601 | 0 |
| B | 0 | 14017 | 0 |
| C | 0 | 14885 | 0 |
| D | 0 | 21442 | 0 |
| Mode M9 | |||
|---|---|---|---|
| Quadrant | BADHDUFLAG | Total packets | Discarded packets |
| A | 0 | 9 | 0 |
| B | 0 | 9 | 0 |
| C | 0 | 9 | 0 |
| D | 0 | 9 | 0 |
| Quadrant | Total seconds | Saturated seconds | Saturation percentage |
|---|---|---|---|
| A | 6679 | 24 | 0.359335% |
| B | 6678 | 43 | 0.643905% |
| C | 6678 | 114 | 1.707098% |
| D | 6678 | 698 | 10.452231% |
Noise dominated data is calculated using 1-second bins in cleaned event files. If a bin has >2000 counts, and if more than 50% of those come from <1% of pixels, then it is considered to be noise-dominated and hence unusable.
| Quadrant | # 1 sec bins | Bins with >0 counts | Bins with >2000 counts | High rate bins dominated by noise | Noise dominated (total time) | Noise dominated (detector-on time) | Marked lightcurve |
|---|---|---|---|---|---|---|---|
| A | 7629 | 6680 | 1 | 1 | 0.01% | 0.01% | 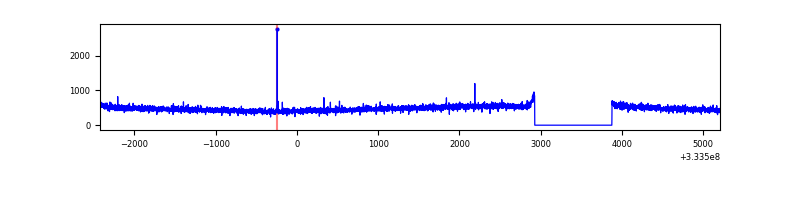 |
| B | 7628 | 6678 | 4 | 4 | 0.05% | 0.06% | 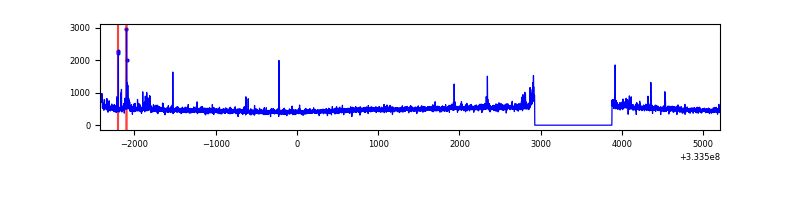 |
| C | 7628 | 6678 | 43 | 43 | 0.56% | 0.64% | 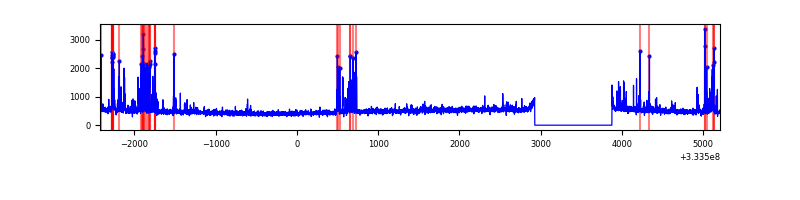 |
| D | 7628 | 6678 | 646 | 646 | 8.47% | 9.67% | 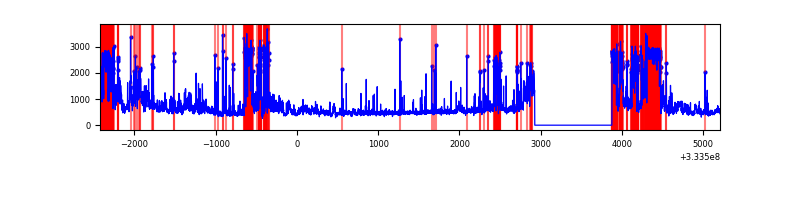 |
Top three noisy pixels from each quadrant. If the there are fewer than three noisy pixels in the level2.evt file, extra rows are filled as -1
| Pixel properties | Quadrant properties | ||||||
|---|---|---|---|---|---|---|---|
| Quadrant | DetID | PixID | Counts | Sigma | Mean | Median | Sigma |
| A | 13 | 254 | 11061 | 61.87 | 818 | 801 | 165.8 |
| A | 3 | 137 | 7656 | 41.34 | 818 | 801 | 165.8 |
| A | 0 | 226 | 6967 | 37.18 | 818 | 801 | 165.8 |
| B | 0 | 190 | 53134 | 334.61 | 814 | 794 | 156.4 |
| B | 5 | 172 | 35048 | 218.99 | 814 | 794 | 156.4 |
| B | 3 | 64 | 22910 | 141.39 | 814 | 794 | 156.4 |
| C | 2 | 16 | 381845 | 2083.9 | 774 | 779 | 182.9 |
| C | 14 | 238 | 124662 | 677.47 | 774 | 779 | 182.9 |
| C | 3 | 233 | 39937 | 214.14 | 774 | 779 | 182.9 |
| D | 1 | 52 | 2678697 | 15002.07 | 742 | 723 | 178.5 |
| D | 12 | 233 | 155098 | 864.81 | 742 | 723 | 178.5 |
| D | 7 | 223 | 33375 | 182.92 | 742 | 723 | 178.5 |
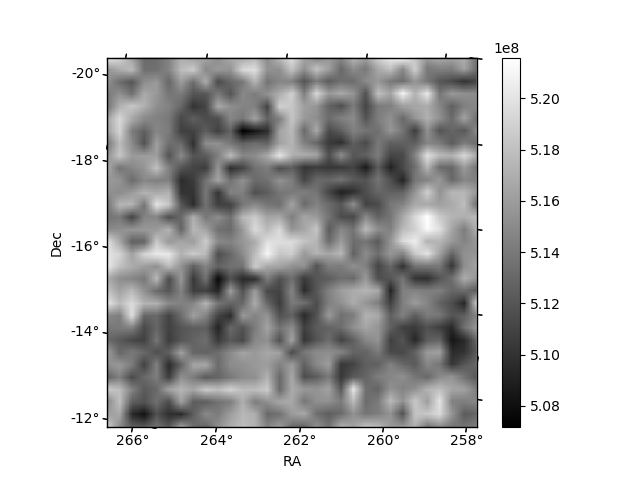
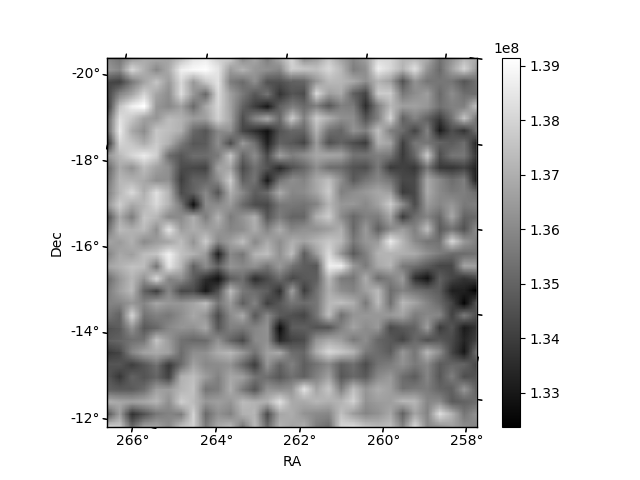
Histogram calculated using DETX and DETY for each event in the final _common_clean file
| Quadrant A | 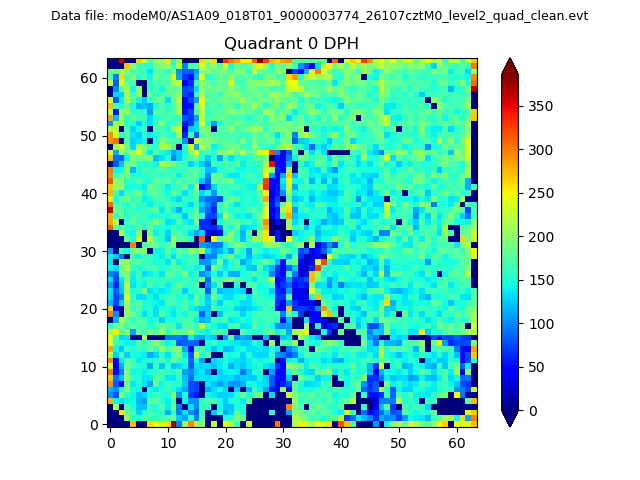 |
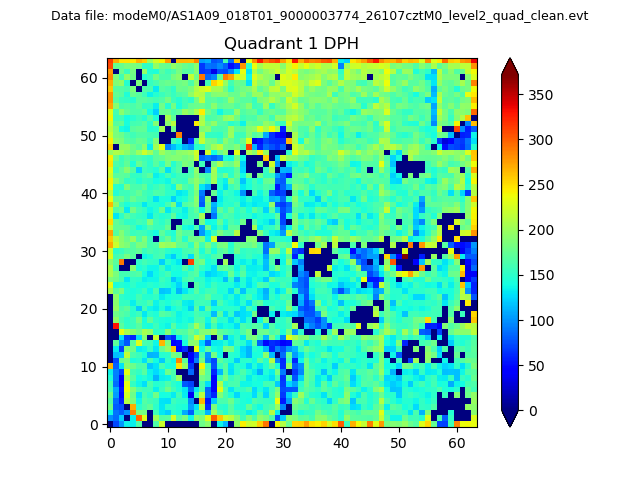 |
Quadrant B |
|---|---|---|---|
| Quadrant D |  |
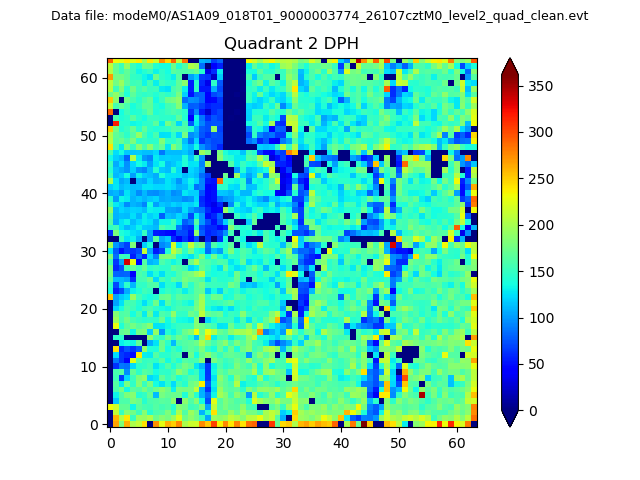 |
Quadrant C |
| Plot type | Count rate plots | Images |
|---|---|---|
| Comparison with Poisson distribution Blue bars denote a histogram of data divided into 1 sec bins. Red curve is a Poisson curve with rate = median count rate of data. |
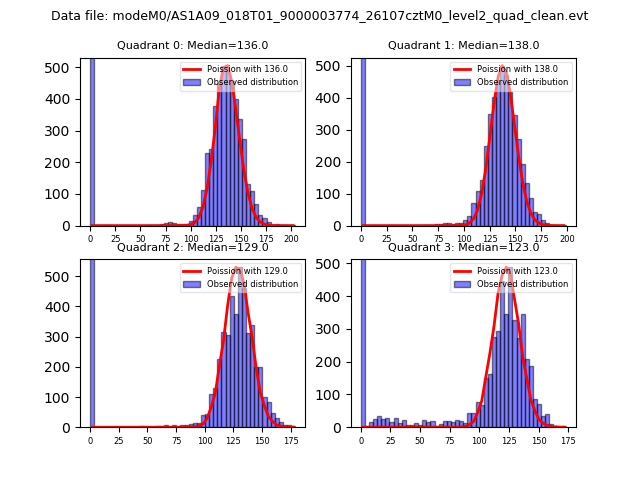 |
 |
| Quadrant-wise count rates Data is divided into 100 sec bins |
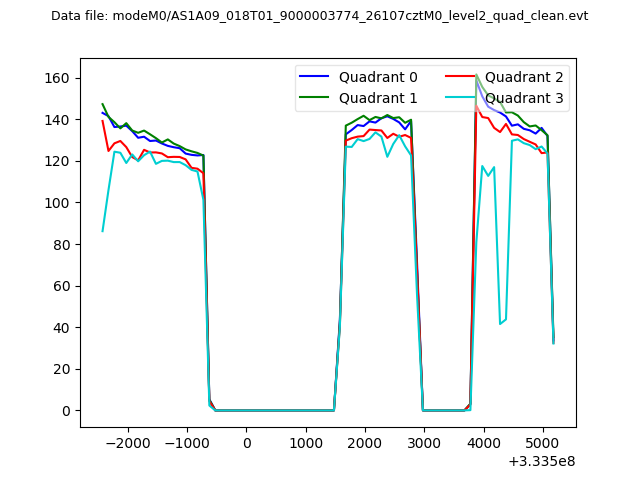 |
|
| Module-wise count rates for Quadrant A Data is divided into 100 sec bins |
 |
 |
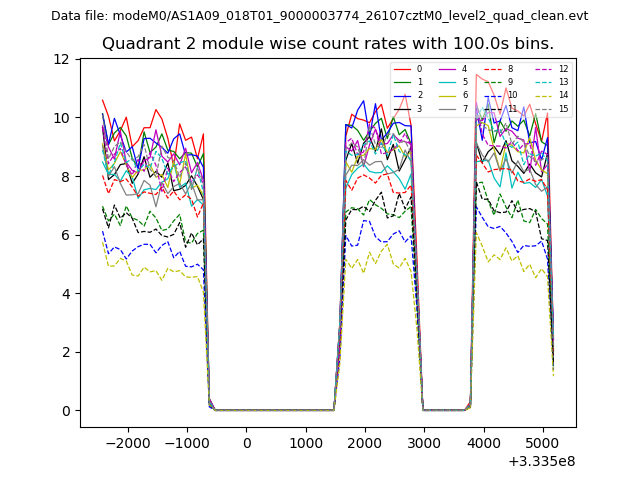
| Module-wise count rates for Quadrant B Data is divided into 100 sec bins |
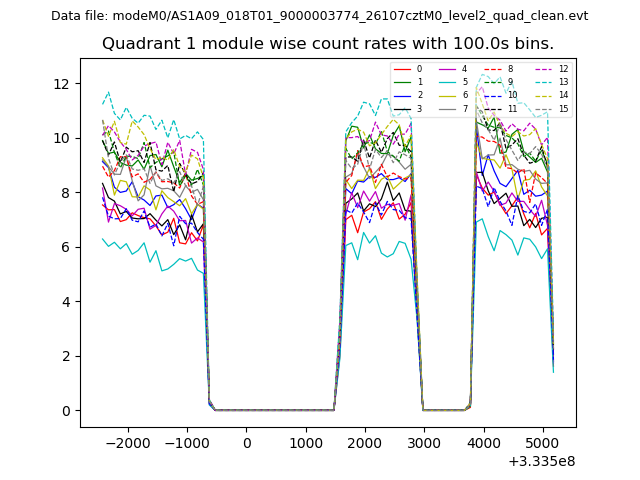 |
 |
| Module-wise count rates for Quadrant C Data is divided into 100 sec bins |
 |
 |
| Module-wise count rates for Quadrant D Data is divided into 100 sec bins |
 |
 |
| Parameter | Plot |
|---|---|
| CZT HV Monitor | 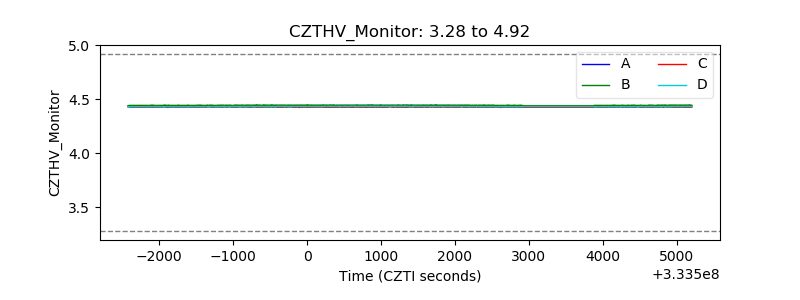 |
| D_VDD | 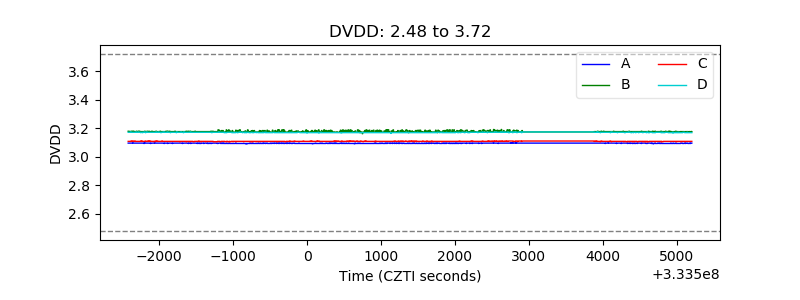 |
| Temperature 1 | 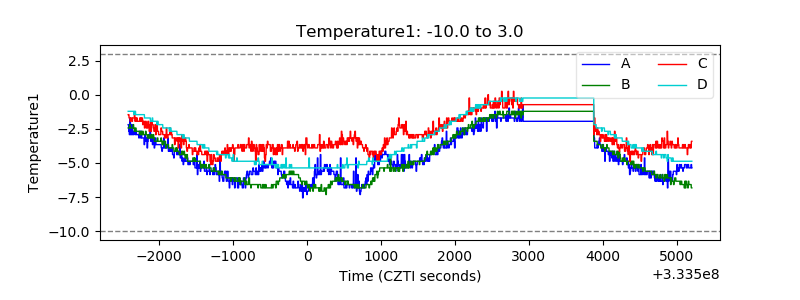 |
| Veto HV Monitor | 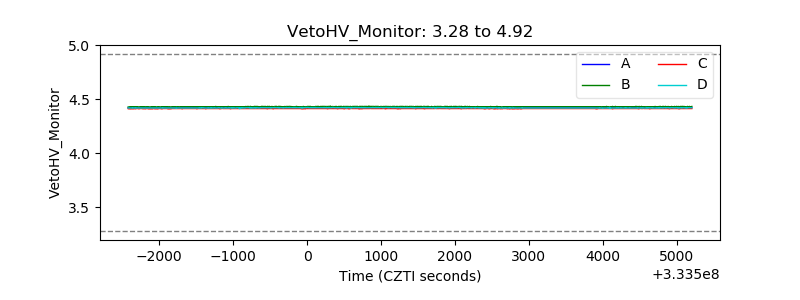 |
| Veto LLD | 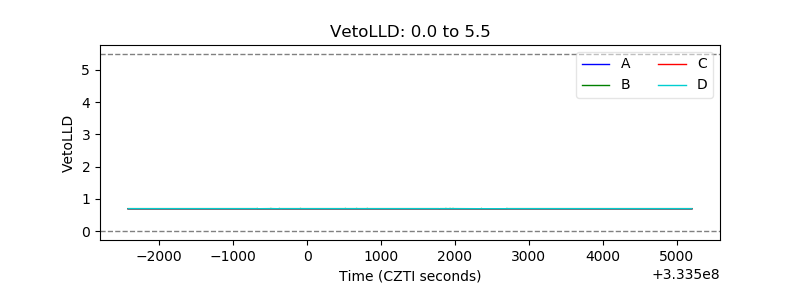 |
| Alpha Counter | 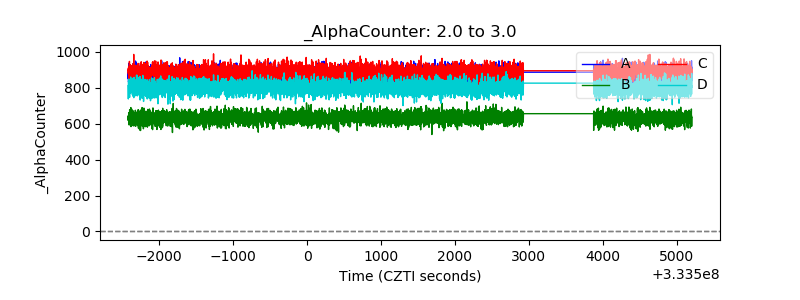 |
| _CPM_Rate | 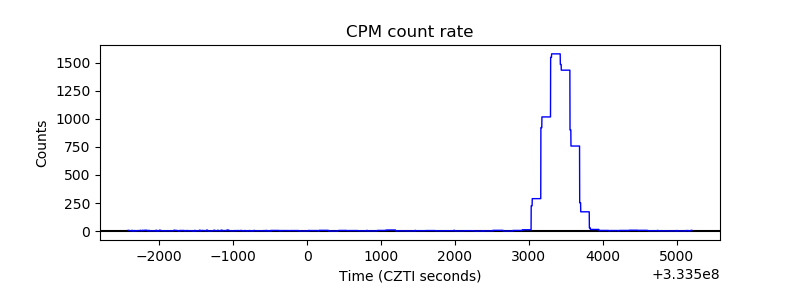 |
| CZT Counter | 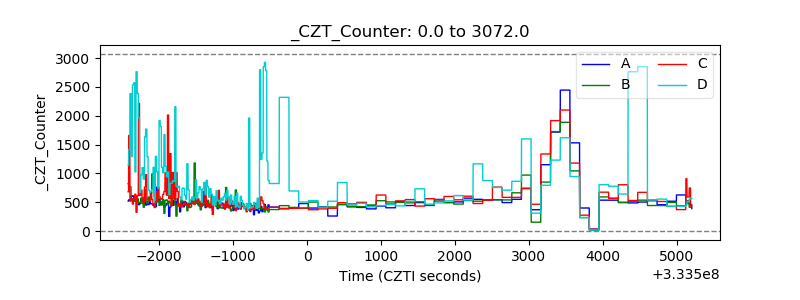 |
| +2.5 Volts monitor | 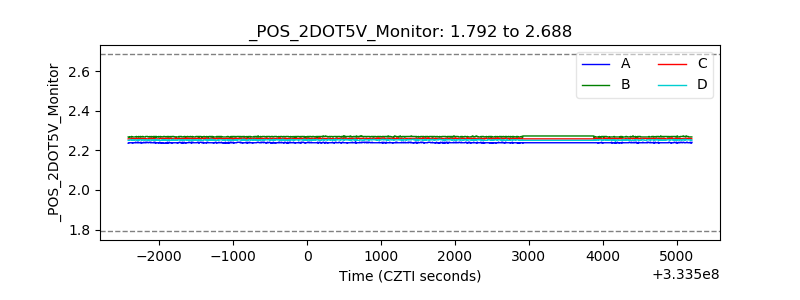 |
| +5 Volts monitor |  |
| _ROLL_ROT |  |
| _Roll_DEC | 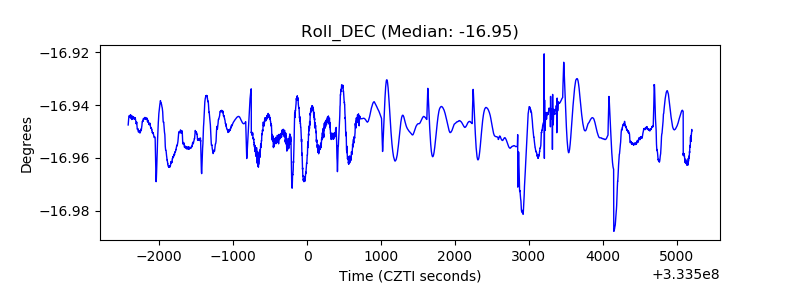 |
| _Roll_RA | 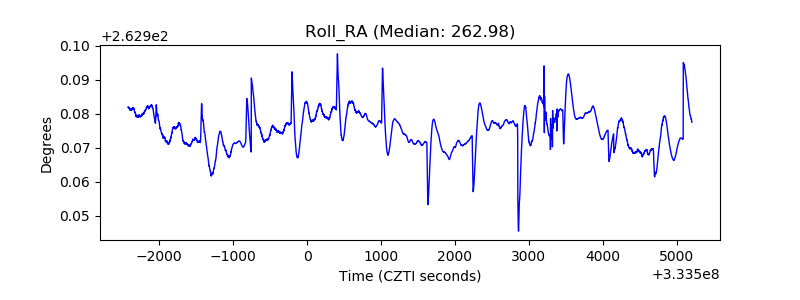 |
| Veto Counter |  |