| Param | Original file | Final file |
|---|---|---|
| Filename | modeM0/AS1A09_018T01_9000003774_26108cztM0_level2.evt | modeM0/AS1A09_018T01_9000003774_26108cztM0_level2_quad_clean.evt |
| Size (bytes) | 530,861,760 | 84,568,320 |
| Size | 506.3 MB | 80.7 MB |
| Events in quadrant A | 3,147,066 | 553,611 |
| Events in quadrant B | 3,341,360 | 562,640 |
| Events in quadrant C | 4,055,088 | 520,128 |
| Events in quadrant D | 5,094,176 | 472,249 |
| Mode M0 | |||
|---|---|---|---|
| Quadrant | BADHDUFLAG | Total packets | Discarded packets |
| A | 0 | 13321 | 0 |
| B | 0 | 13873 | 0 |
| C | 0 | 16086 | 0 |
| D | 0 | 19366 | 0 |
| Mode M9 | |||
|---|---|---|---|
| Quadrant | BADHDUFLAG | Total packets | Discarded packets |
| A | 0 | 15 | 0 |
| B | 0 | 16 | 0 |
| C | 0 | 16 | 0 |
| D | 0 | 16 | 0 |
| Quadrant | Total seconds | Saturated seconds | Saturation percentage |
|---|---|---|---|
| A | 6478 | 19 | 0.293300% |
| B | 6478 | 70 | 1.080580% |
| C | 6478 | 236 | 3.643100% |
| D | 6478 | 574 | 8.860759% |
Noise dominated data is calculated using 1-second bins in cleaned event files. If a bin has >2000 counts, and if more than 50% of those come from <1% of pixels, then it is considered to be noise-dominated and hence unusable.
| Quadrant | # 1 sec bins | Bins with >0 counts | Bins with >2000 counts | High rate bins dominated by noise | Noise dominated (total time) | Noise dominated (detector-on time) | Marked lightcurve |
|---|---|---|---|---|---|---|---|
| A | 7585 | 6480 | 0 | 0 | 0.00% | 0.00% | 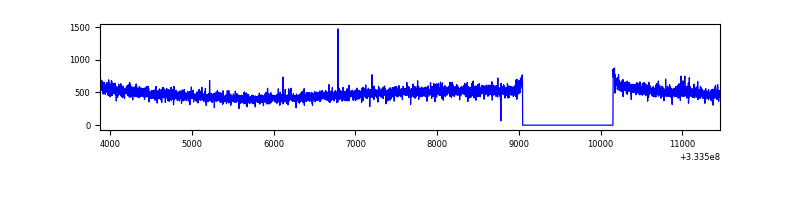 |
| B | 7585 | 6479 | 26 | 26 | 0.34% | 0.40% | 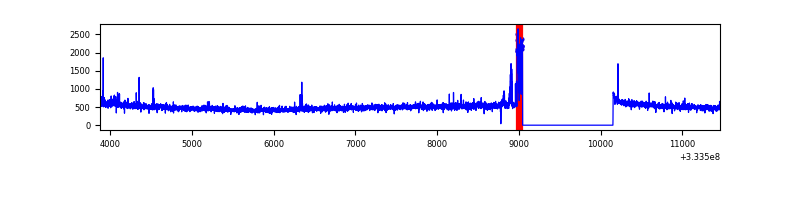 |
| C | 7585 | 6480 | 125 | 125 | 1.65% | 1.93% |  |
| D | 7585 | 6480 | 555 | 555 | 7.32% | 8.56% | 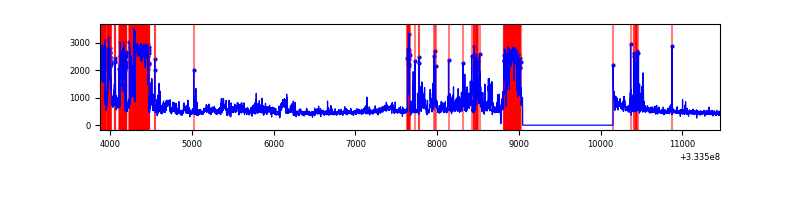 |
Top three noisy pixels from each quadrant. If the there are fewer than three noisy pixels in the level2.evt file, extra rows are filled as -1
| Pixel properties | Quadrant properties | ||||||
|---|---|---|---|---|---|---|---|
| Quadrant | DetID | PixID | Counts | Sigma | Mean | Median | Sigma |
| A | 13 | 254 | 9993 | 56.42 | 814 | 799 | 162.9 |
| A | 0 | 13 | 9244 | 51.83 | 814 | 799 | 162.9 |
| A | 3 | 137 | 7510 | 41.18 | 814 | 799 | 162.9 |
| B | 5 | 172 | 105396 | 679.12 | 808 | 789 | 154.0 |
| B | 0 | 190 | 32697 | 207.15 | 808 | 789 | 154.0 |
| B | 12 | 111 | 18870 | 117.38 | 808 | 789 | 154.0 |
| C | 2 | 16 | 851797 | 4728.5 | 766 | 770 | 180.0 |
| C | 14 | 238 | 123400 | 681.36 | 766 | 770 | 180.0 |
| C | 3 | 233 | 65784 | 361.23 | 766 | 770 | 180.0 |
| D | 1 | 52 | 2104473 | 11791.23 | 741 | 726 | 178.4 |
| D | 14 | 35 | 59181 | 327.63 | 741 | 726 | 178.4 |
| D | 7 | 80 | 53532 | 295.97 | 741 | 726 | 178.4 |
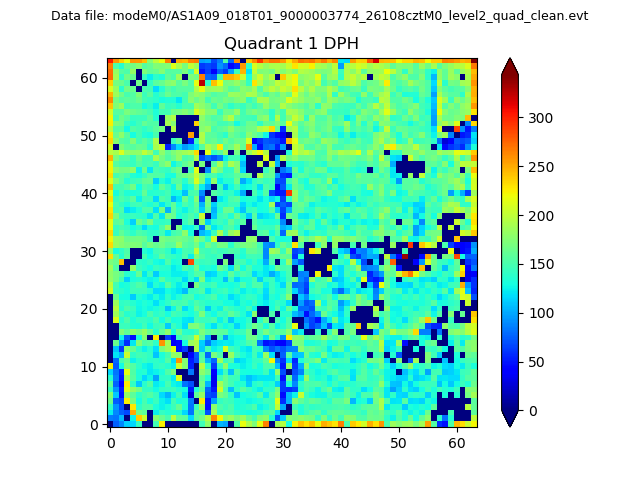
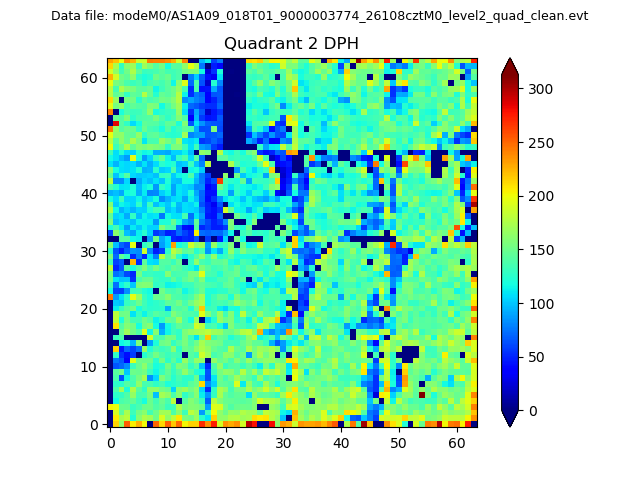
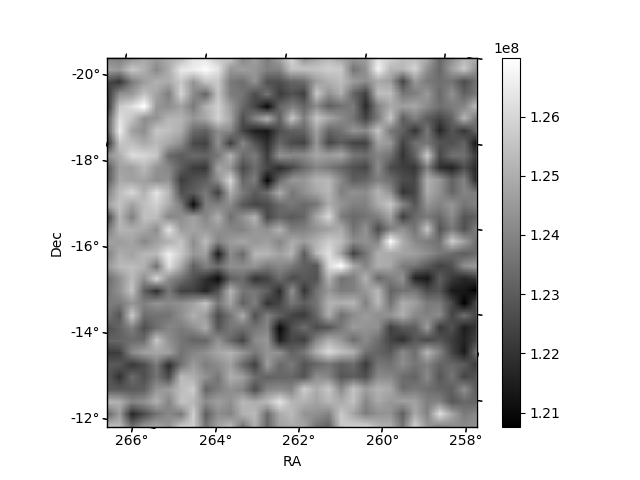
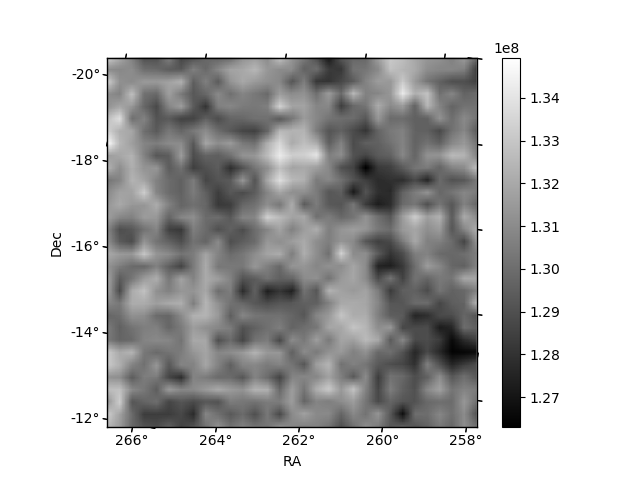
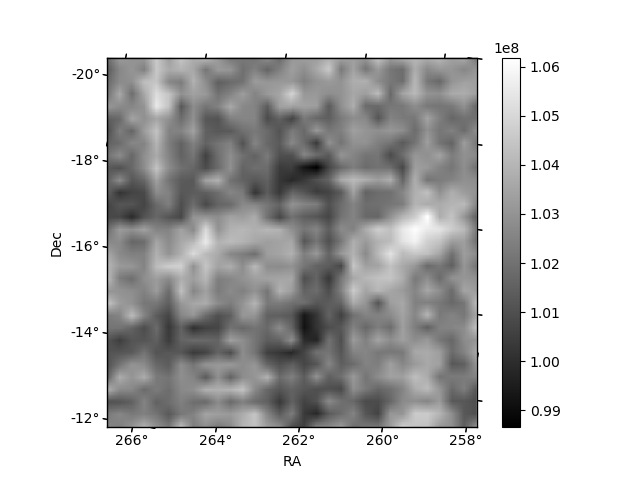
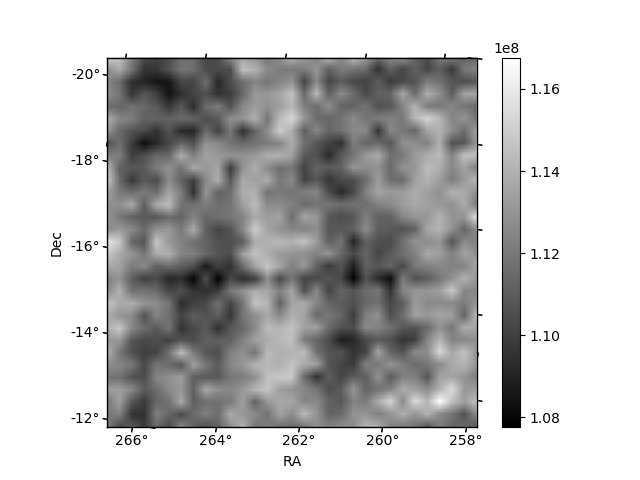
Histogram calculated using DETX and DETY for each event in the final _common_clean file
| Quadrant A |  |
 |
Quadrant B |
|---|---|---|---|
| Quadrant D |  |
 |
Quadrant C |
| Plot type | Count rate plots | Images |
|---|---|---|
| Comparison with Poisson distribution Blue bars denote a histogram of data divided into 1 sec bins. Red curve is a Poisson curve with rate = median count rate of data. |
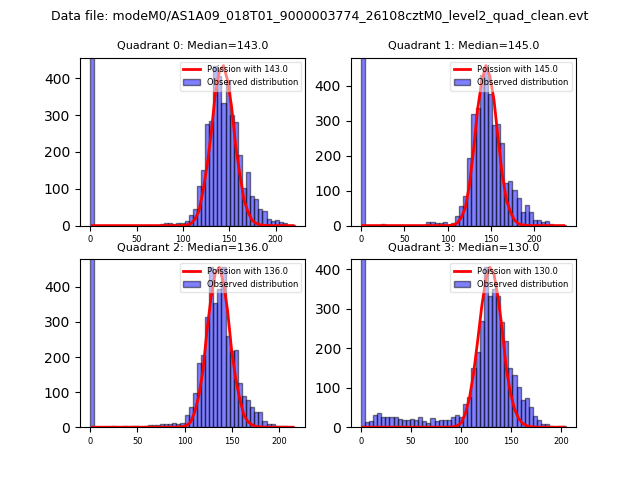 |
 |
| Quadrant-wise count rates Data is divided into 100 sec bins |
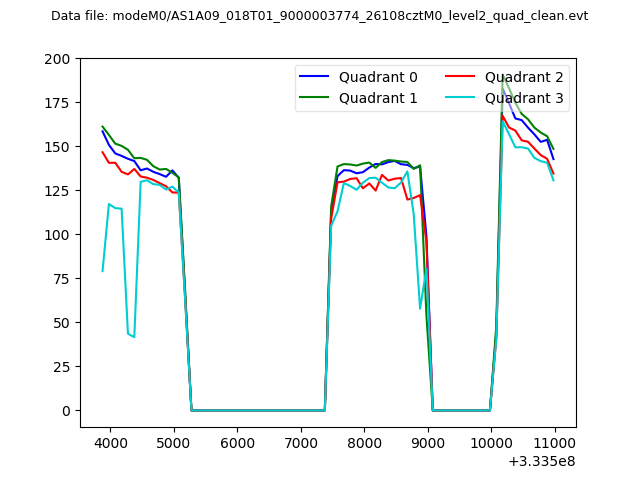 |
|
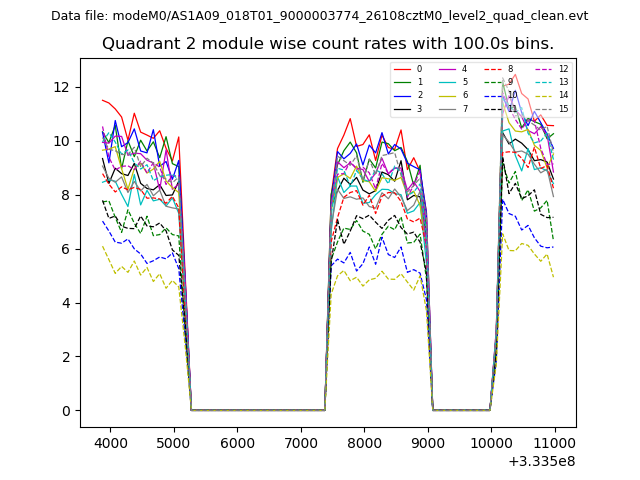
| Module-wise count rates for Quadrant A Data is divided into 100 sec bins |
 |
 |
| Module-wise count rates for Quadrant B Data is divided into 100 sec bins |
 |
 |
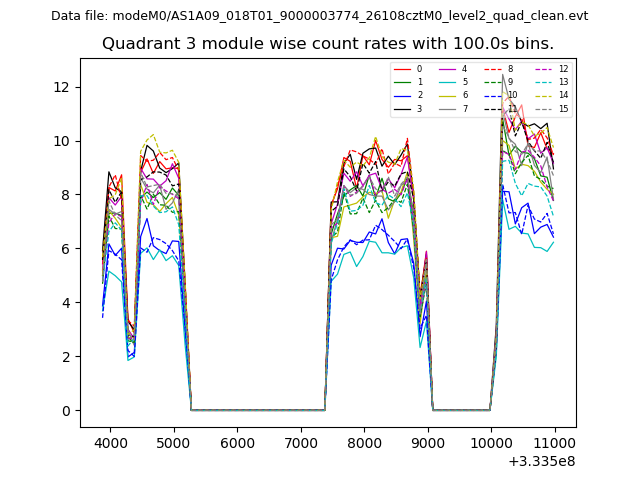
| Module-wise count rates for Quadrant C Data is divided into 100 sec bins |
 |
 |
| Module-wise count rates for Quadrant D Data is divided into 100 sec bins |
 |
 |
| Parameter | Plot |
|---|---|
| CZT HV Monitor |  |
| D_VDD | 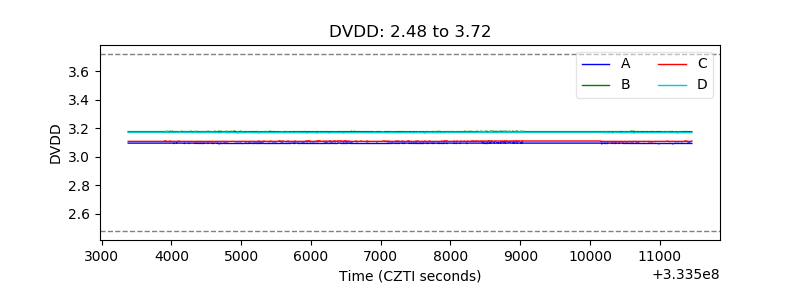 |
| Temperature 1 | 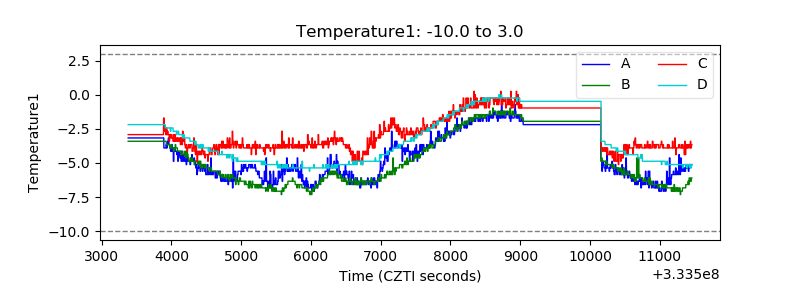 |
| Veto HV Monitor | 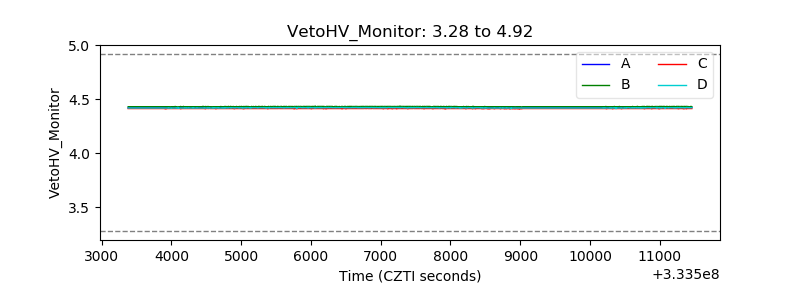 |
| Veto LLD | 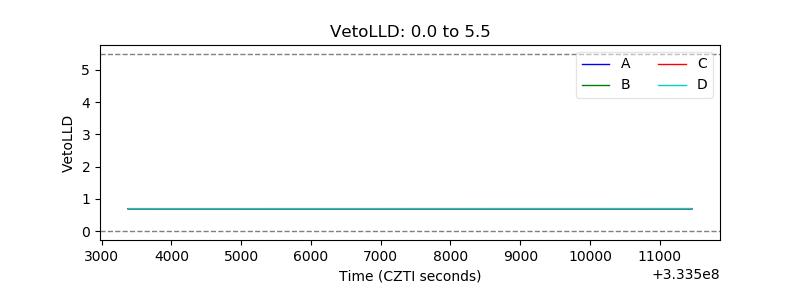 |
| Alpha Counter | 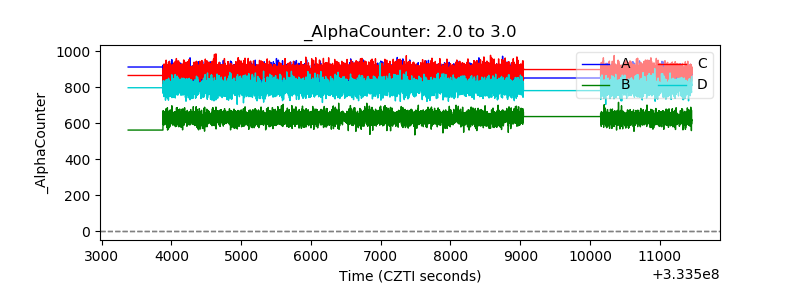 |
| _CPM_Rate | 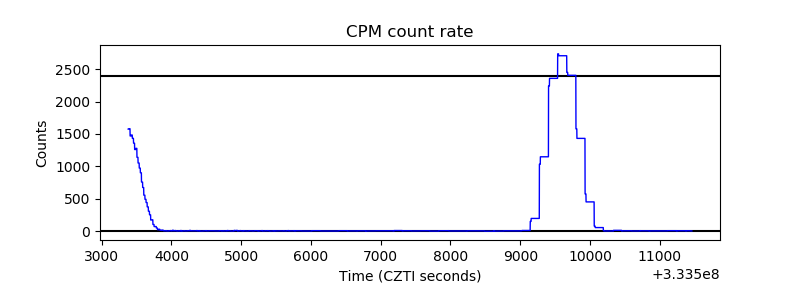 |
| CZT Counter | 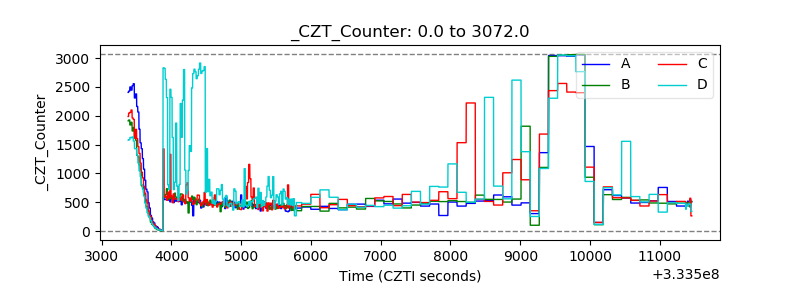 |
| +2.5 Volts monitor |  |
| +5 Volts monitor | 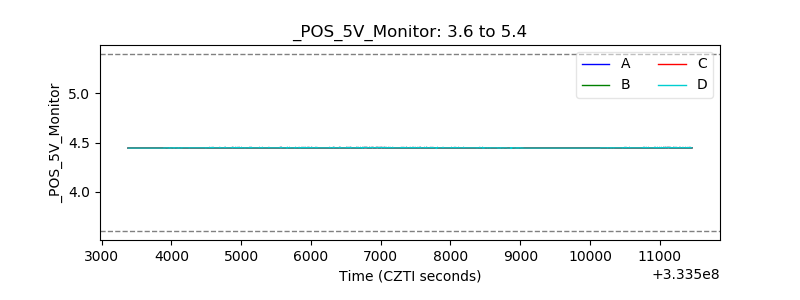 |
| _ROLL_ROT | 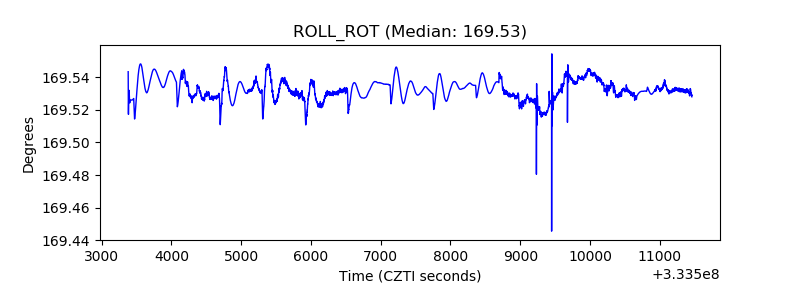 |
| _Roll_DEC | 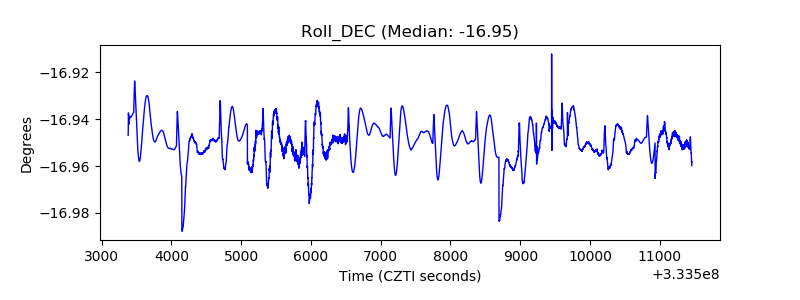 |
| _Roll_RA | 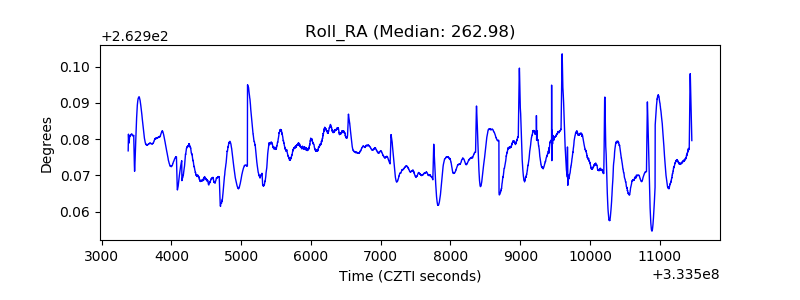 |
| Veto Counter | 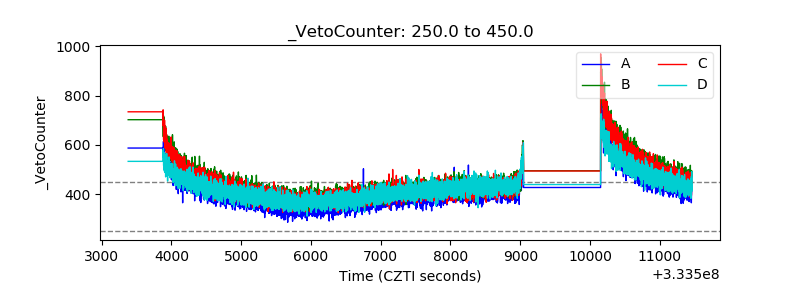 |