| Param | Original file | Final file |
|---|---|---|
| Filename | modeM0/AS1A09_018T01_9000003774_26110cztM0_level2.evt | modeM0/AS1A09_018T01_9000003774_26110cztM0_level2_quad_clean.evt |
| Size (bytes) | 498,732,480 | 81,152,640 |
| Size | 475.6 MB | 77.4 MB |
| Events in quadrant A | 3,274,838 | 520,046 |
| Events in quadrant B | 3,484,691 | 529,458 |
| Events in quadrant C | 3,593,796 | 492,150 |
| Events in quadrant D | 4,316,696 | 469,241 |
| Mode M0 | |||
|---|---|---|---|
| Quadrant | BADHDUFLAG | Total packets | Discarded packets |
| A | 0 | 13488 | 0 |
| B | 0 | 14192 | 0 |
| C | 0 | 14556 | 0 |
| D | 0 | 17034 | 0 |
| Mode M9 | |||
|---|---|---|---|
| Quadrant | BADHDUFLAG | Total packets | Discarded packets |
| A | 0 | 23 | 0 |
| B | 0 | 23 | 0 |
| C | 0 | 23 | 0 |
| D | 0 | 23 | 0 |
| Quadrant | Total seconds | Saturated seconds | Saturation percentage |
|---|---|---|---|
| A | 6392 | 16 | 0.250313% |
| B | 6393 | 89 | 1.392148% |
| C | 6393 | 94 | 1.470358% |
| D | 6393 | 226 | 3.535117% |
Noise dominated data is calculated using 1-second bins in cleaned event files. If a bin has >2000 counts, and if more than 50% of those come from <1% of pixels, then it is considered to be noise-dominated and hence unusable.
| Quadrant | # 1 sec bins | Bins with >0 counts | Bins with >2000 counts | High rate bins dominated by noise | Noise dominated (total time) | Noise dominated (detector-on time) | Marked lightcurve |
|---|---|---|---|---|---|---|---|
| A | 8728 | 6394 | 0 | 0 | 0.00% | 0.00% | 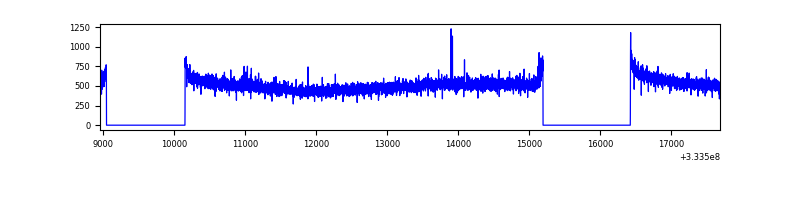 |
| B | 8729 | 6393 | 33 | 33 | 0.38% | 0.52% | 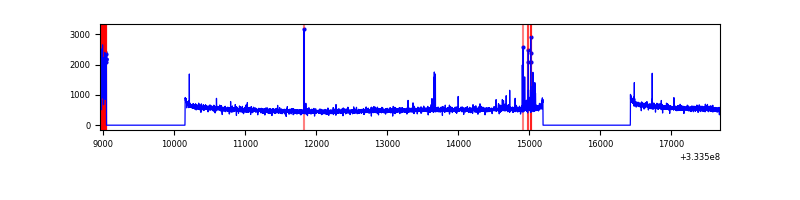 |
| C | 8729 | 6395 | 21 | 21 | 0.24% | 0.33% | 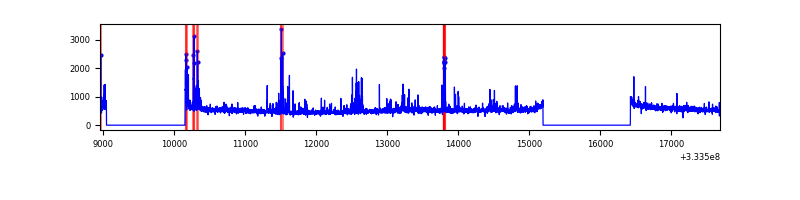 |
| D | 8729 | 6395 | 195 | 195 | 2.23% | 3.05% | 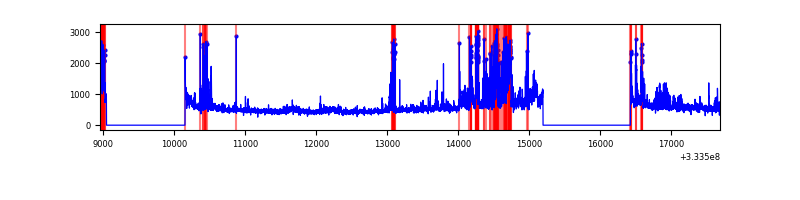 |
Top three noisy pixels from each quadrant. If the there are fewer than three noisy pixels in the level2.evt file, extra rows are filled as -1
| Pixel properties | Quadrant properties | ||||||
|---|---|---|---|---|---|---|---|
| Quadrant | DetID | PixID | Counts | Sigma | Mean | Median | Sigma |
| A | 0 | 13 | 10067 | 54.82 | 848 | 833 | 168.4 |
| A | 13 | 254 | 9725 | 52.79 | 848 | 833 | 168.4 |
| A | 3 | 137 | 7574 | 40.02 | 848 | 833 | 168.4 |
| B | 5 | 172 | 139503 | 867.65 | 843 | 824 | 159.8 |
| B | 12 | 111 | 19032 | 113.92 | 843 | 824 | 159.8 |
| B | 11 | 111 | 17157 | 102.19 | 843 | 824 | 159.8 |
| C | 2 | 16 | 247708 | 1324.21 | 801 | 807 | 186.5 |
| C | 14 | 238 | 130554 | 695.88 | 801 | 807 | 186.5 |
| C | 13 | 250 | 53377 | 281.95 | 801 | 807 | 186.5 |
| D | 1 | 52 | 1180433 | 6178.22 | 795 | 779 | 190.9 |
| D | 12 | 233 | 34679 | 177.55 | 795 | 779 | 190.9 |
| D | 1 | 3 | 32729 | 167.33 | 795 | 779 | 190.9 |
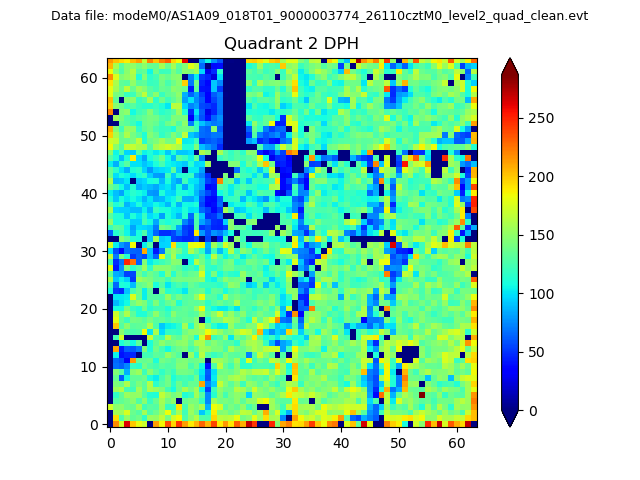
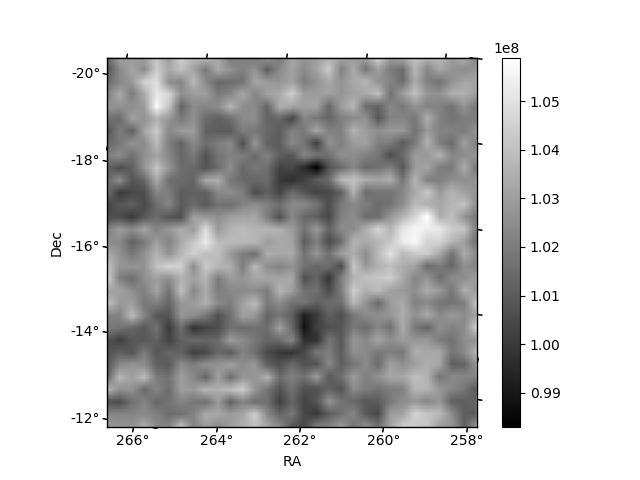
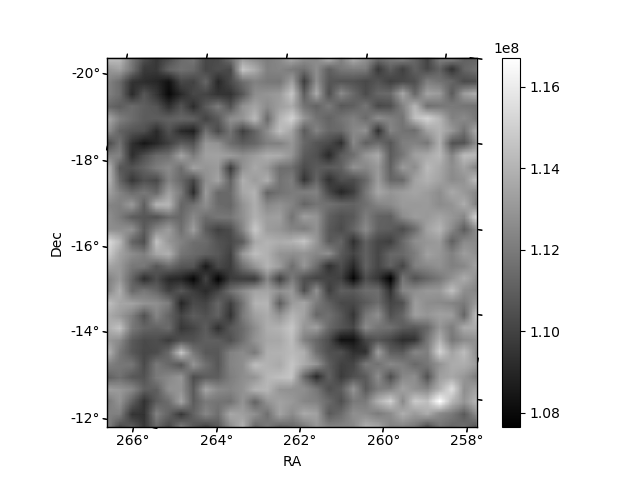
Histogram calculated using DETX and DETY for each event in the final _common_clean file
| Quadrant A |  |
 |
Quadrant B |
|---|---|---|---|
| Quadrant D |  |
 |
Quadrant C |
| Plot type | Count rate plots | Images |
|---|---|---|
| Comparison with Poisson distribution Blue bars denote a histogram of data divided into 1 sec bins. Red curve is a Poisson curve with rate = median count rate of data. |
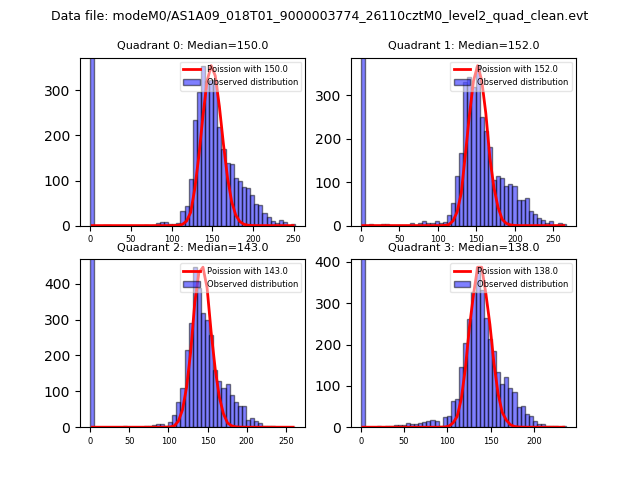 |
 |
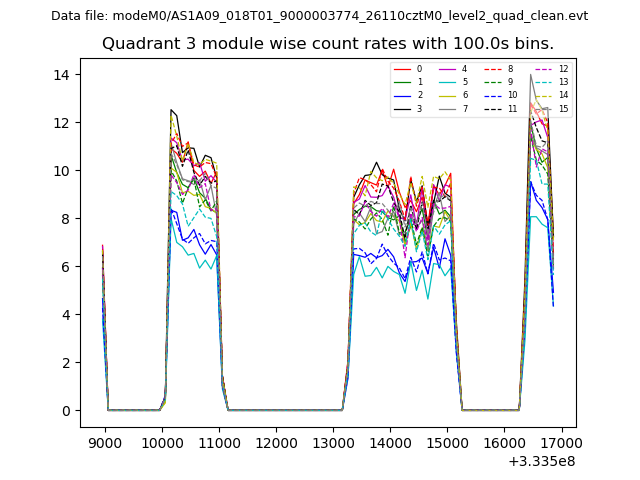
| Quadrant-wise count rates Data is divided into 100 sec bins |
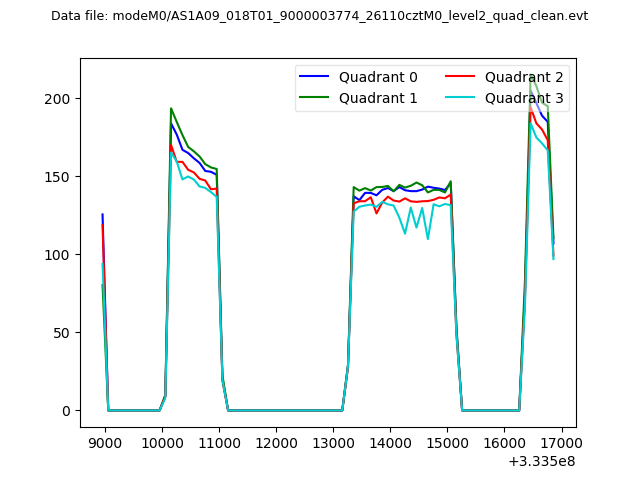 |
|
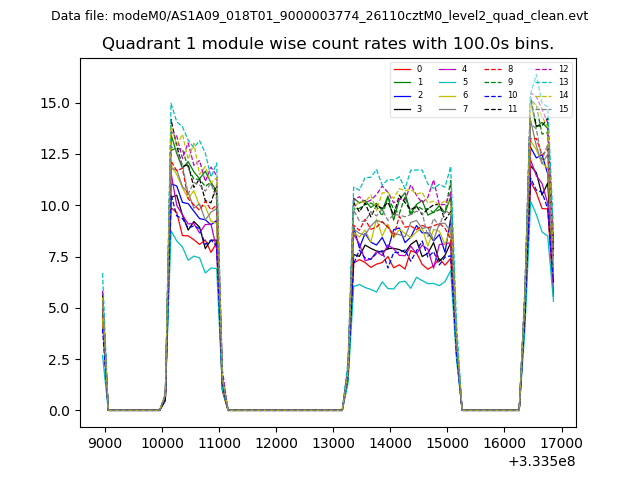
| Module-wise count rates for Quadrant A Data is divided into 100 sec bins |
 |
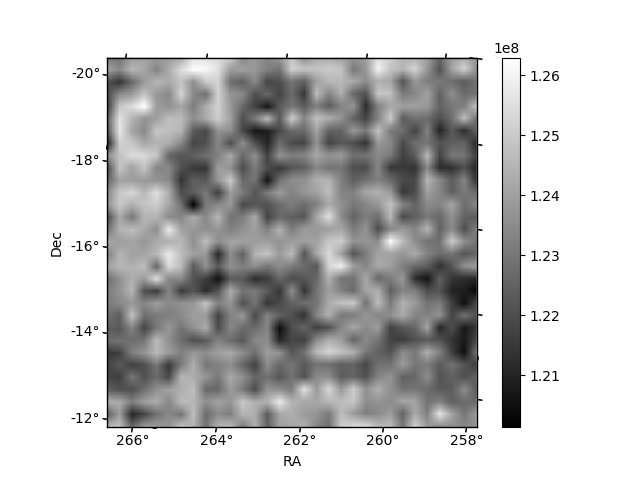 |
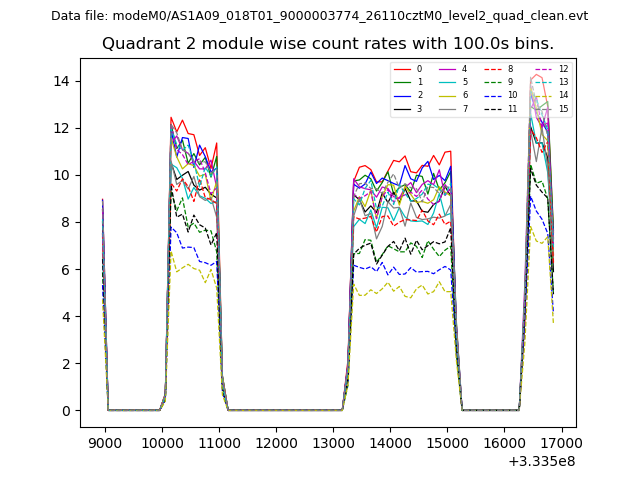
| Module-wise count rates for Quadrant B Data is divided into 100 sec bins |
 |
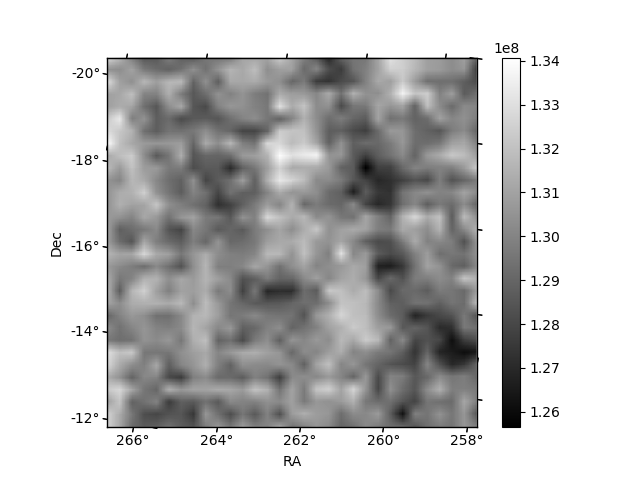 |
| Module-wise count rates for Quadrant C Data is divided into 100 sec bins |
 |
 |
| Module-wise count rates for Quadrant D Data is divided into 100 sec bins |
 |
 |
| Parameter | Plot |
|---|---|
| CZT HV Monitor | 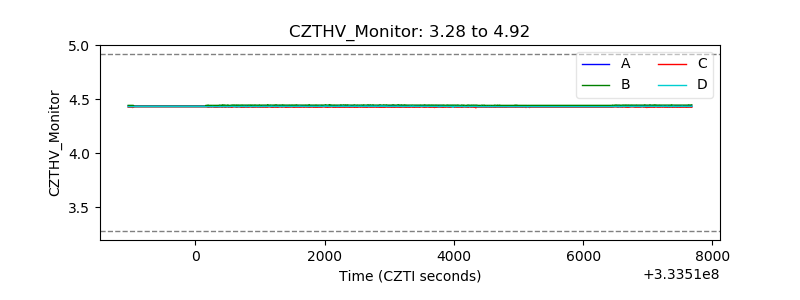 |
| D_VDD | 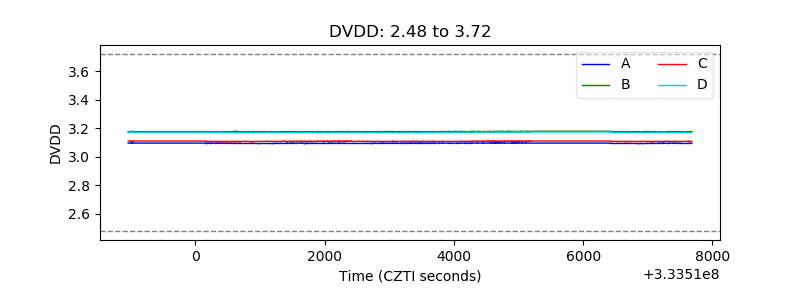 |
| Temperature 1 | 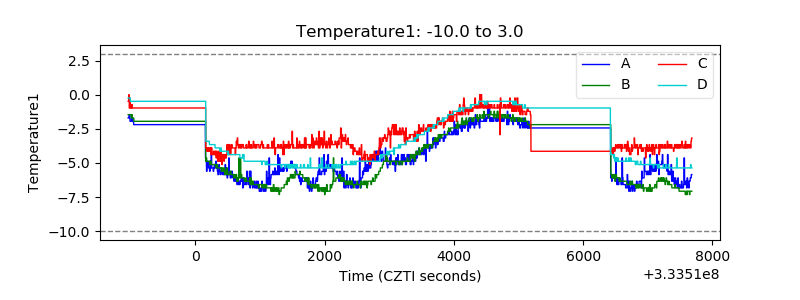 |
| Veto HV Monitor | 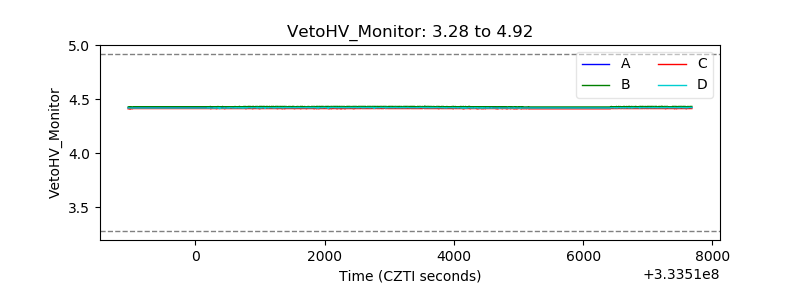 |
| Veto LLD | 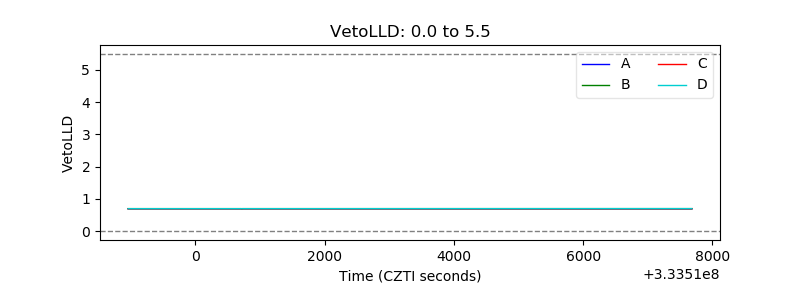 |
| Alpha Counter | 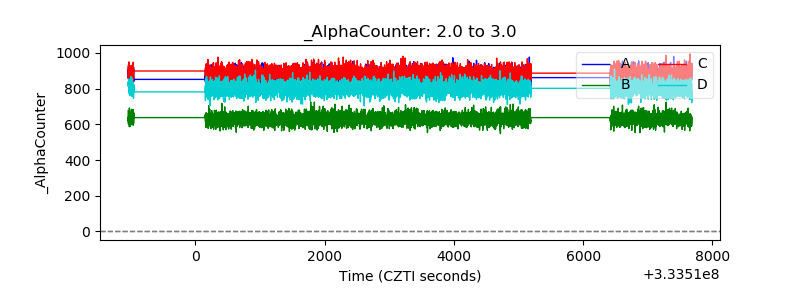 |
| _CPM_Rate | 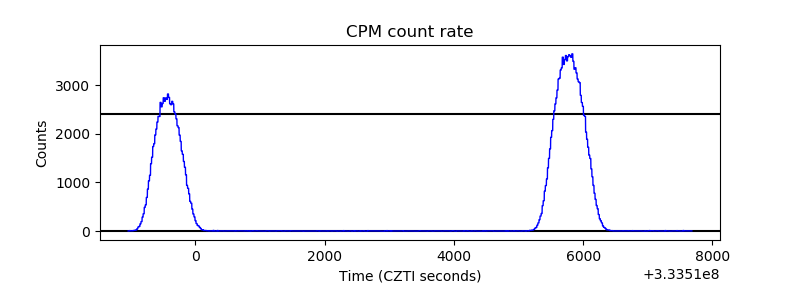 |
| CZT Counter | 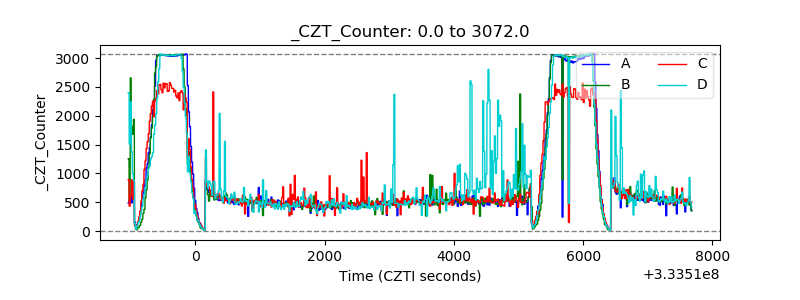 |
| +2.5 Volts monitor |  |
| +5 Volts monitor | 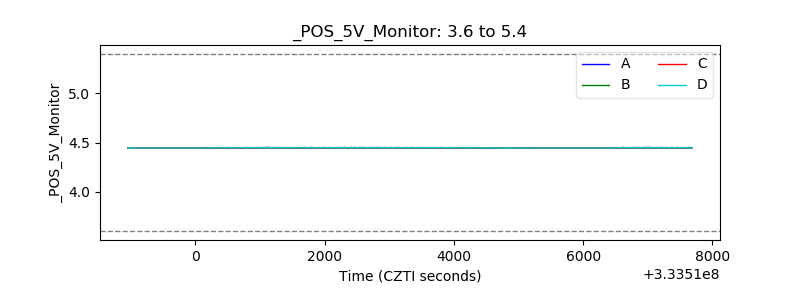 |
| _ROLL_ROT | 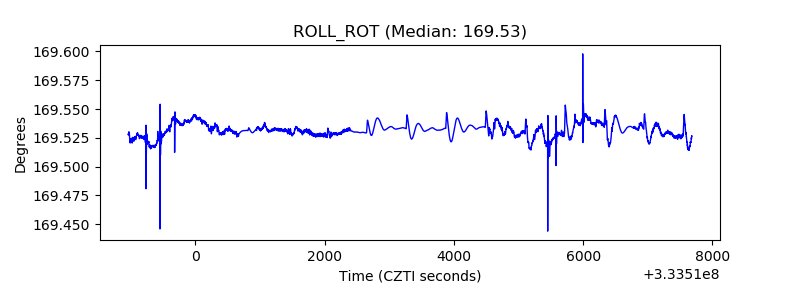 |
| _Roll_DEC | 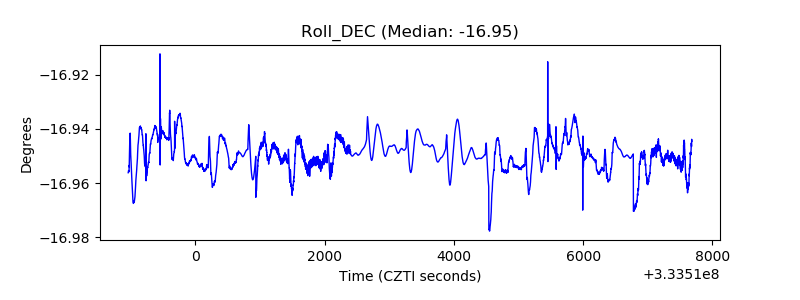 |
| _Roll_RA | 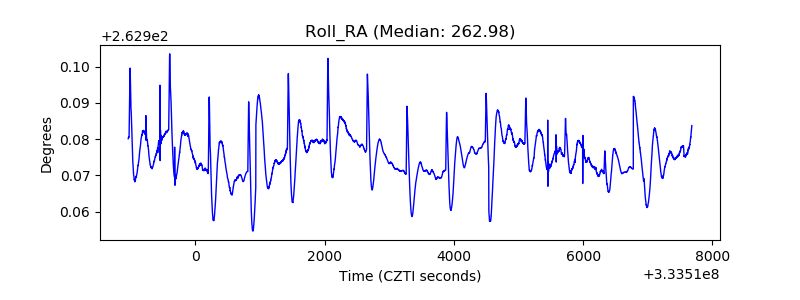 |
| Veto Counter | 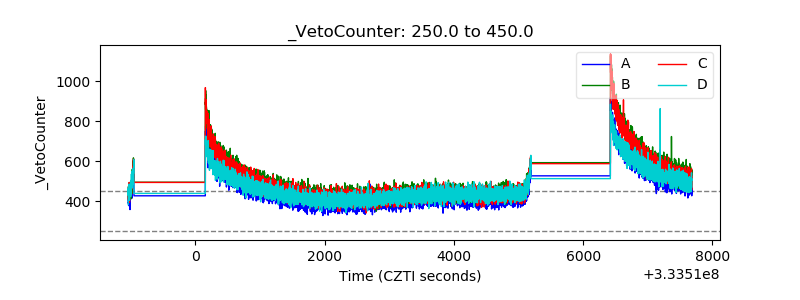 |