| Param | Original file | Final file |
|---|---|---|
| Filename | modeM0/AS1A09_018T01_9000003774_26111cztM0_level2.evt | modeM0/AS1A09_018T01_9000003774_26111cztM0_level2_quad_clean.evt |
| Size (bytes) | 509,137,920 | 70,493,760 |
| Size | 485.6 MB | 67.2 MB |
| Events in quadrant A | 3,427,152 | 434,676 |
| Events in quadrant B | 3,519,043 | 447,827 |
| Events in quadrant C | 3,493,190 | 412,827 |
| Events in quadrant D | 4,551,708 | 398,215 |
| Mode M0 | |||
|---|---|---|---|
| Quadrant | BADHDUFLAG | Total packets | Discarded packets |
| A | 0 | 13825 | 0 |
| B | 0 | 14222 | 0 |
| C | 0 | 14080 | 0 |
| D | 0 | 17758 | 0 |
| Mode M9 | |||
|---|---|---|---|
| Quadrant | BADHDUFLAG | Total packets | Discarded packets |
| A | 0 | 15 | 0 |
| B | 0 | 16 | 0 |
| C | 0 | 16 | 0 |
| D | 0 | 16 | 0 |
| Quadrant | Total seconds | Saturated seconds | Saturation percentage |
|---|---|---|---|
| A | 6327 | 32 | 0.505769% |
| B | 6327 | 37 | 0.584795% |
| C | 6327 | 71 | 1.122175% |
| D | 6327 | 95 | 1.501502% |
Noise dominated data is calculated using 1-second bins in cleaned event files. If a bin has >2000 counts, and if more than 50% of those come from <1% of pixels, then it is considered to be noise-dominated and hence unusable.
| Quadrant | # 1 sec bins | Bins with >0 counts | Bins with >2000 counts | High rate bins dominated by noise | Noise dominated (total time) | Noise dominated (detector-on time) | Marked lightcurve |
|---|---|---|---|---|---|---|---|
| A | 7652 | 6328 | 2 | 2 | 0.03% | 0.03% | 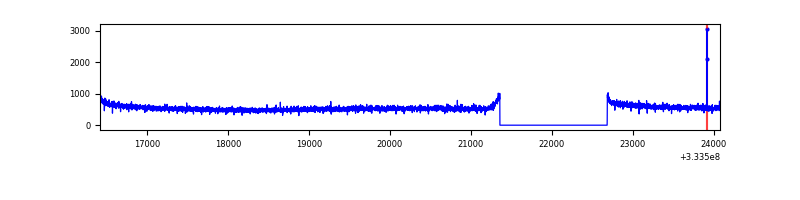 |
| B | 7652 | 6327 | 0 | 0 | 0.00% | 0.00% | 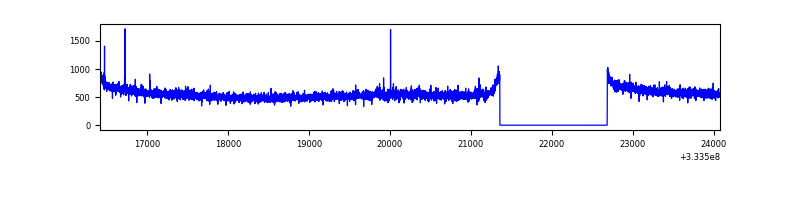 |
| C | 7652 | 6327 | 0 | 0 | 0.00% | 0.00% | 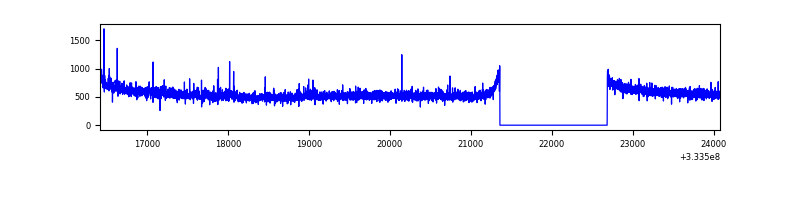 |
| D | 7652 | 6327 | 64 | 64 | 0.84% | 1.01% | 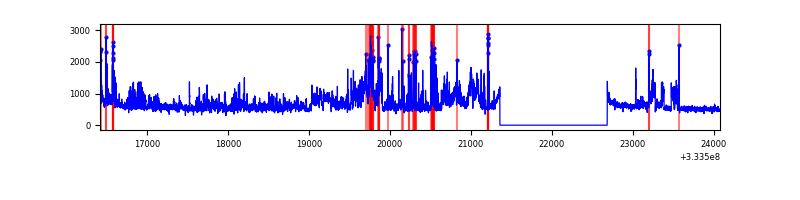 |
Top three noisy pixels from each quadrant. If the there are fewer than three noisy pixels in the level2.evt file, extra rows are filled as -1
| Pixel properties | Quadrant properties | ||||||
|---|---|---|---|---|---|---|---|
| Quadrant | DetID | PixID | Counts | Sigma | Mean | Median | Sigma |
| A | 0 | 13 | 10387 | 54.78 | 888 | 876 | 173.6 |
| A | 13 | 254 | 8666 | 44.86 | 888 | 876 | 173.6 |
| A | 3 | 137 | 7585 | 38.64 | 888 | 876 | 173.6 |
| B | 0 | 229 | 22503 | 130.49 | 889 | 872 | 165.8 |
| B | 12 | 111 | 19408 | 111.82 | 889 | 872 | 165.8 |
| B | 11 | 111 | 17534 | 100.51 | 889 | 872 | 165.8 |
| C | 14 | 238 | 138765 | 716.5 | 839 | 846 | 192.5 |
| C | 13 | 250 | 58768 | 300.91 | 839 | 846 | 192.5 |
| C | 3 | 233 | 13167 | 64.01 | 839 | 846 | 192.5 |
| D | 1 | 52 | 935500 | 4758.44 | 836 | 818 | 196.4 |
| D | 12 | 233 | 247595 | 1256.33 | 836 | 818 | 196.4 |
| D | 12 | 217 | 101511 | 512.63 | 836 | 818 | 196.4 |
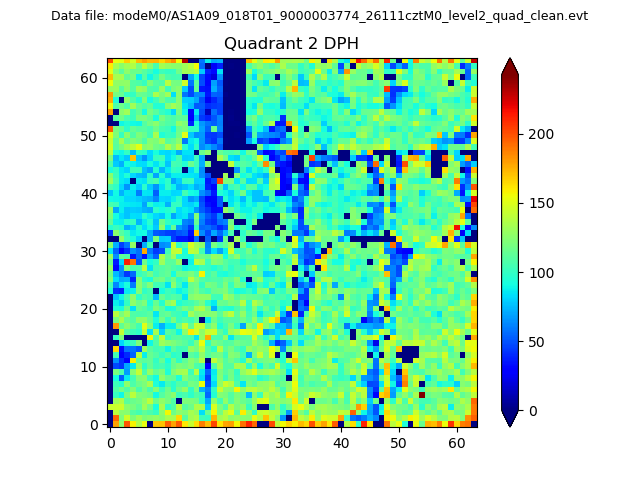
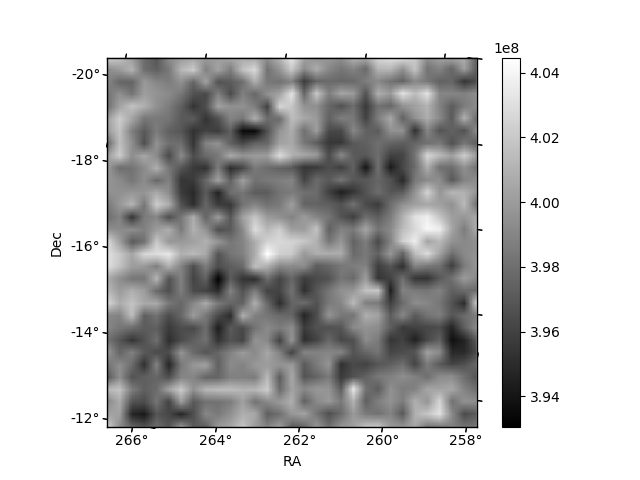
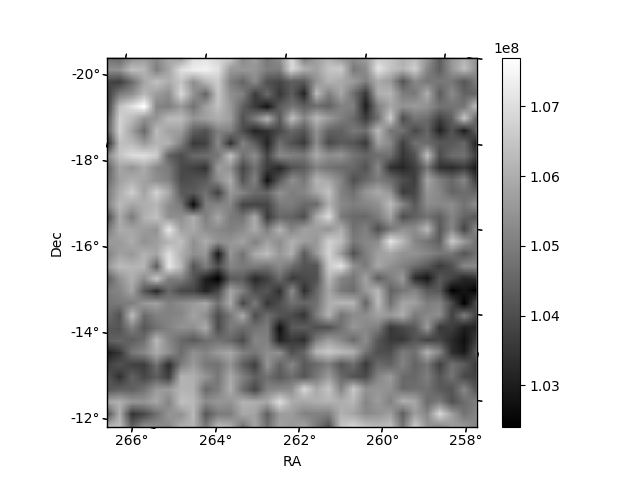
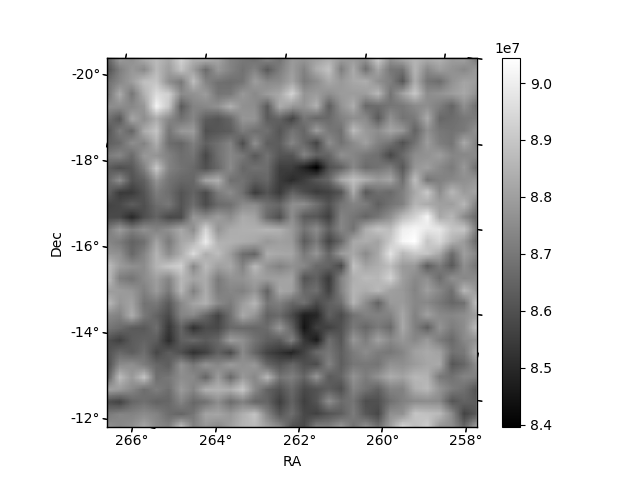
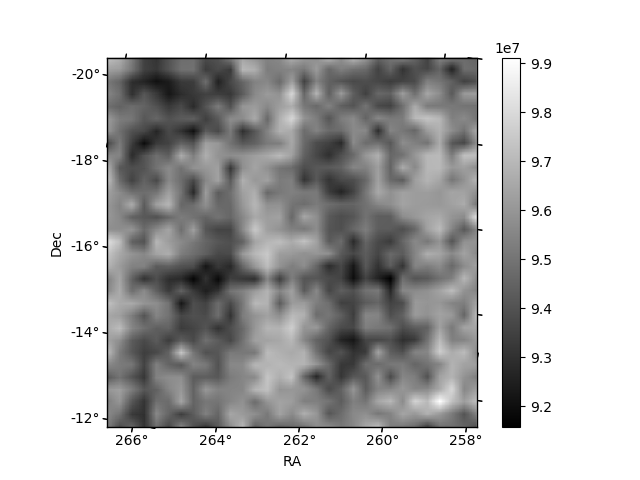
Histogram calculated using DETX and DETY for each event in the final _common_clean file
| Quadrant A | 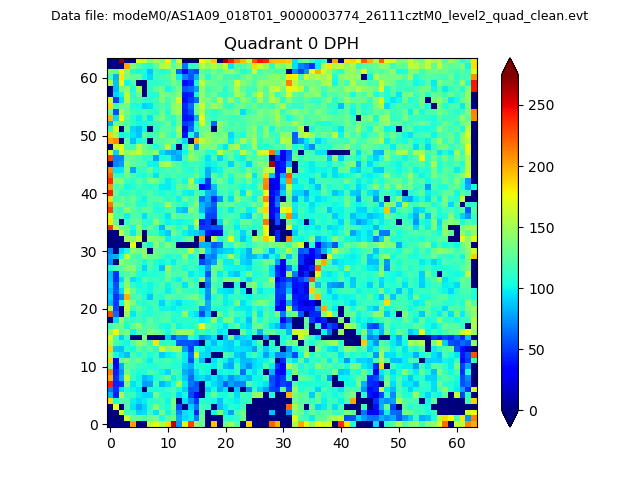 |
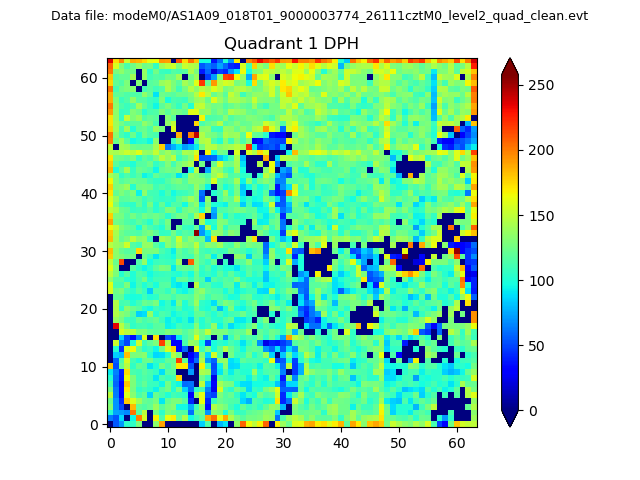 |
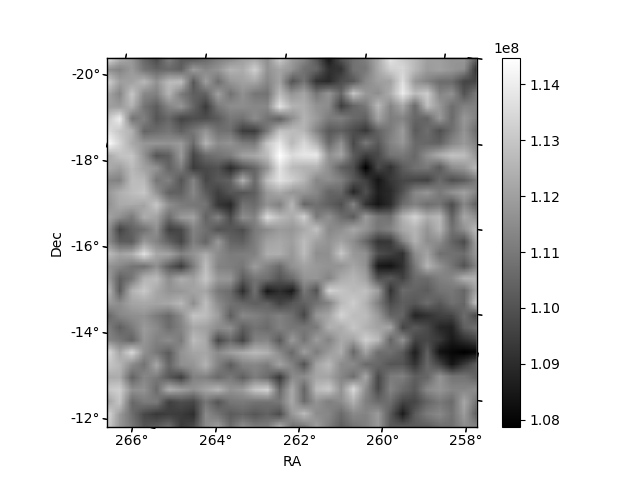
Quadrant B |
|---|---|---|---|
| Quadrant D | 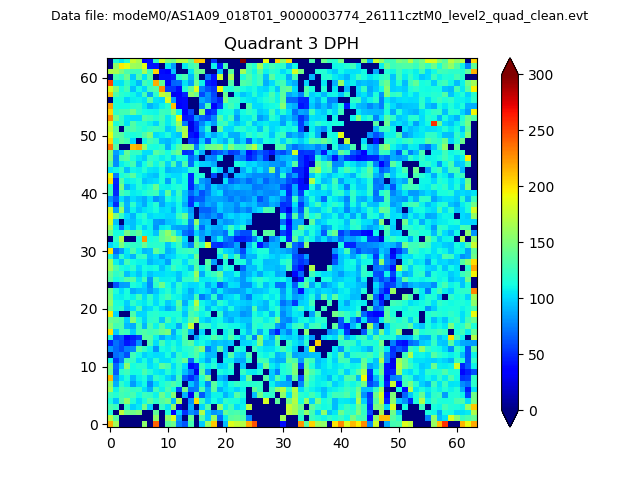 |
 |
Quadrant C |
| Plot type | Count rate plots | Images |
|---|---|---|
| Comparison with Poisson distribution Blue bars denote a histogram of data divided into 1 sec bins. Red curve is a Poisson curve with rate = median count rate of data. |
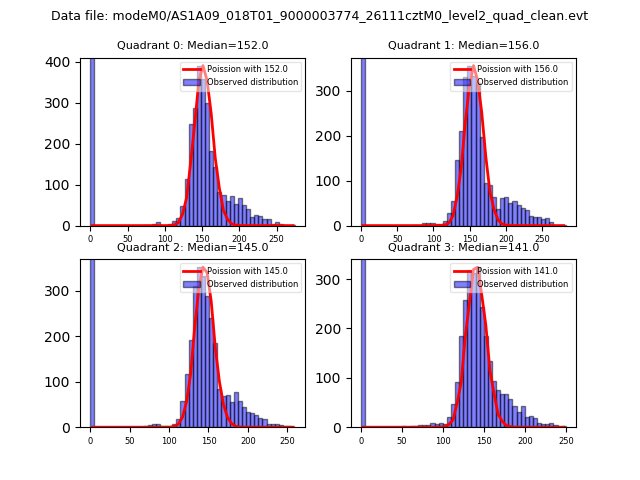 |
 |
| Quadrant-wise count rates Data is divided into 100 sec bins |
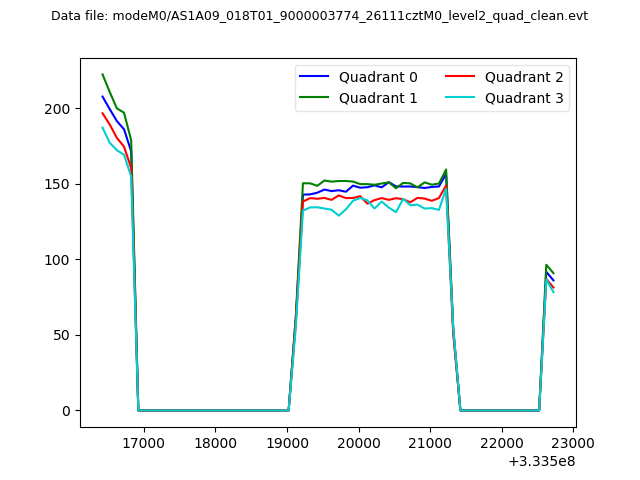 |
|
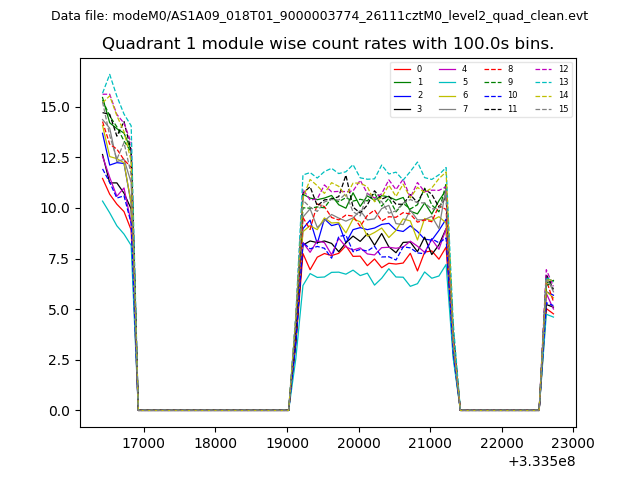
| Module-wise count rates for Quadrant A Data is divided into 100 sec bins |
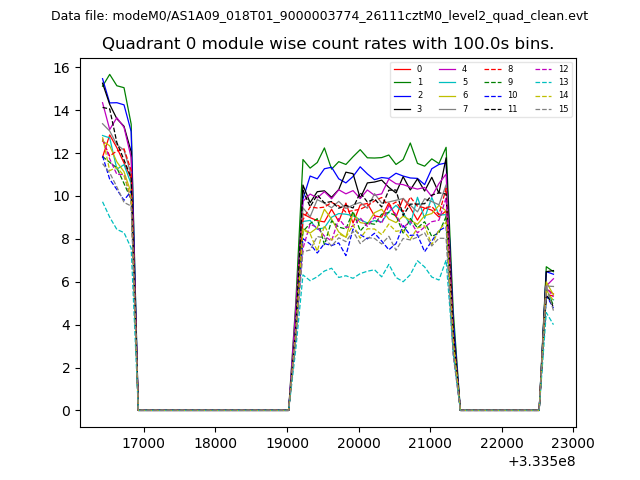 |
 |
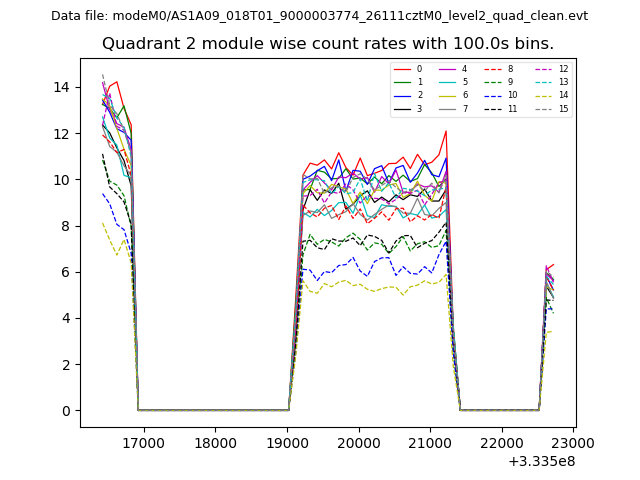
| Module-wise count rates for Quadrant B Data is divided into 100 sec bins |
 |
 |
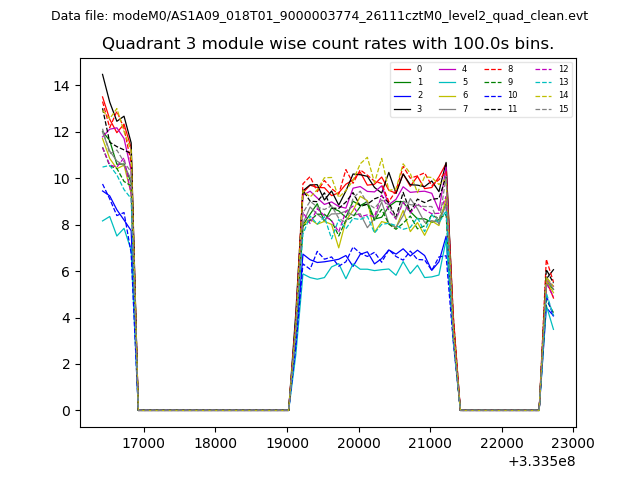
| Module-wise count rates for Quadrant C Data is divided into 100 sec bins |
 |
 |
| Module-wise count rates for Quadrant D Data is divided into 100 sec bins |
 |
 |
| Parameter | Plot |
|---|---|
| CZT HV Monitor | 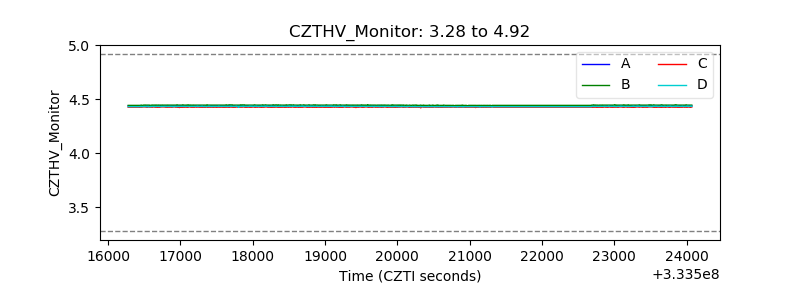 |
| D_VDD | 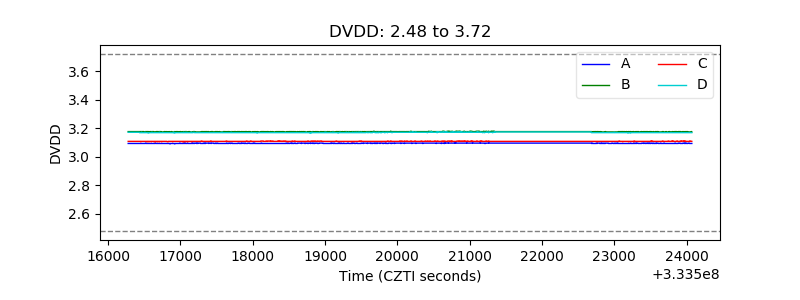 |
| Temperature 1 | 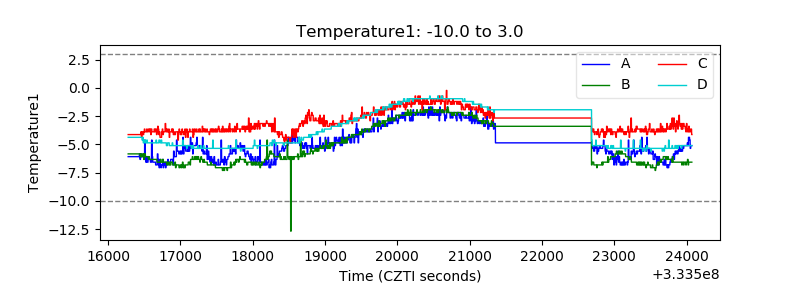 |
| Veto HV Monitor | 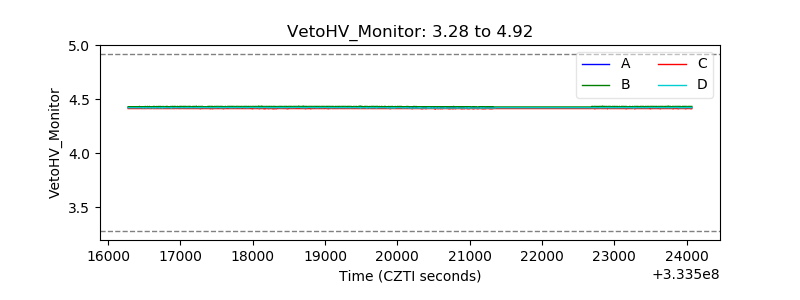 |
| Veto LLD | 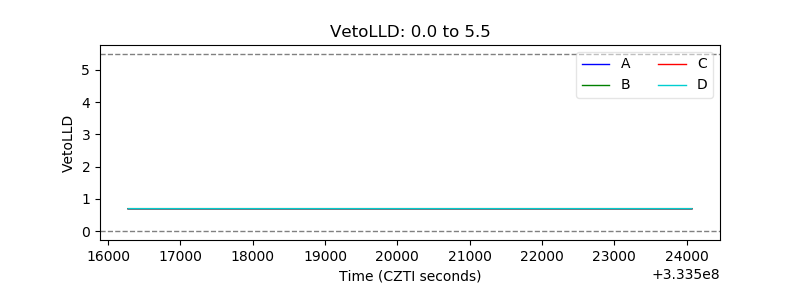 |
| Alpha Counter | 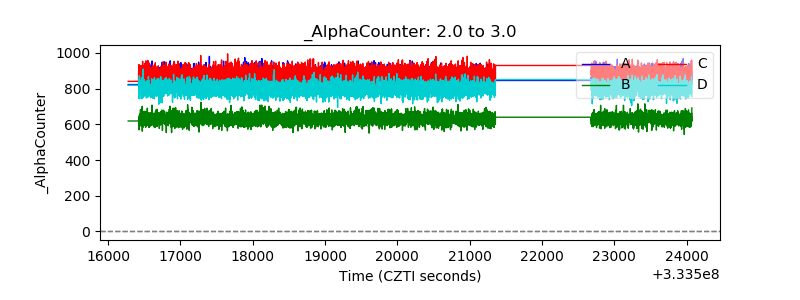 |
| _CPM_Rate | 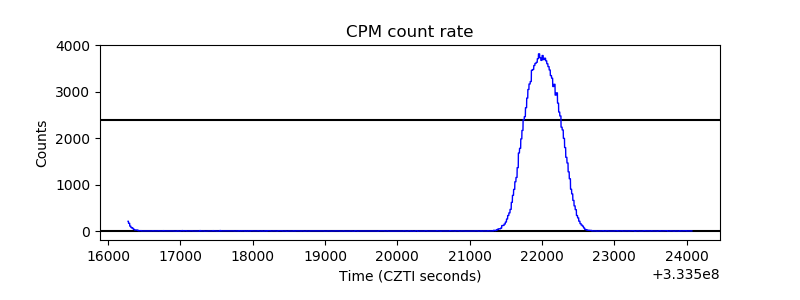 |
| CZT Counter | 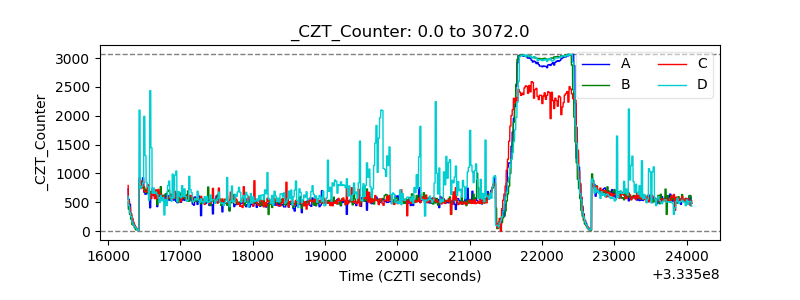 |
| +2.5 Volts monitor |  |
| +5 Volts monitor |  |
| _ROLL_ROT | 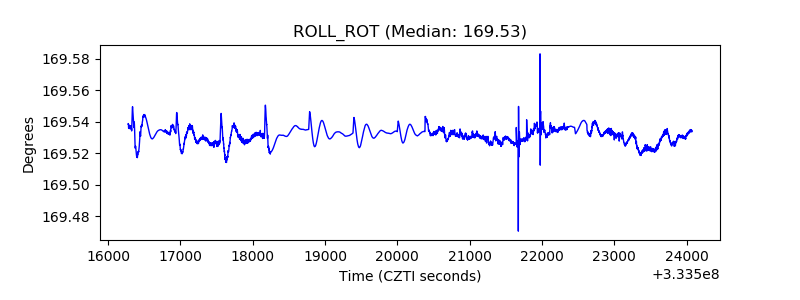 |
| _Roll_DEC | 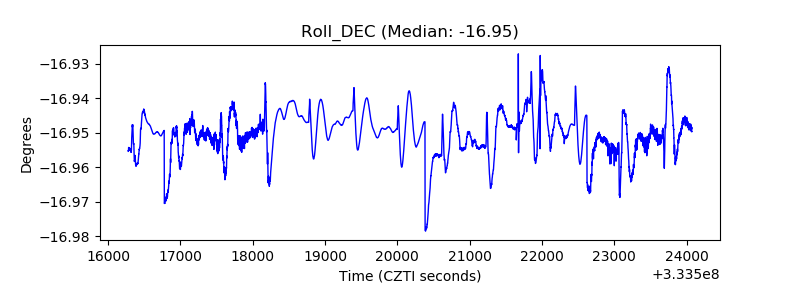 |
| _Roll_RA | 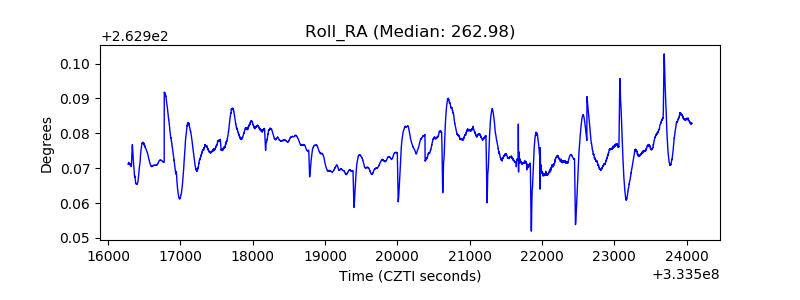 |
| Veto Counter | 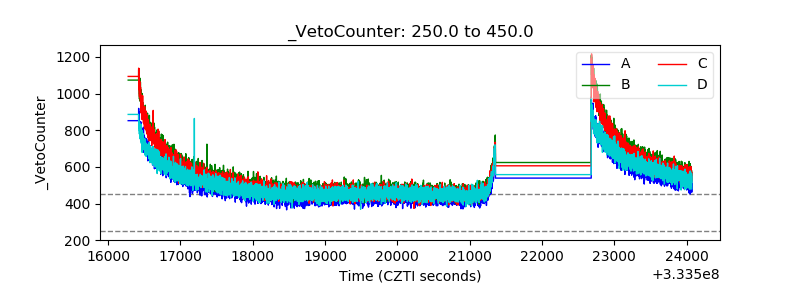 |