| Param | Original file | Final file |
|---|---|---|
| Filename | modeM0/AS1A09_018T01_9000003774_26112cztM0_level2.evt | modeM0/AS1A09_018T01_9000003774_26112cztM0_level2_quad_clean.evt |
| Size (bytes) | 520,041,600 | 65,338,560 |
| Size | 496.0 MB | 62.3 MB |
| Events in quadrant A | 3,637,350 | 398,924 |
| Events in quadrant B | 3,593,319 | 408,154 |
| Events in quadrant C | 3,599,635 | 379,120 |
| Events in quadrant D | 4,491,746 | 351,630 |
| Mode M0 | |||
|---|---|---|---|
| Quadrant | BADHDUFLAG | Total packets | Discarded packets |
| A | 0 | 14439 | 0 |
| B | 0 | 14478 | 0 |
| C | 0 | 14467 | 0 |
| D | 0 | 17295 | 0 |
| Mode M9 | |||
|---|---|---|---|
| Quadrant | BADHDUFLAG | Total packets | Discarded packets |
| A | 0 | 19 | 0 |
| B | 0 | 20 | 0 |
| C | 0 | 20 | 0 |
| D | 0 | 20 | 0 |
| Quadrant | Total seconds | Saturated seconds | Saturation percentage |
|---|---|---|---|
| A | 6308 | 69 | 1.093849% |
| B | 6308 | 33 | 0.523145% |
| C | 6308 | 96 | 1.521877% |
| D | 6307 | 304 | 4.820041% |
Noise dominated data is calculated using 1-second bins in cleaned event files. If a bin has >2000 counts, and if more than 50% of those come from <1% of pixels, then it is considered to be noise-dominated and hence unusable.
| Quadrant | # 1 sec bins | Bins with >0 counts | Bins with >2000 counts | High rate bins dominated by noise | Noise dominated (total time) | Noise dominated (detector-on time) | Marked lightcurve |
|---|---|---|---|---|---|---|---|
| A | 7713 | 6309 | 42 | 42 | 0.54% | 0.67% |  |
| B | 7713 | 6309 | 0 | 0 | 0.00% | 0.00% |  |
| C | 7713 | 6308 | 4 | 4 | 0.05% | 0.06% | 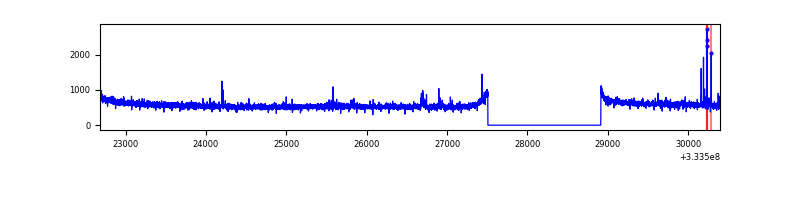 |
| D | 7712 | 6308 | 289 | 289 | 3.75% | 4.58% | 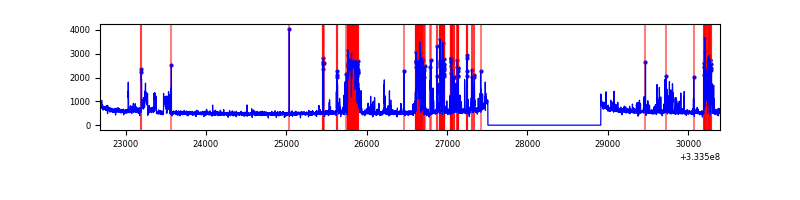 |
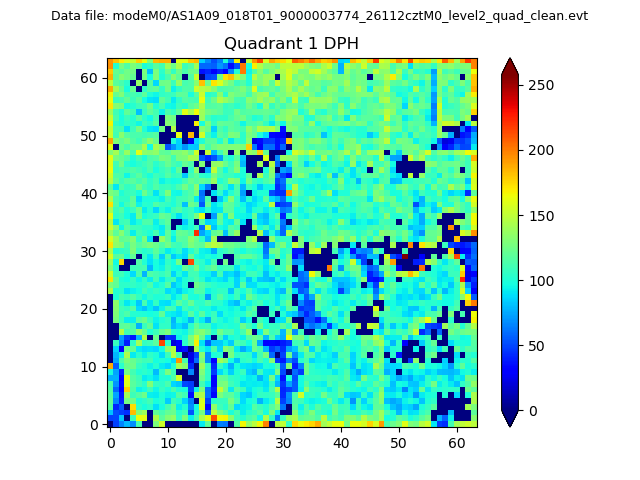
Top three noisy pixels from each quadrant. If the there are fewer than three noisy pixels in the level2.evt file, extra rows are filled as -1
| Pixel properties | Quadrant properties | ||||||
|---|---|---|---|---|---|---|---|
| Quadrant | DetID | PixID | Counts | Sigma | Mean | Median | Sigma |
| A | 0 | 13 | 112969 | 621.75 | 915 | 903 | 180.2 |
| A | 13 | 254 | 8517 | 42.24 | 915 | 903 | 180.2 |
| A | 0 | 226 | 7854 | 38.56 | 915 | 903 | 180.2 |
| B | 12 | 111 | 19463 | 109.91 | 915 | 897 | 168.9 |
| B | 11 | 111 | 17682 | 99.37 | 915 | 897 | 168.9 |
| B | 14 | 111 | 16651 | 93.26 | 915 | 897 | 168.9 |
| C | 14 | 238 | 144707 | 727.41 | 866 | 876 | 197.7 |
| C | 3 | 233 | 36495 | 180.14 | 866 | 876 | 197.7 |
| C | 2 | 16 | 34102 | 168.04 | 866 | 876 | 197.7 |
| D | 12 | 233 | 615036 | 3058.1 | 852 | 832 | 200.8 |
| D | 1 | 52 | 595779 | 2962.22 | 852 | 832 | 200.8 |
| D | 13 | 168 | 31835 | 154.36 | 852 | 832 | 200.8 |
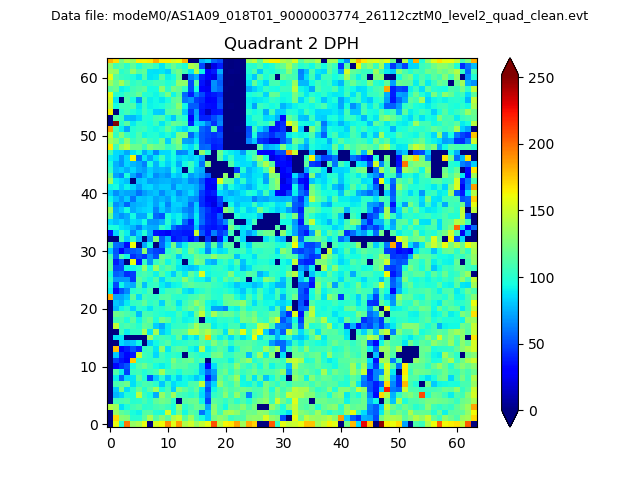
Histogram calculated using DETX and DETY for each event in the final _common_clean file
| Quadrant A | 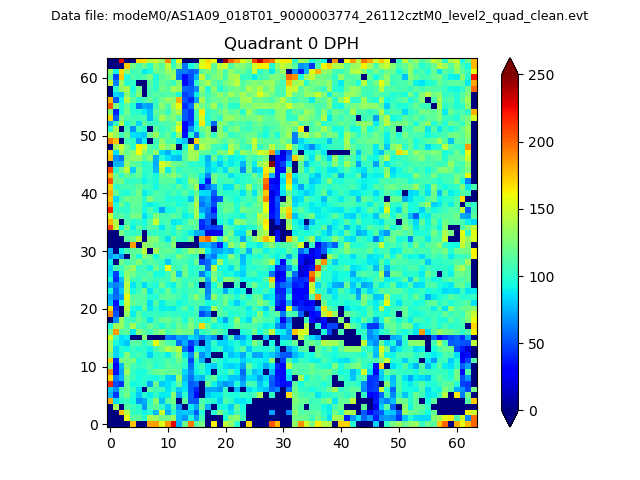 |
 |
Quadrant B |
|---|---|---|---|
| Quadrant D | 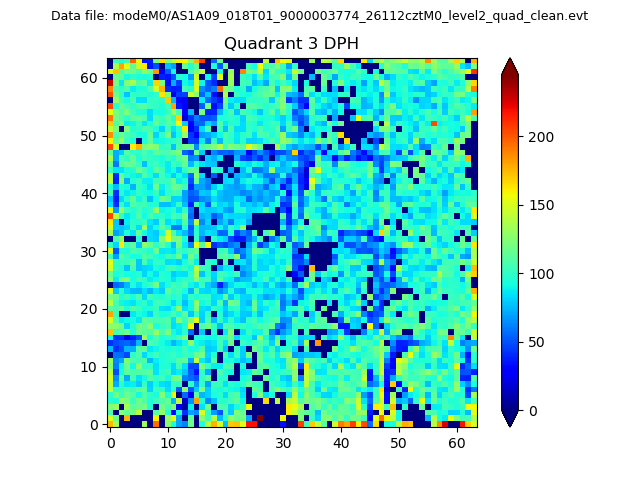 |
 |
Quadrant C |
| Plot type | Count rate plots | Images |
|---|---|---|
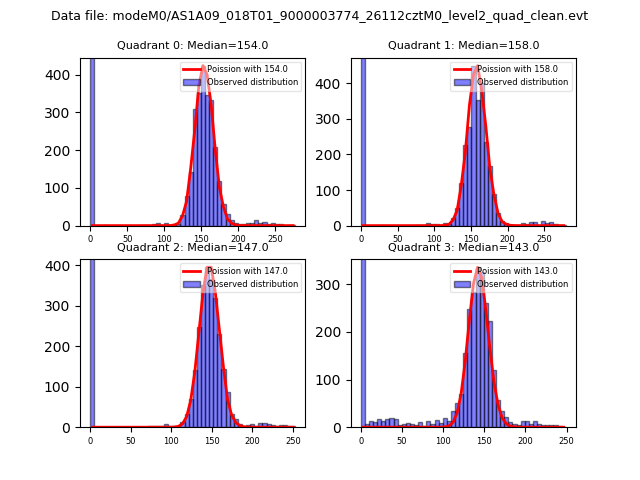
| Comparison with Poisson distribution Blue bars denote a histogram of data divided into 1 sec bins. Red curve is a Poisson curve with rate = median count rate of data. |
 |
 |
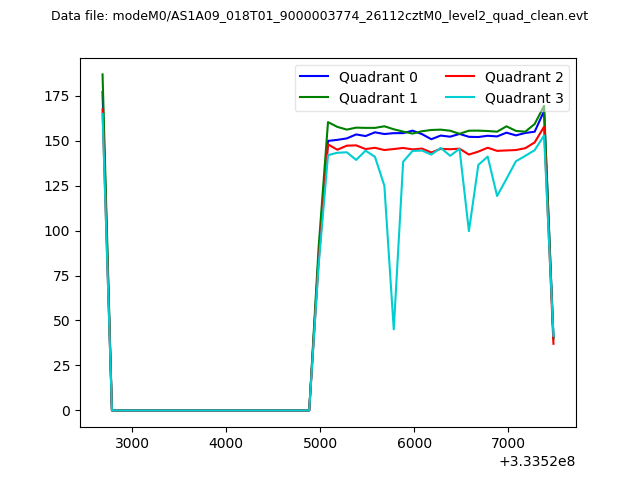
| Quadrant-wise count rates Data is divided into 100 sec bins |
 |
|
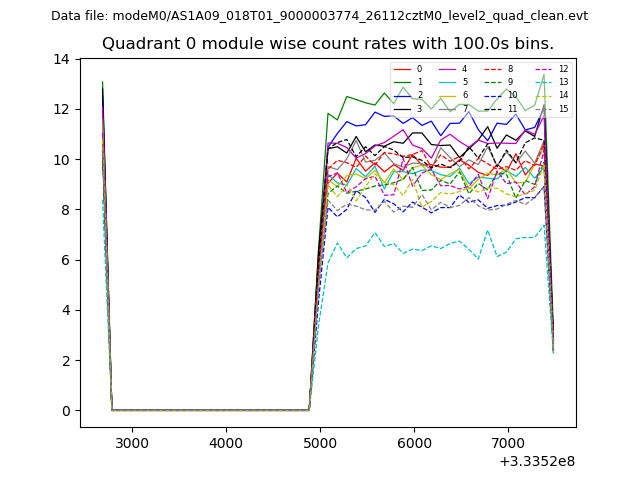
| Module-wise count rates for Quadrant A Data is divided into 100 sec bins |
 |
 |
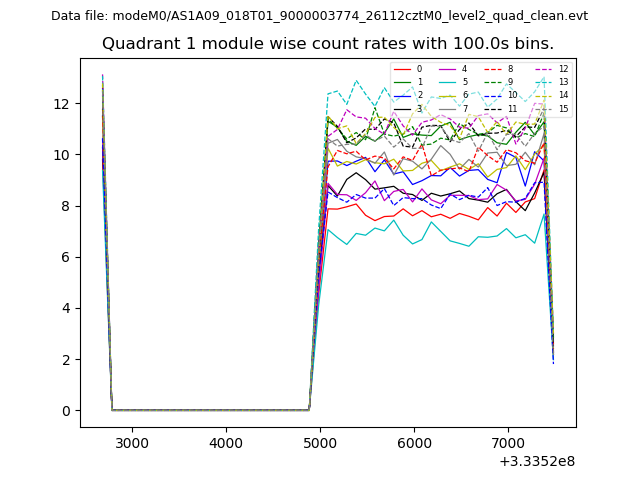
| Module-wise count rates for Quadrant B Data is divided into 100 sec bins |
 |
 |
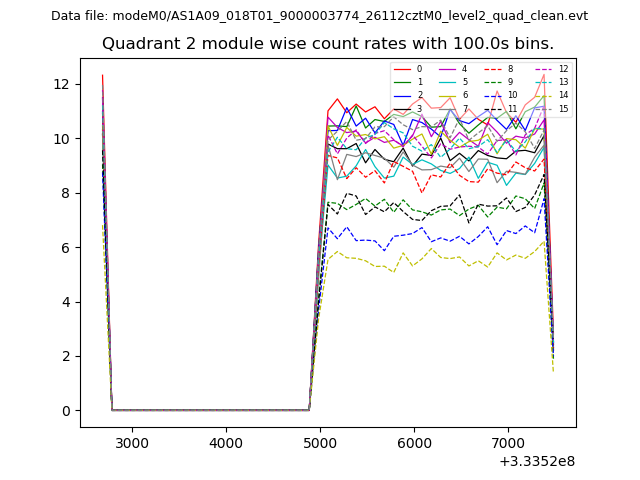
| Module-wise count rates for Quadrant C Data is divided into 100 sec bins |
 |
 |
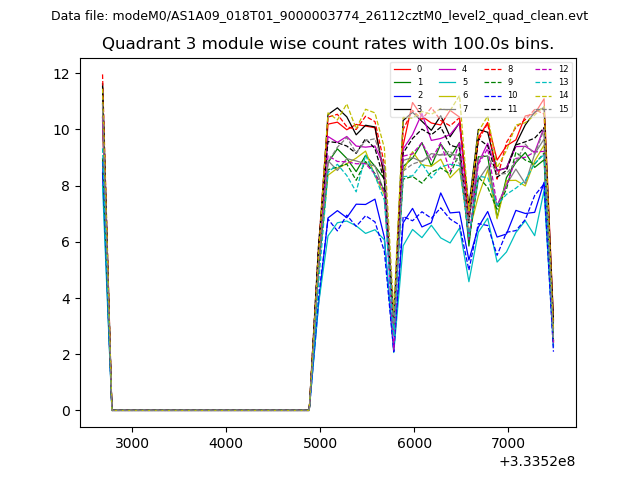
| Module-wise count rates for Quadrant D Data is divided into 100 sec bins |
 |
 |
| Parameter | Plot |
|---|---|
| CZT HV Monitor | 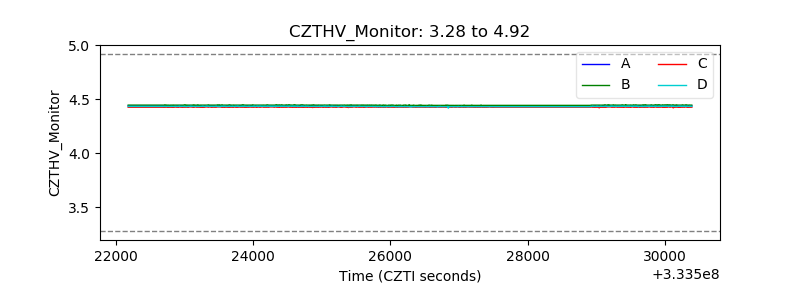 |
| D_VDD | 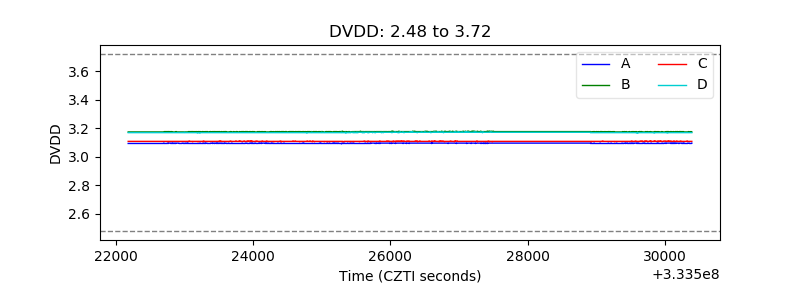 |
| Temperature 1 | 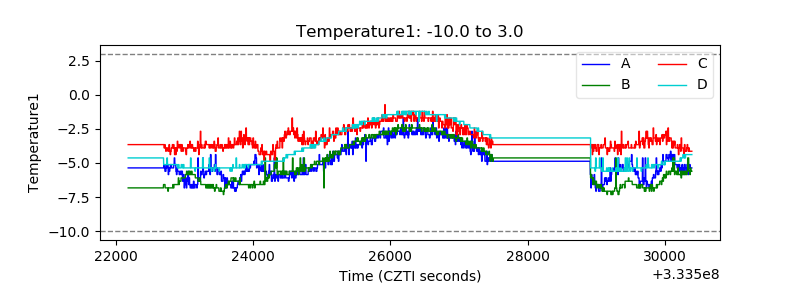 |
| Veto HV Monitor | 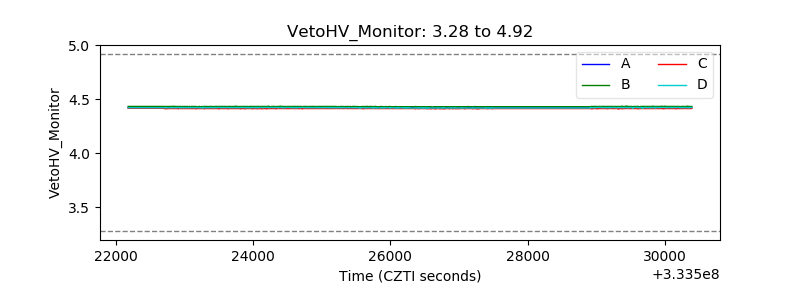 |
| Veto LLD | 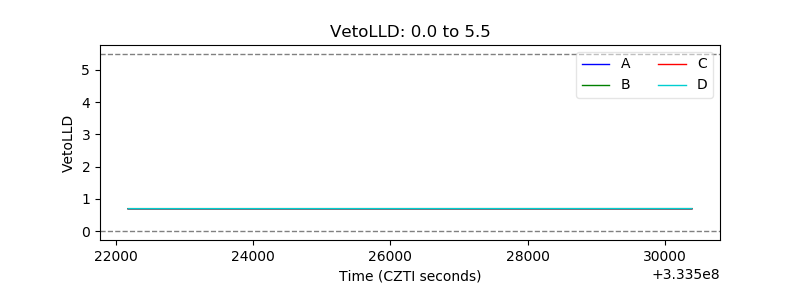 |
| Alpha Counter | 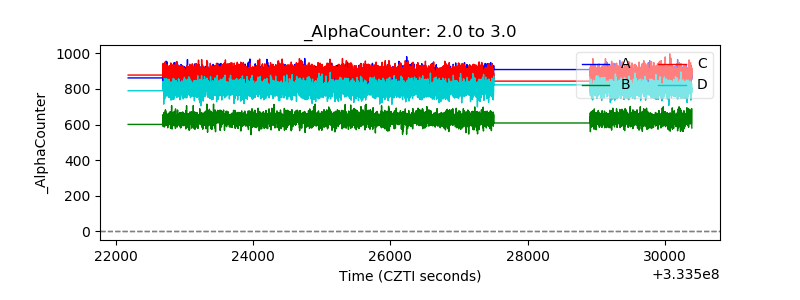 |
| _CPM_Rate | 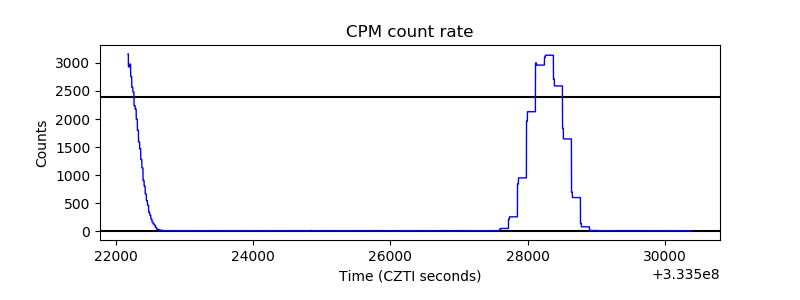 |
| CZT Counter | 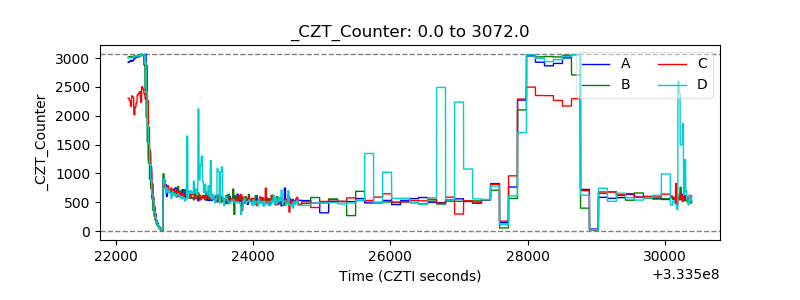 |
| +2.5 Volts monitor |  |
| +5 Volts monitor |  |
| _ROLL_ROT | 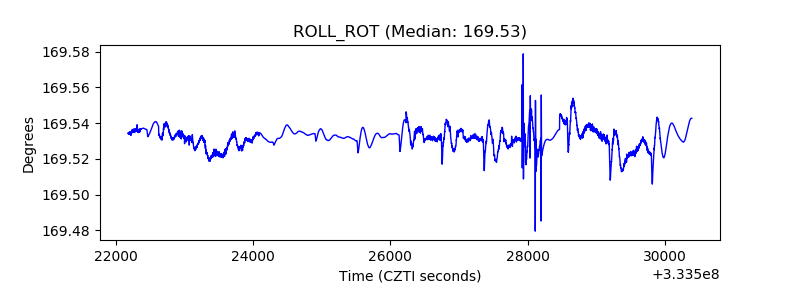 |
| _Roll_DEC | 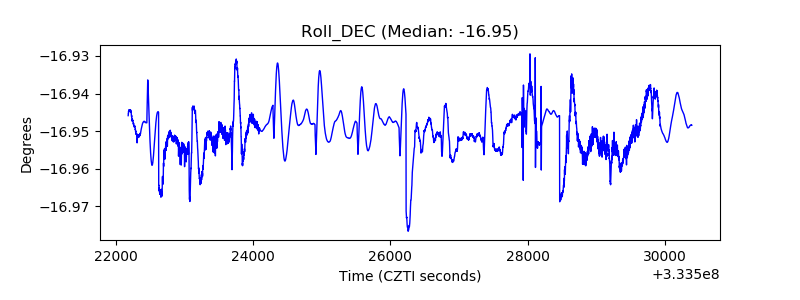 |
| _Roll_RA | 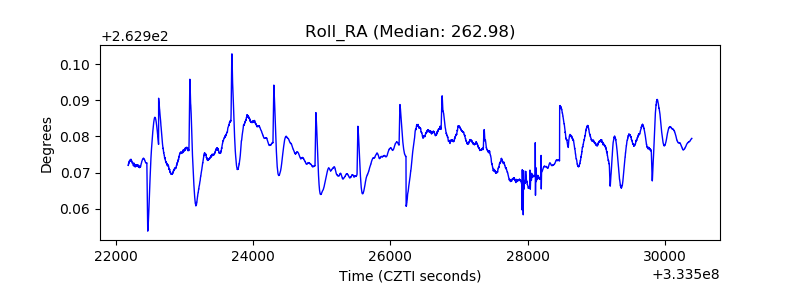 |
| Veto Counter | 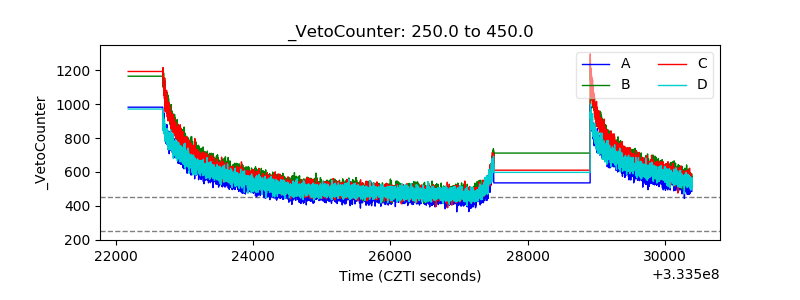 |