| Param | Original file | Final file |
|---|---|---|
| Filename | modeM0/AS1A09_018T01_9000003774_26113cztM0_level2.evt | modeM0/AS1A09_018T01_9000003774_26113cztM0_level2_quad_clean.evt |
| Size (bytes) | 518,561,280 | 71,435,520 |
| Size | 494.5 MB | 68.1 MB |
| Events in quadrant A | 3,480,230 | 450,644 |
| Events in quadrant B | 3,519,065 | 459,594 |
| Events in quadrant C | 3,604,863 | 426,912 |
| Events in quadrant D | 4,682,820 | 395,507 |
| Mode M0 | |||
|---|---|---|---|
| Quadrant | BADHDUFLAG | Total packets | Discarded packets |
| A | 0 | 13874 | 0 |
| B | 0 | 14147 | 0 |
| C | 0 | 14554 | 0 |
| D | 0 | 17792 | 0 |
| Mode M9 | |||
|---|---|---|---|
| Quadrant | BADHDUFLAG | Total packets | Discarded packets |
| A | 0 | 22 | 0 |
| B | 0 | 23 | 0 |
| C | 0 | 23 | 0 |
| D | 0 | 23 | 0 |
| Quadrant | Total seconds | Saturated seconds | Saturation percentage |
|---|---|---|---|
| A | 6166 | 66 | 1.070386% |
| B | 6166 | 73 | 1.183912% |
| C | 6166 | 163 | 2.643529% |
| D | 6166 | 419 | 6.795329% |
Noise dominated data is calculated using 1-second bins in cleaned event files. If a bin has >2000 counts, and if more than 50% of those come from <1% of pixels, then it is considered to be noise-dominated and hence unusable.
| Quadrant | # 1 sec bins | Bins with >0 counts | Bins with >2000 counts | High rate bins dominated by noise | Noise dominated (total time) | Noise dominated (detector-on time) | Marked lightcurve |
|---|---|---|---|---|---|---|---|
| A | 7556 | 6166 | 1 | 1 | 0.01% | 0.02% | 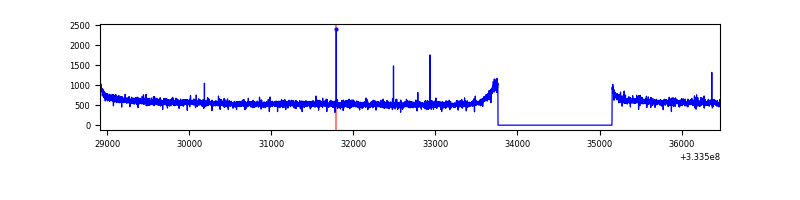 |
| B | 7556 | 6166 | 0 | 0 | 0.00% | 0.00% | 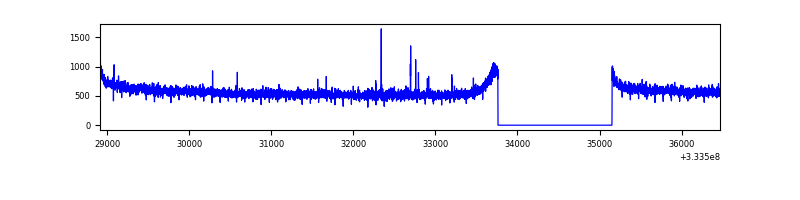 |
| C | 7556 | 6166 | 7 | 7 | 0.09% | 0.11% | 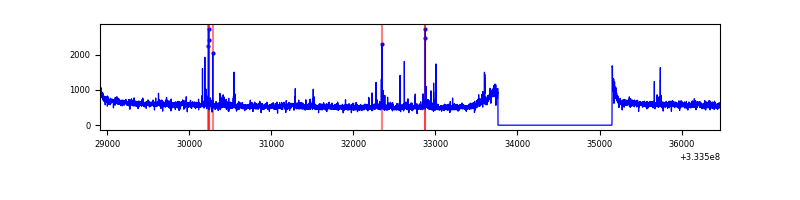 |
| D | 7556 | 6166 | 320 | 320 | 4.24% | 5.19% | 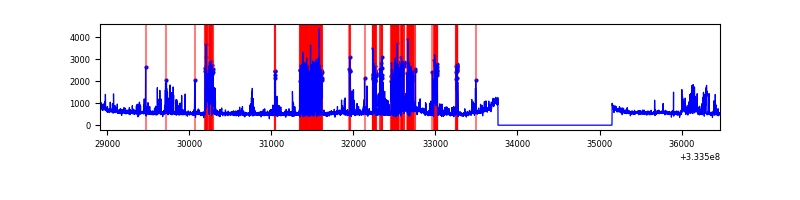 |
Top three noisy pixels from each quadrant. If the there are fewer than three noisy pixels in the level2.evt file, extra rows are filled as -1
| Pixel properties | Quadrant properties | ||||||
|---|---|---|---|---|---|---|---|
| Quadrant | DetID | PixID | Counts | Sigma | Mean | Median | Sigma |
| A | 0 | 13 | 10091 | 51.51 | 901 | 888 | 178.7 |
| A | 13 | 254 | 8509 | 42.65 | 901 | 888 | 178.7 |
| A | 0 | 226 | 7726 | 38.27 | 901 | 888 | 178.7 |
| B | 12 | 111 | 19597 | 112.52 | 895 | 877 | 166.4 |
| B | 11 | 111 | 17700 | 101.12 | 895 | 877 | 166.4 |
| B | 14 | 111 | 16519 | 94.02 | 895 | 877 | 166.4 |
| C | 14 | 238 | 139366 | 709.58 | 852 | 863 | 195.2 |
| C | 2 | 16 | 72459 | 366.8 | 852 | 863 | 195.2 |
| C | 3 | 233 | 66974 | 338.7 | 852 | 863 | 195.2 |
| D | 1 | 52 | 1312871 | 6591.0 | 839 | 821 | 199.1 |
| D | 12 | 233 | 116622 | 581.72 | 839 | 821 | 199.1 |
| D | 1 | 3 | 32972 | 161.51 | 839 | 821 | 199.1 |
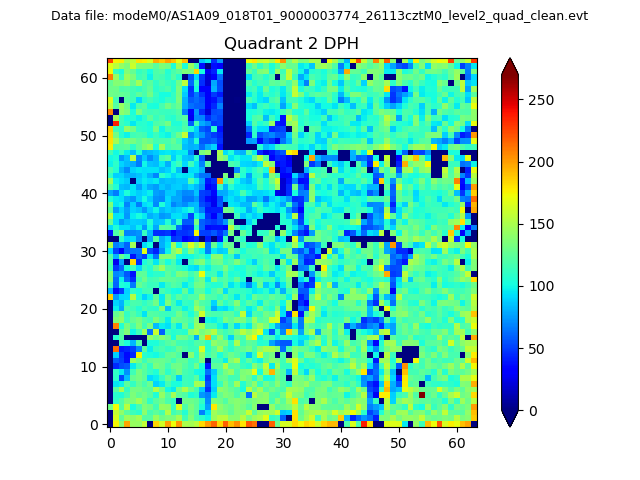
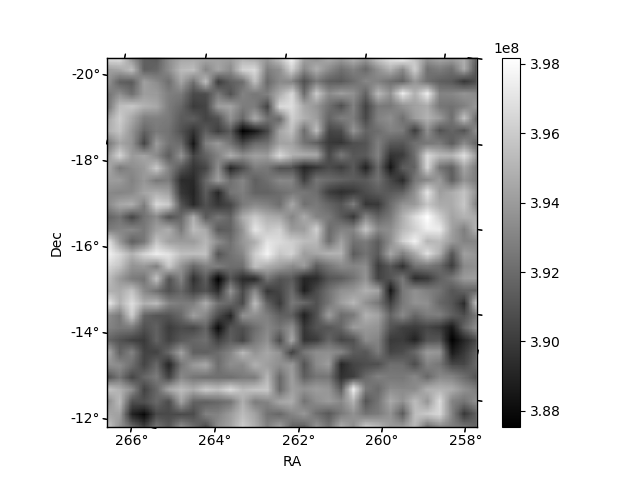
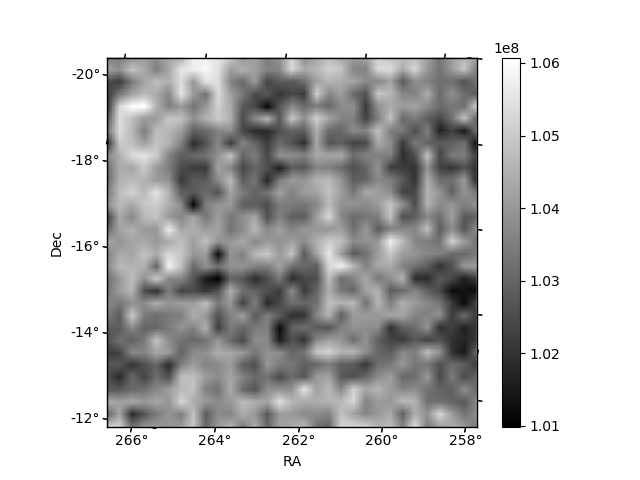
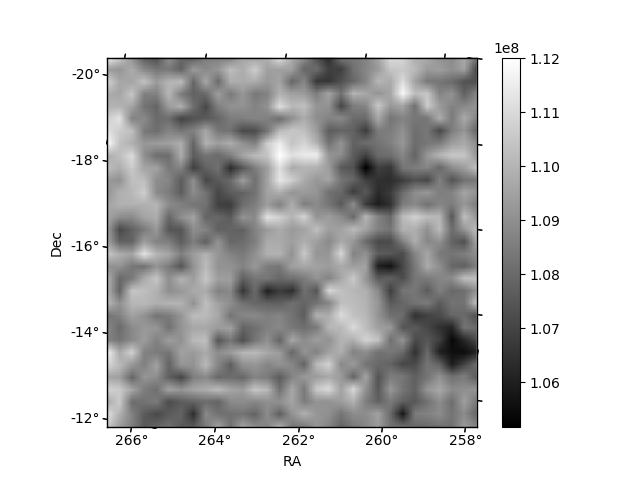
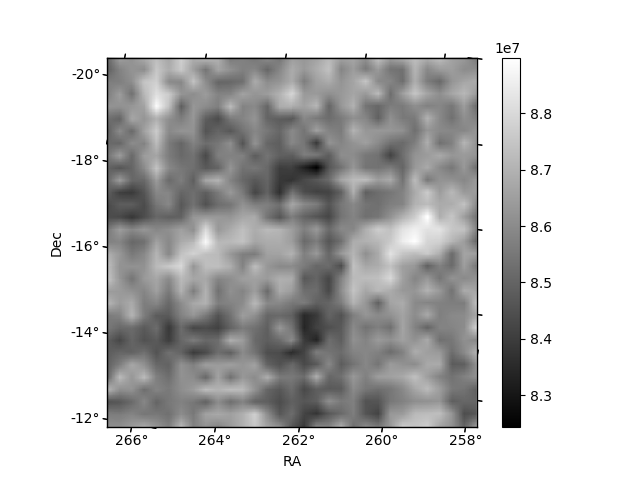
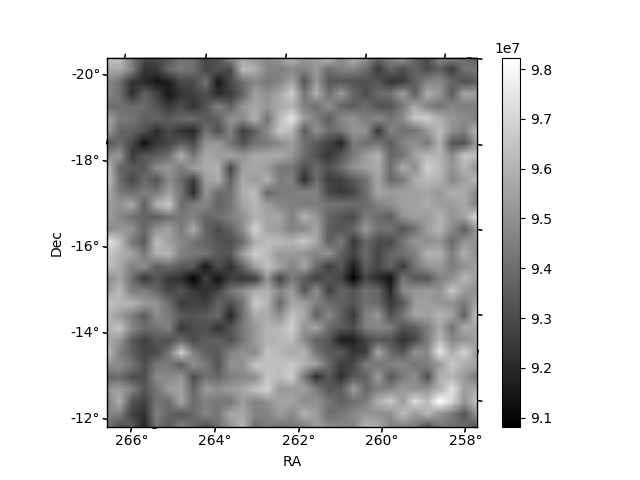
Histogram calculated using DETX and DETY for each event in the final _common_clean file
| Quadrant A | 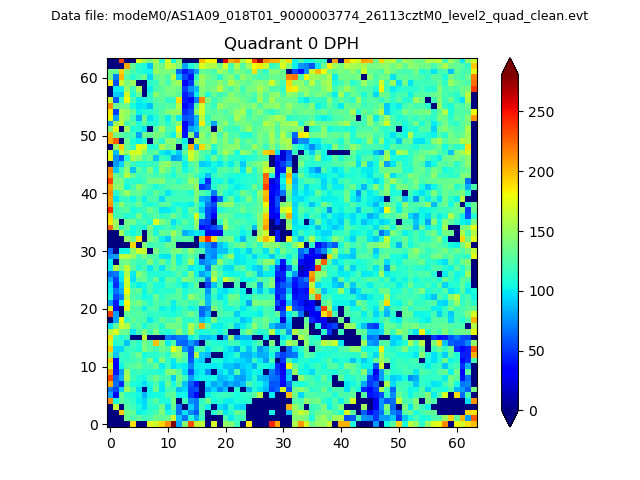 |
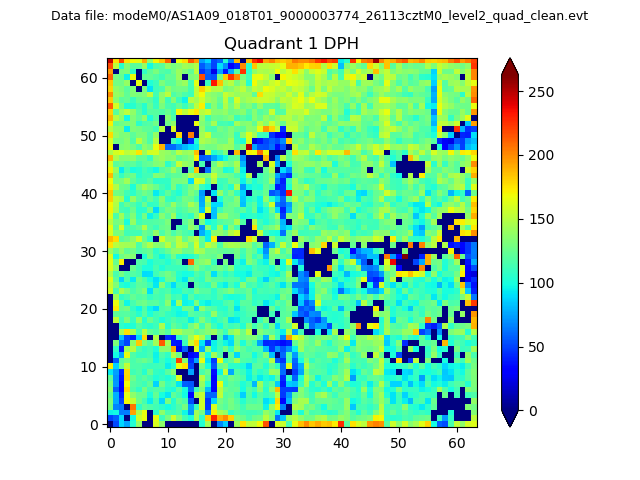 |
Quadrant B |
|---|---|---|---|
| Quadrant D | 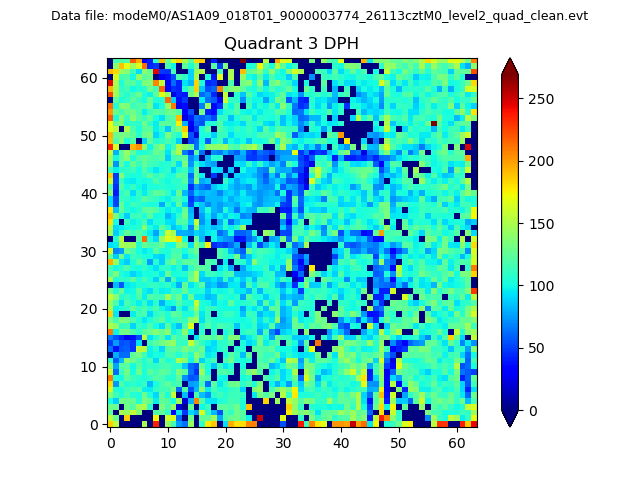 |
 |
Quadrant C |
| Plot type | Count rate plots | Images |
|---|---|---|
| Comparison with Poisson distribution Blue bars denote a histogram of data divided into 1 sec bins. Red curve is a Poisson curve with rate = median count rate of data. |
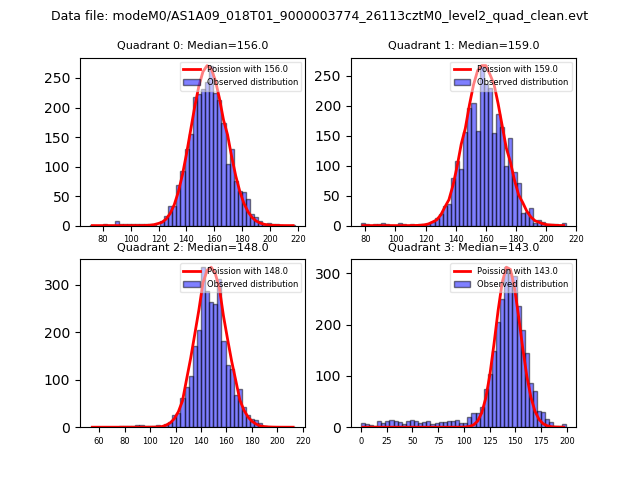 |
 |
| Quadrant-wise count rates Data is divided into 100 sec bins |
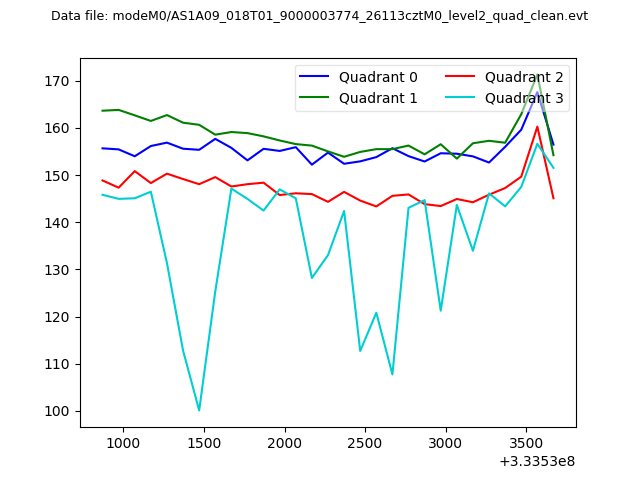 |
|
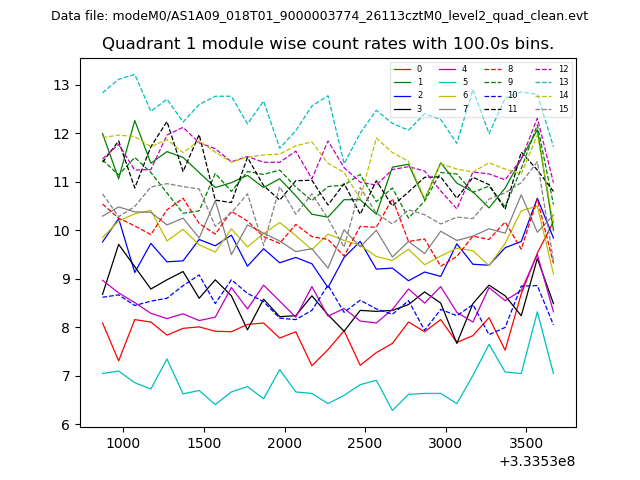
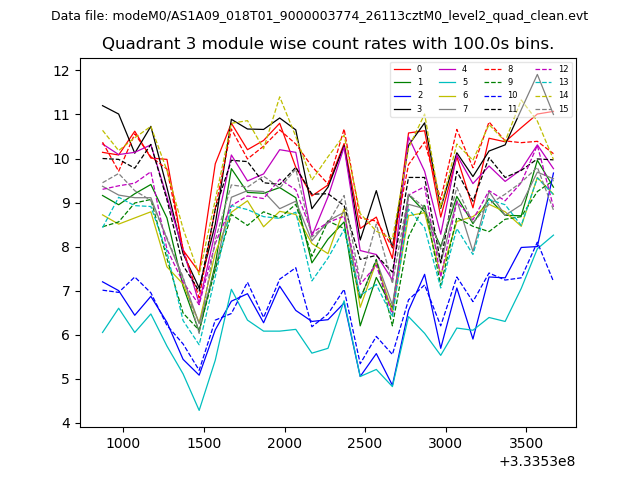
| Module-wise count rates for Quadrant A Data is divided into 100 sec bins |
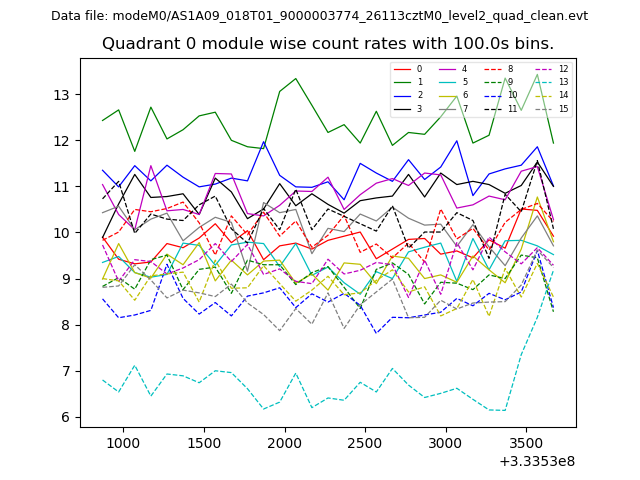 |
 |
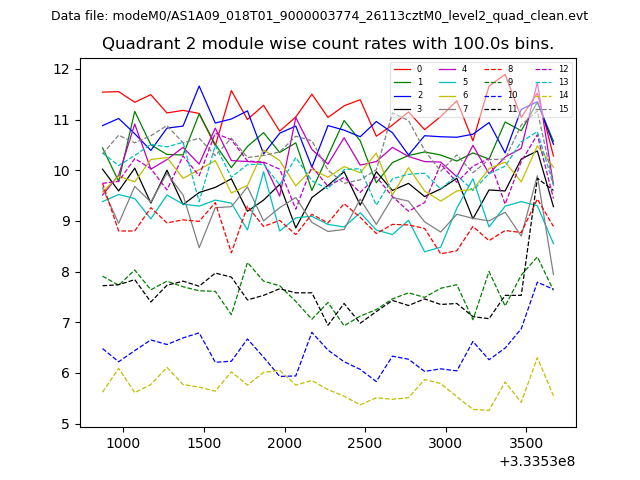
| Module-wise count rates for Quadrant B Data is divided into 100 sec bins |
 |
 |
| Module-wise count rates for Quadrant C Data is divided into 100 sec bins |
 |
 |
| Module-wise count rates for Quadrant D Data is divided into 100 sec bins |
 |
 |
| Parameter | Plot |
|---|---|
| CZT HV Monitor | 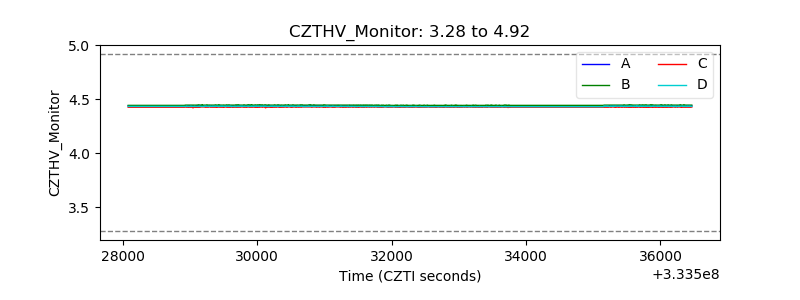 |
| D_VDD | 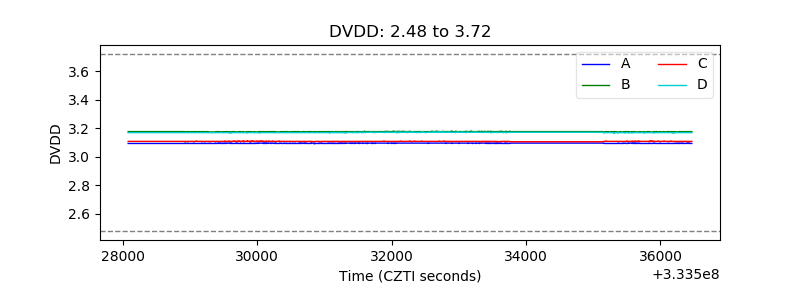 |
| Temperature 1 | 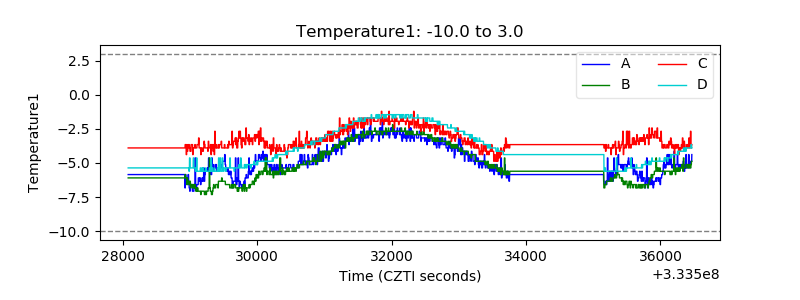 |
| Veto HV Monitor |  |
| Veto LLD | 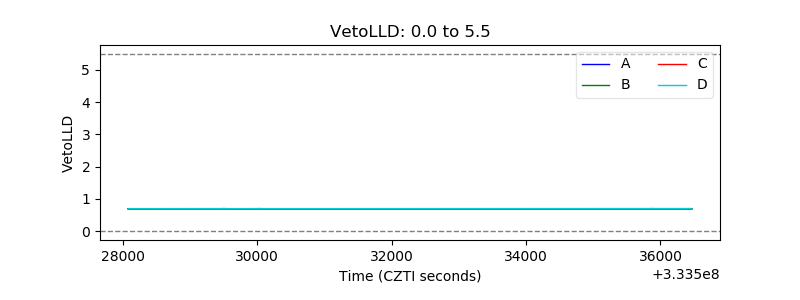 |
| Alpha Counter | 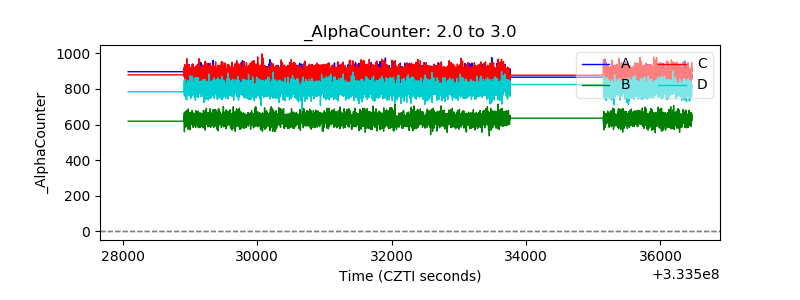 |
| _CPM_Rate | 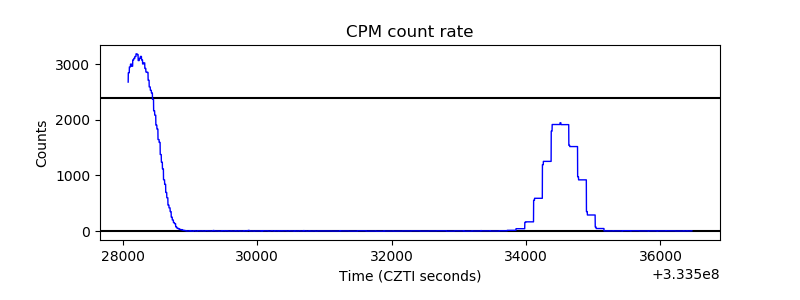 |
| CZT Counter | 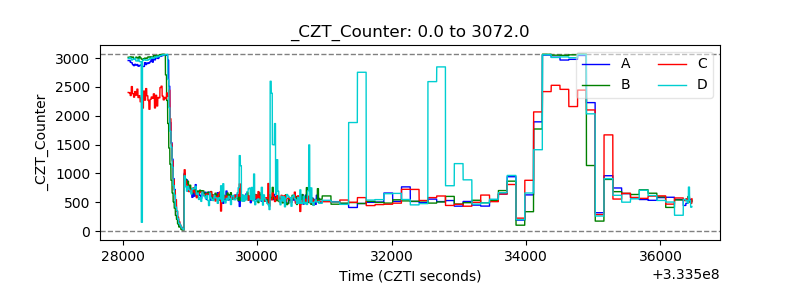 |
| +2.5 Volts monitor |  |
| +5 Volts monitor |  |
| _ROLL_ROT | 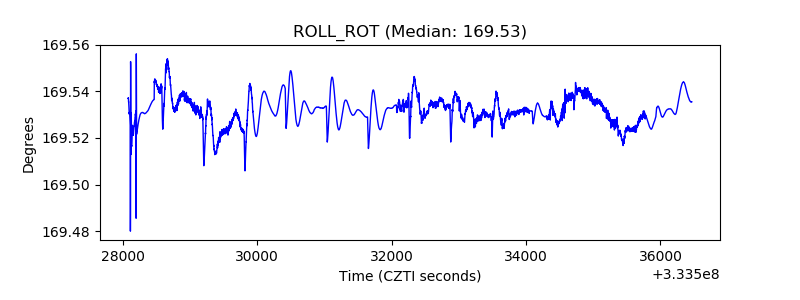 |
| _Roll_DEC | 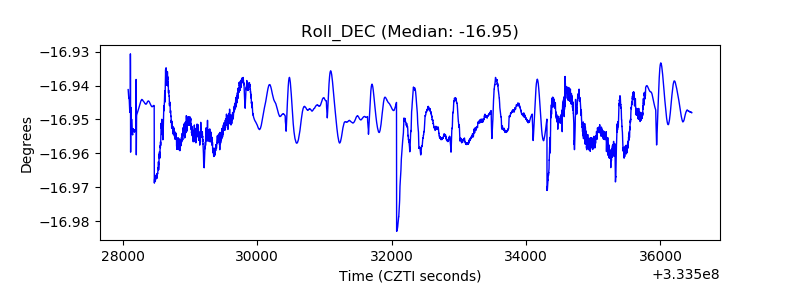 |
| _Roll_RA | 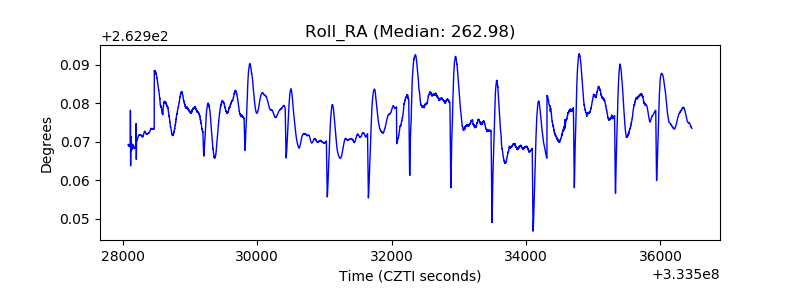 |
| Veto Counter | 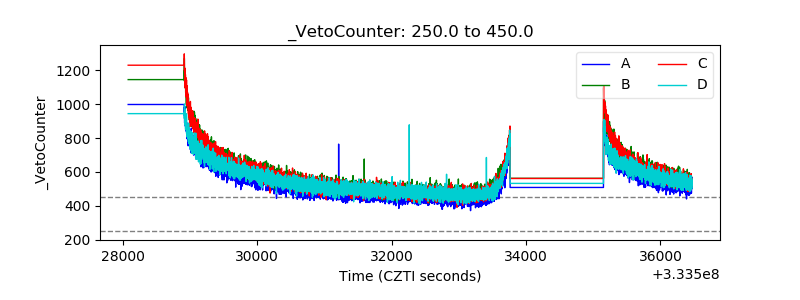 |