| Param | Original file | Final file |
|---|---|---|
| Filename | modeM0/AS1A09_018T01_9000003774_26114cztM0_level2.evt | modeM0/AS1A09_018T01_9000003774_26114cztM0_level2_quad_clean.evt |
| Size (bytes) | 295,251,840 | 54,711,360 |
| Size | 281.6 MB | 52.2 MB |
| Events in quadrant A | 2,088,598 | 353,332 |
| Events in quadrant B | 2,103,485 | 360,468 |
| Events in quadrant C | 2,131,982 | 336,273 |
| Events in quadrant D | 2,351,770 | 331,119 |
| Mode M0 | |||
|---|---|---|---|
| Quadrant | BADHDUFLAG | Total packets | Discarded packets |
| A | 0 | 8351 | 0 |
| B | 0 | 8461 | 0 |
| C | 0 | 8618 | 0 |
| D | 0 | 9264 | 0 |
| Mode M9 | |||
|---|---|---|---|
| Quadrant | BADHDUFLAG | Total packets | Discarded packets |
| A | 0 | 1 | 0 |
| B | 0 | 2 | 0 |
| C | 0 | 2 | 0 |
| D | 0 | 2 | 0 |
| Quadrant | Total seconds | Saturated seconds | Saturation percentage |
|---|---|---|---|
| A | 3898 | 16 | 0.410467% |
| B | 3898 | 10 | 0.256542% |
| C | 3898 | 54 | 1.385326% |
| D | 3898 | 22 | 0.564392% |
Noise dominated data is calculated using 1-second bins in cleaned event files. If a bin has >2000 counts, and if more than 50% of those come from <1% of pixels, then it is considered to be noise-dominated and hence unusable.
| Quadrant | # 1 sec bins | Bins with >0 counts | Bins with >2000 counts | High rate bins dominated by noise | Noise dominated (total time) | Noise dominated (detector-on time) | Marked lightcurve |
|---|---|---|---|---|---|---|---|
| A | 3898 | 3898 | 0 | 0 | 0.00% | 0.00% | 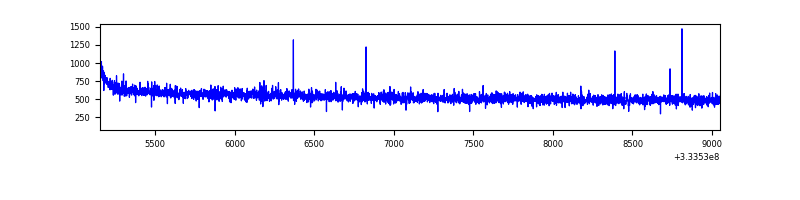 |
| B | 3898 | 3898 | 0 | 0 | 0.00% | 0.00% | 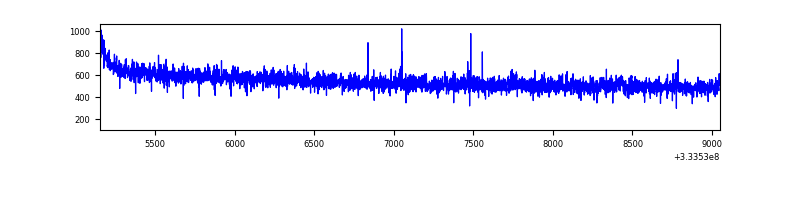 |
| C | 3898 | 3898 | 1 | 1 | 0.03% | 0.03% | 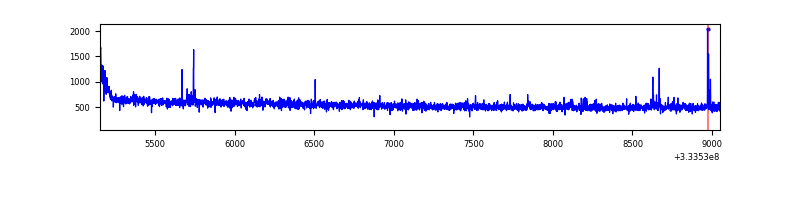 |
| D | 3898 | 3898 | 20 | 20 | 0.51% | 0.51% | 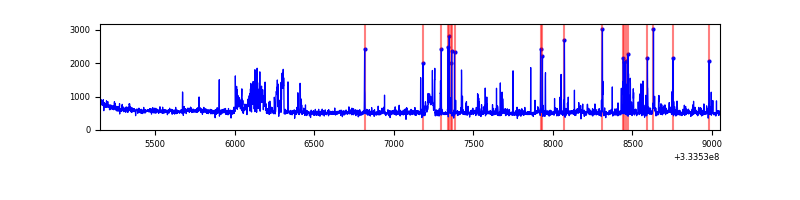 |
Top three noisy pixels from each quadrant. If the there are fewer than three noisy pixels in the level2.evt file, extra rows are filled as -1
| Pixel properties | Quadrant properties | ||||||
|---|---|---|---|---|---|---|---|
| Quadrant | DetID | PixID | Counts | Sigma | Mean | Median | Sigma |
| A | 0 | 13 | 7302 | 63.74 | 540 | 532 | 106.2 |
| A | 13 | 254 | 5485 | 46.63 | 540 | 532 | 106.2 |
| A | 0 | 226 | 4710 | 39.33 | 540 | 532 | 106.2 |
| B | 12 | 111 | 11456 | 109.75 | 533 | 522 | 99.6 |
| B | 11 | 111 | 10445 | 99.6 | 533 | 522 | 99.6 |
| B | 14 | 111 | 9727 | 92.4 | 533 | 522 | 99.6 |
| C | 14 | 238 | 84112 | 713.18 | 509 | 516 | 117.2 |
| C | 3 | 233 | 60238 | 509.5 | 509 | 516 | 117.2 |
| C | 13 | 61 | 3467 | 25.18 | 509 | 516 | 117.2 |
| D | 1 | 52 | 355715 | 2868.43 | 516 | 506 | 123.8 |
| D | 8 | 195 | 23615 | 186.61 | 516 | 506 | 123.8 |
| D | 2 | 234 | 14004 | 109.0 | 516 | 506 | 123.8 |
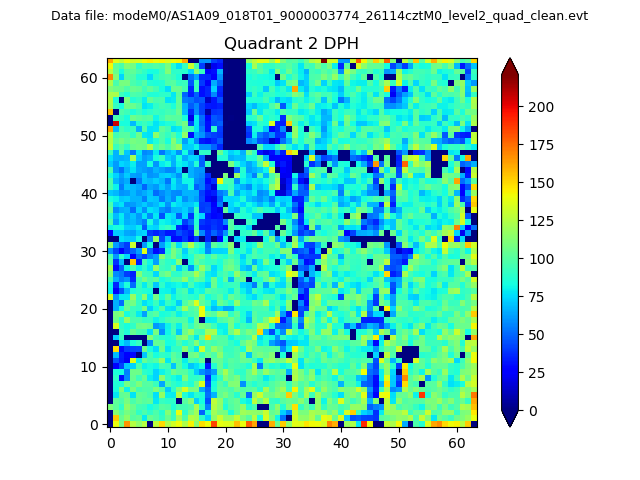
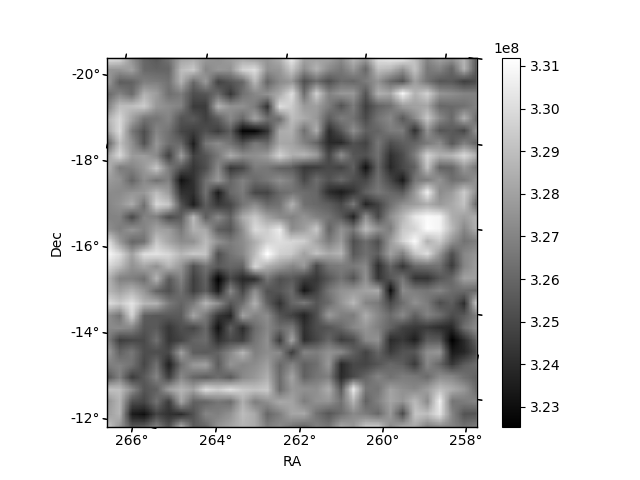
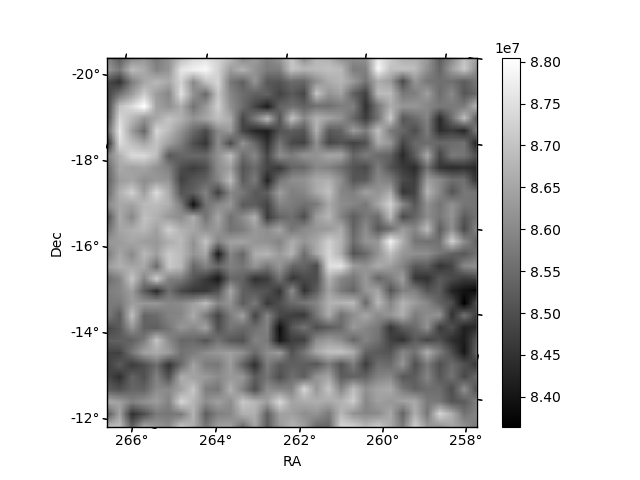
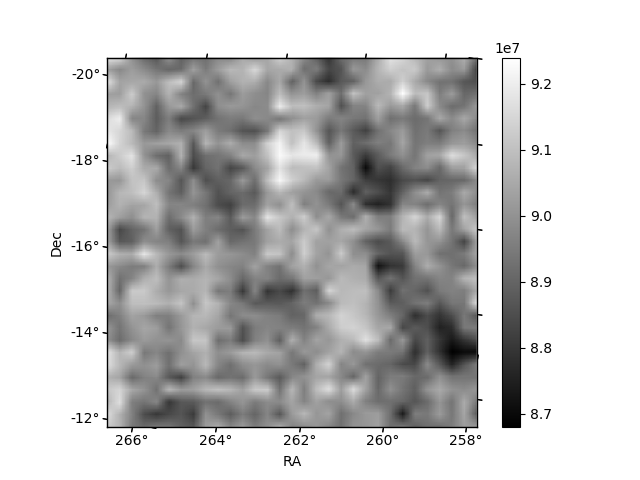
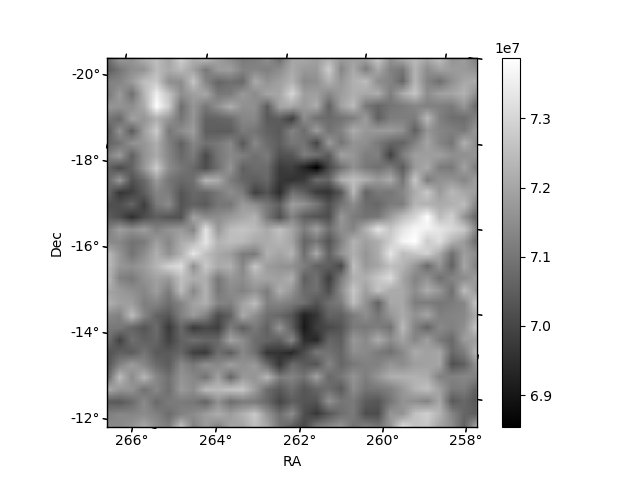
Histogram calculated using DETX and DETY for each event in the final _common_clean file
| Quadrant A |  |
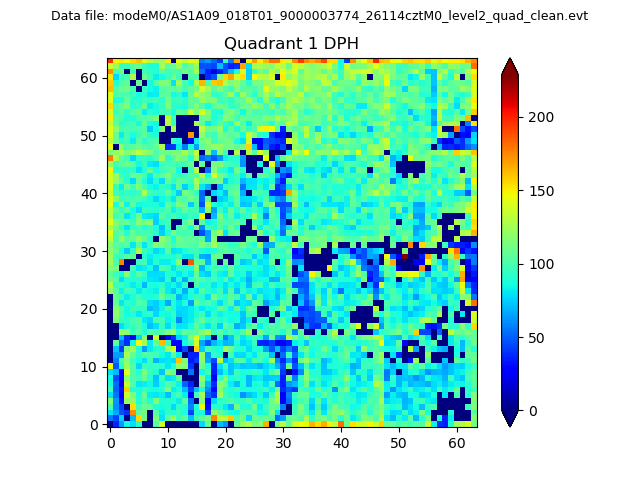 |
Quadrant B |
|---|---|---|---|
| Quadrant D | 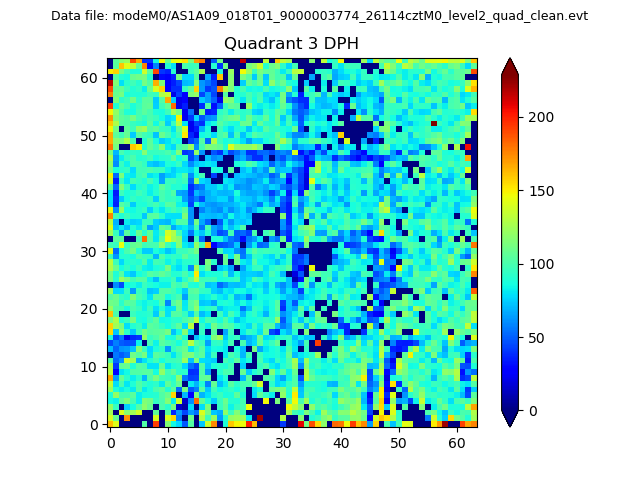 |
 |
Quadrant C |
| Plot type | Count rate plots | Images |
|---|---|---|
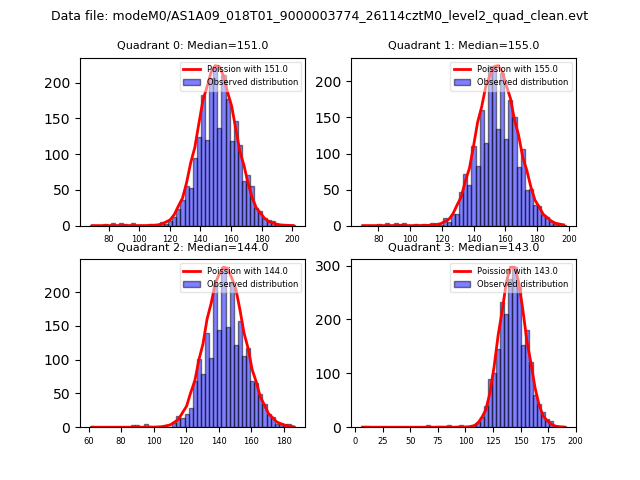
| Comparison with Poisson distribution Blue bars denote a histogram of data divided into 1 sec bins. Red curve is a Poisson curve with rate = median count rate of data. |
 |
 |
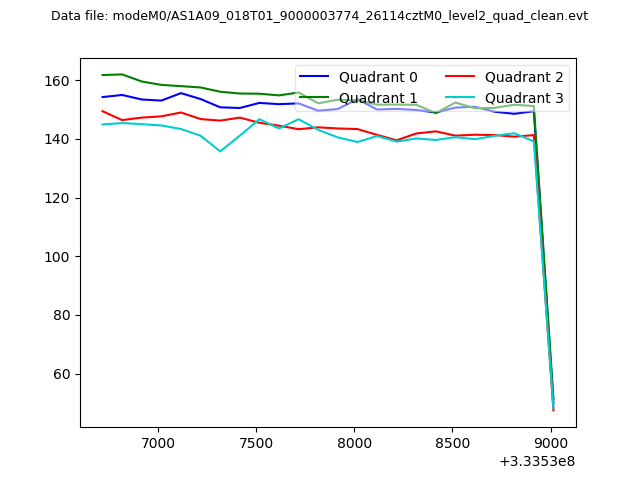
| Quadrant-wise count rates Data is divided into 100 sec bins |
 |
|
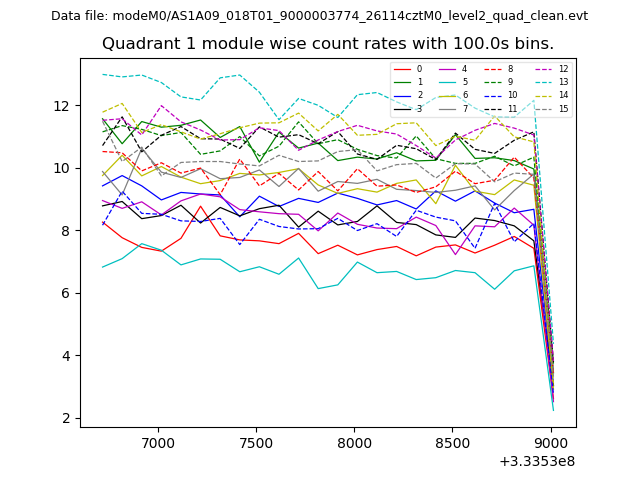
| Module-wise count rates for Quadrant A Data is divided into 100 sec bins |
 |
 |
| Module-wise count rates for Quadrant B Data is divided into 100 sec bins |
 |
 |
| Module-wise count rates for Quadrant C Data is divided into 100 sec bins |
 |
 |
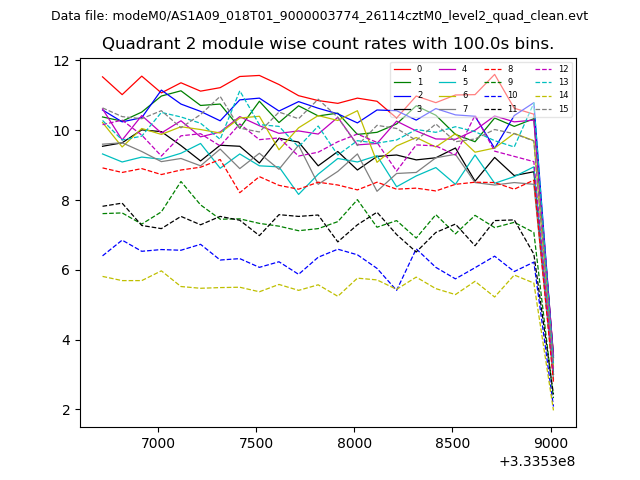
| Module-wise count rates for Quadrant D Data is divided into 100 sec bins |
 |
 |
| Parameter | Plot |
|---|---|
| CZT HV Monitor | 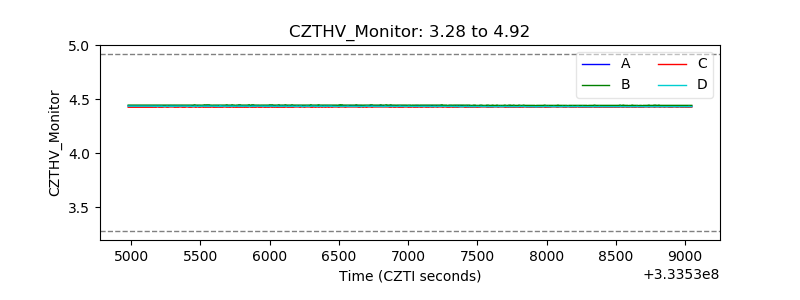 |
| D_VDD | 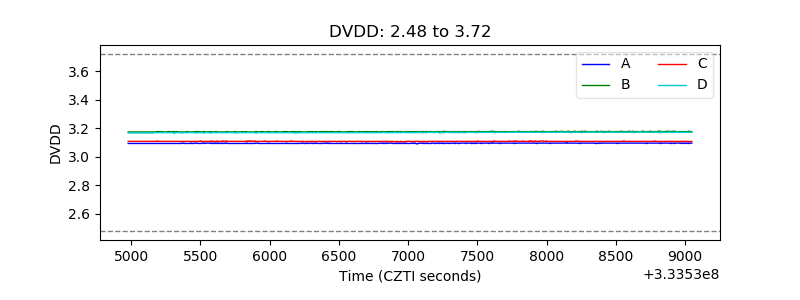 |
| Temperature 1 |  |
| Veto HV Monitor | 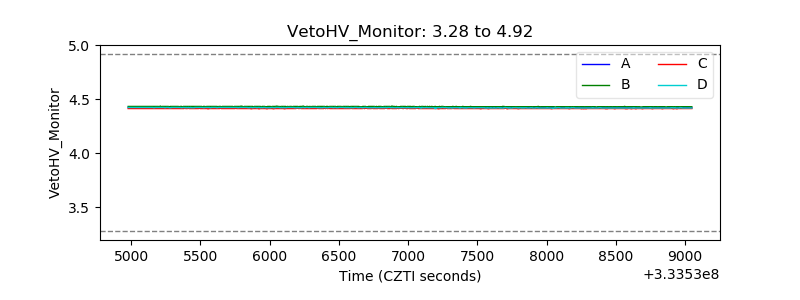 |
| Veto LLD |  |
| Alpha Counter | 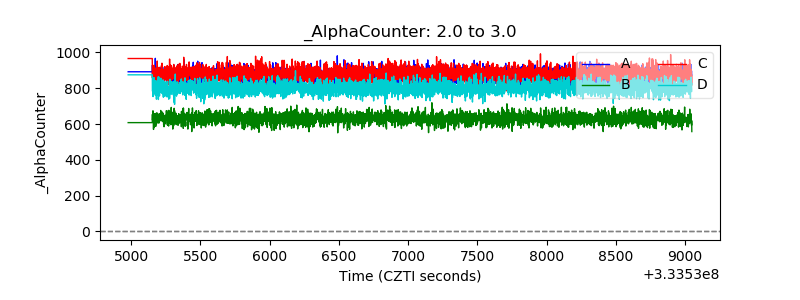 |
| _CPM_Rate | 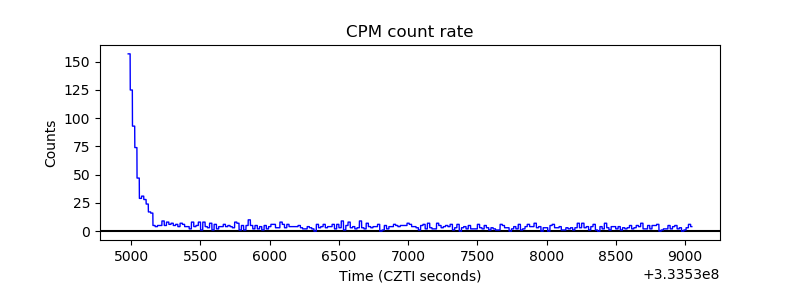 |
| CZT Counter | 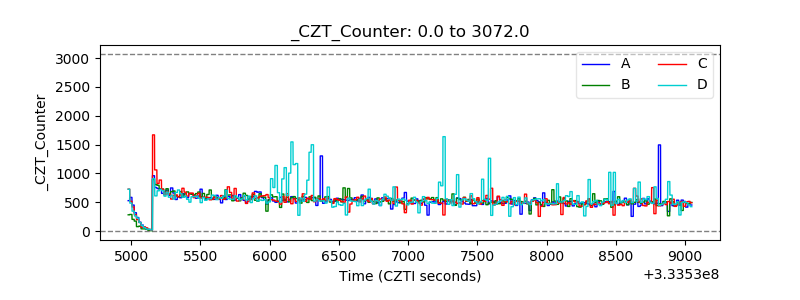 |
| +2.5 Volts monitor |  |
| +5 Volts monitor |  |
| _ROLL_ROT |  |
| _Roll_DEC | 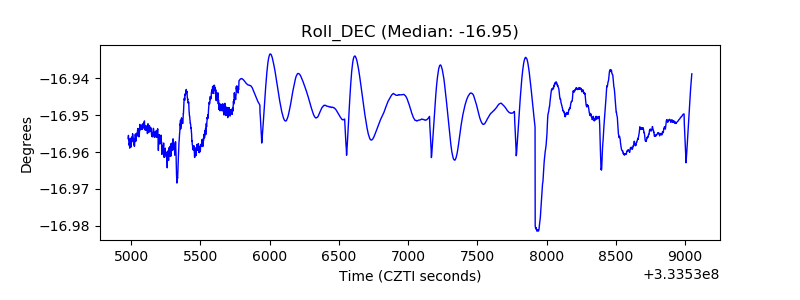 |
| _Roll_RA | 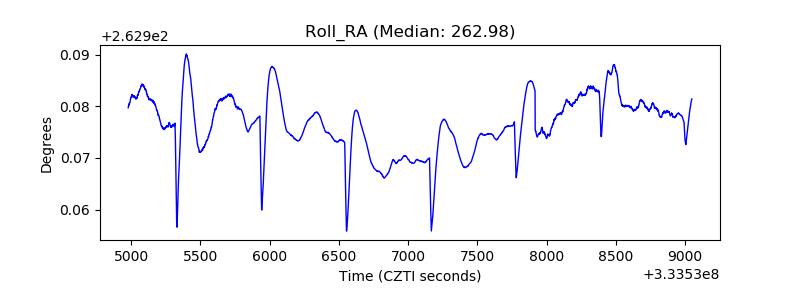 |
| Veto Counter | 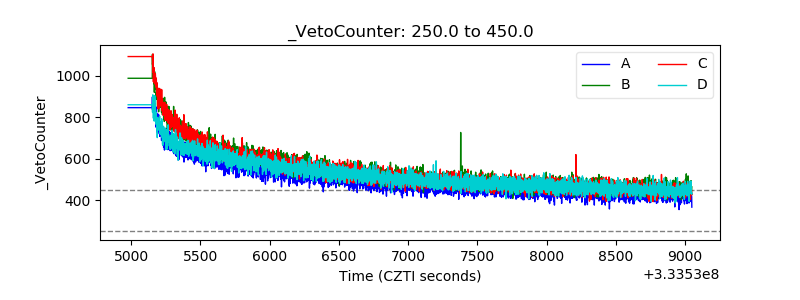 |