| Param | Original file | Final file |
|---|---|---|
| Filename | modeM0/AS1A09_126T01_9000003772cztM0_level2.fits | modeM0/AS1A09_126T01_9000003772cztM0_level2_quad_clean.evt |
| Size (bytes) | 360,339,840 | 340,920,000 |
| Size | 343.6 MB | 325.1 MB |
| Events in quadrant A | 2,265,202 | 2,100,287 |
| Events in quadrant B | 2,143,312 | 2,087,680 |
| Events in quadrant C | 2,169,898 | 1,972,324 |
| Events in quadrant D | 1,876,348 | 1,706,286 |
| Mode M0 | |||
|---|---|---|---|
| Quadrant | BADHDUFLAG | Total packets | Discarded packets |
| A | 0 | 76744 | 0 |
| B | 0 | 76289 | 0 |
| C | 0 | 75369 | 0 |
| D | 0 | 108263 | 0 |
| Mode SS | |||
|---|---|---|---|
| Quadrant | BADHDUFLAG | Total packets | Discarded packets |
| A | 0 | 732 | 0 |
| B | 0 | 732 | 0 |
| C | 0 | 732 | 0 |
| D | 0 | 732 | 0 |
| Mode M9 | |||
|---|---|---|---|
| Quadrant | BADHDUFLAG | Total packets | Discarded packets |
| A | 0 | 47 | 0 |
| B | 0 | 47 | 0 |
| C | 0 | 47 | 0 |
| D | 0 | 47 | 0 |
| Quadrant | Total seconds | Saturated seconds | Saturation percentage |
|---|---|---|---|
| A | 35766 | 563 | 1.574121% |
| B | 35766 | 697 | 1.948778% |
| C | 35766 | 843 | 2.356987% |
| D | 35766 | 2524 | 7.056981% |
Noise dominated data is calculated using 1-second bins in cleaned event files. If a bin has >2000 counts, and if more than 50% of those come from <1% of pixels, then it is considered to be noise-dominated and hence unusable.
| Quadrant | # 1 sec bins | Bins with >0 counts | Bins with >2000 counts | High rate bins dominated by noise | Noise dominated (total time) | Noise dominated (detector-on time) | Marked lightcurve |
|---|---|---|---|---|---|---|---|
| A | 40601 | 35762 | 0 | 0 | 0.00% | 0.00% |  |
| B | 40601 | 35760 | 0 | 0 | 0.00% | 0.00% |  |
| C | 40601 | 35760 | 0 | 0 | 0.00% | 0.00% |  |
| D | 40601 | 35717 | 0 | 0 | 0.00% | 0.00% |  |
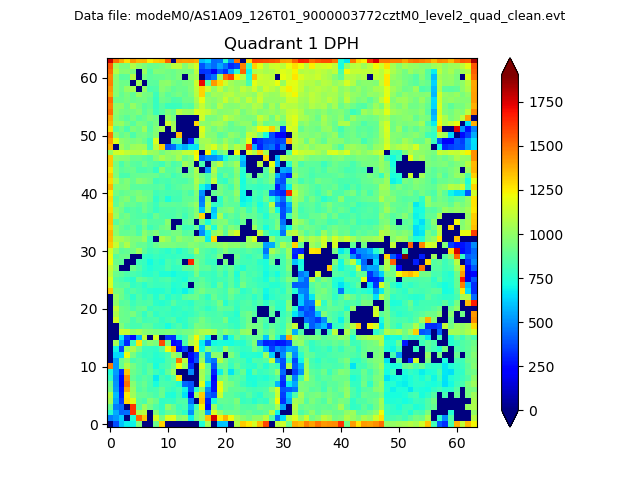
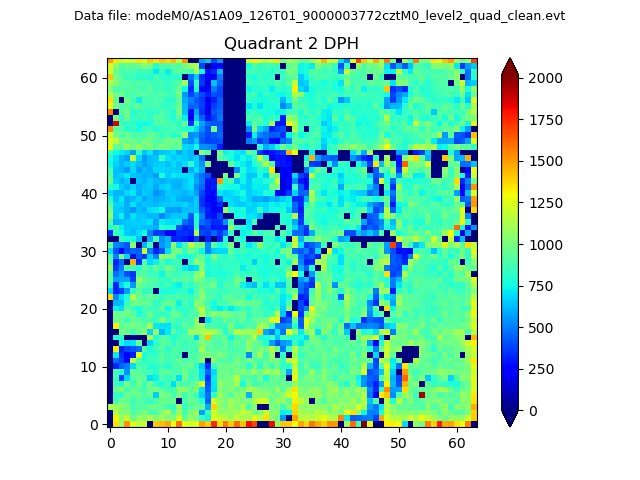
Top three noisy pixels from each quadrant. If the there are fewer than three noisy pixels in the level2.evt file, extra rows are filled as -1
| Pixel properties | Quadrant properties | ||||||
|---|---|---|---|---|---|---|---|
| Quadrant | DetID | PixID | Counts | Sigma | Mean | Median | Sigma |
| A | 0 | 29 | 1878 | 9.02 | 590 | 555 | 146.7 |
| A | 7 | 110 | 1813 | 8.57 | 590 | 555 | 146.7 |
| A | 9 | 19 | 1749 | 8.14 | 590 | 555 | 146.7 |
| B | 2 | 9 | 1702 | 10.41 | 566 | 541 | 111.5 |
| B | 2 | 8 | 1458 | 8.22 | 566 | 541 | 111.5 |
| B | 5 | 225 | 1404 | 7.74 | 566 | 541 | 111.5 |
| C | 1 | 80 | 1663 | 7.77 | 572 | 536 | 145.0 |
| C | 1 | 81 | 1645 | 7.65 | 572 | 536 | 145.0 |
| C | 12 | 241 | 1528 | 6.84 | 572 | 536 | 145.0 |
| D | 3 | 14 | 1420 | 6.44 | 535 | 488 | 144.6 |
| D | 7 | 3 | 1340 | 5.89 | 535 | 488 | 144.6 |
| D | 1 | 31 | 1306 | 5.65 | 535 | 488 | 144.6 |
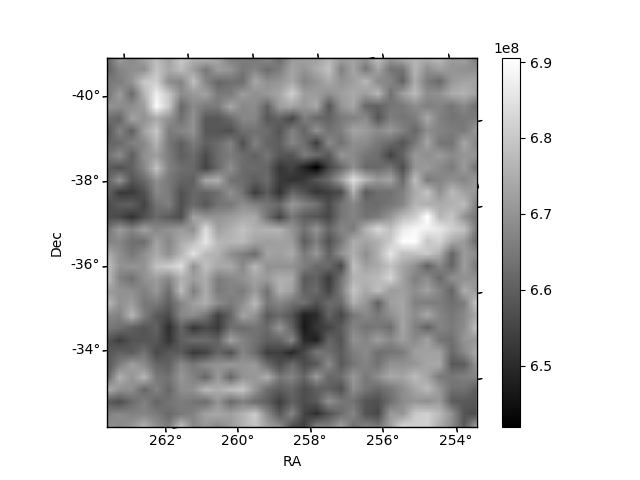
Histogram calculated using DETX and DETY for each event in the final _common_clean file
| Quadrant A |  |
 |
Quadrant B |
|---|---|---|---|
| Quadrant D | 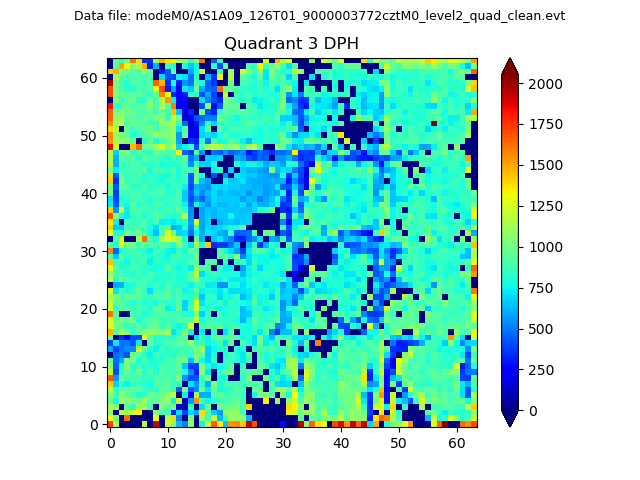 |
 |
Quadrant C |
| Plot type | Count rate plots | Images |
|---|---|---|
| Comparison with Poisson distribution Blue bars denote a histogram of data divided into 1 sec bins. Red curve is a Poisson curve with rate = median count rate of data. |
 |
 |
| Quadrant-wise count rates Data is divided into 100 sec bins |
 |
|
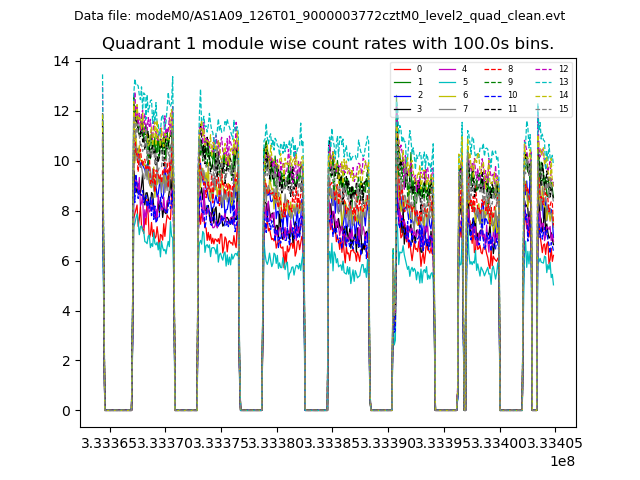
| Module-wise count rates for Quadrant A Data is divided into 100 sec bins |
 |
 |
| Module-wise count rates for Quadrant B Data is divided into 100 sec bins |
 |
 |
| Module-wise count rates for Quadrant C Data is divided into 100 sec bins |
 |
 |
| Module-wise count rates for Quadrant D Data is divided into 100 sec bins |
 |
 |
| Parameter | Plot |
|---|---|
| CZT HV Monitor |  |
| D_VDD |  |
| Temperature 1 |  |
| Veto HV Monitor | 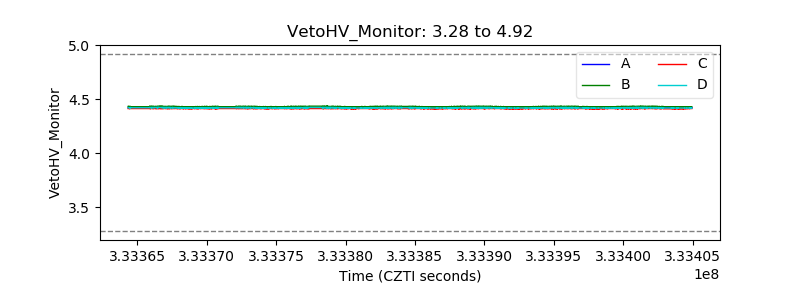 |
| Veto LLD | 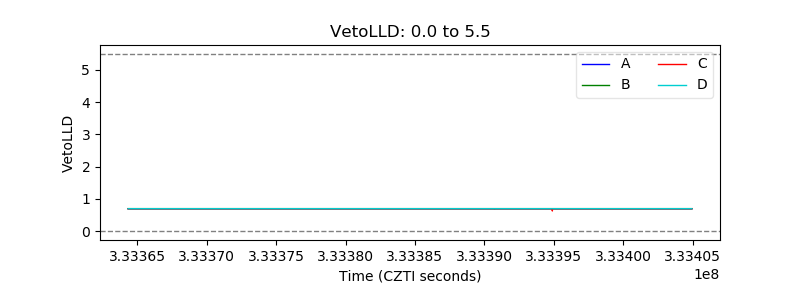 |
| Alpha Counter |  |
| _CPM_Rate |  |
| CZT Counter |  |
| +2.5 Volts monitor |  |
| +5 Volts monitor | 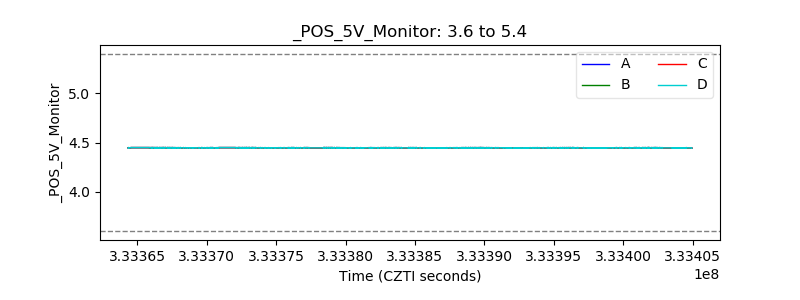 |
| _ROLL_ROT | 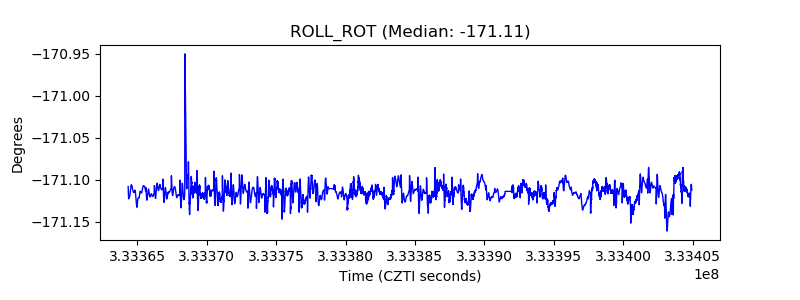 |
| _Roll_DEC |  |
| _Roll_RA | 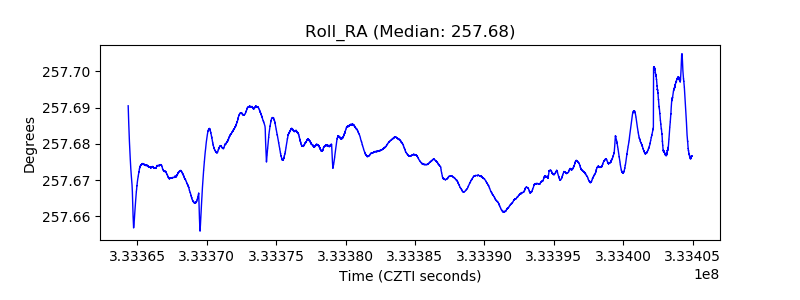 |
| Veto Counter |  |