| Param | Original file | Final file |
|---|---|---|
| Filename | modeM0/AS1A09_126T01_9000003772_26084cztM0_level2.evt | modeM0/AS1A09_126T01_9000003772_26084cztM0_level2_quad_clean.evt |
| Size (bytes) | 130,982,400 | 9,054,720 |
| Size | 124.9 MB | 8.6 MB |
| Events in quadrant A | 972,345 | 41,332 |
| Events in quadrant B | 942,469 | 41,824 |
| Events in quadrant C | 954,385 | 38,468 |
| Events in quadrant D | 992,058 | 39,491 |
| Mode M0 | |||
|---|---|---|---|
| Quadrant | BADHDUFLAG | Total packets | Discarded packets |
| A | 0 | 3997 | 0 |
| B | 0 | 3803 | 0 |
| C | 0 | 3910 | 0 |
| D | 0 | 3961 | 0 |
| Mode M9 | |||
|---|---|---|---|
| Quadrant | BADHDUFLAG | Total packets | Discarded packets |
| A | 0 | 13 | 0 |
| B | 0 | 13 | 0 |
| C | 0 | 13 | 0 |
| D | 0 | 13 | 0 |
| Quadrant | Total seconds | Saturated seconds | Saturation percentage |
|---|---|---|---|
| A | 1511 | 96 | 6.353408% |
| B | 1511 | 108 | 7.147584% |
| C | 1511 | 137 | 9.066843% |
| D | 1510 | 94 | 6.225166% |
Noise dominated data is calculated using 1-second bins in cleaned event files. If a bin has >2000 counts, and if more than 50% of those come from <1% of pixels, then it is considered to be noise-dominated and hence unusable.
| Quadrant | # 1 sec bins | Bins with >0 counts | Bins with >2000 counts | High rate bins dominated by noise | Noise dominated (total time) | Noise dominated (detector-on time) | Marked lightcurve |
|---|---|---|---|---|---|---|---|
| A | 2861 | 1511 | 0 | 0 | 0.00% | 0.00% | 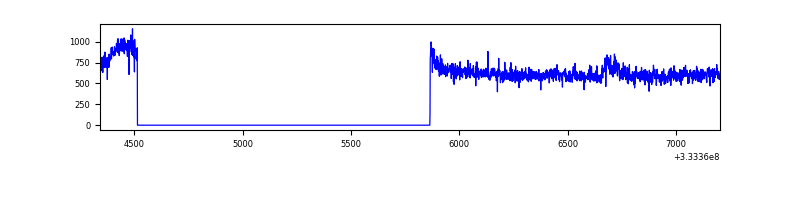 |
| B | 2861 | 1511 | 0 | 0 | 0.00% | 0.00% | 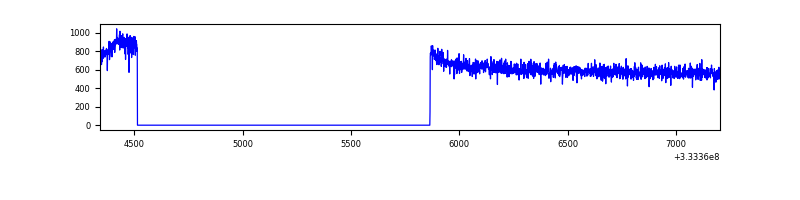 |
| C | 2861 | 1511 | 0 | 0 | 0.00% | 0.00% | 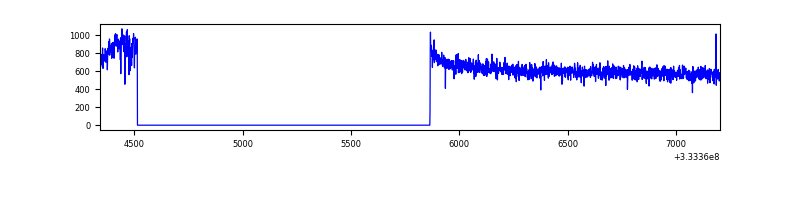 |
| D | 2860 | 1510 | 0 | 0 | 0.00% | 0.00% | 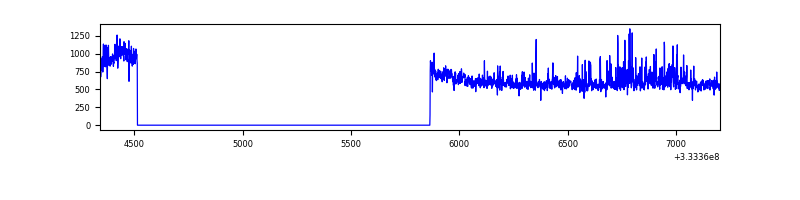 |
Top three noisy pixels from each quadrant. If the there are fewer than three noisy pixels in the level2.evt file, extra rows are filled as -1
| Pixel properties | Quadrant properties | ||||||
|---|---|---|---|---|---|---|---|
| Quadrant | DetID | PixID | Counts | Sigma | Mean | Median | Sigma |
| A | 0 | 13 | 29000 | 569.47 | 244 | 239 | 50.5 |
| A | 13 | 254 | 2177 | 38.37 | 244 | 239 | 50.5 |
| A | 0 | 226 | 2137 | 37.58 | 244 | 239 | 50.5 |
| B | 12 | 111 | 5309 | 107.81 | 241 | 235 | 47.1 |
| B | 11 | 111 | 4857 | 98.2 | 241 | 235 | 47.1 |
| B | 14 | 111 | 4695 | 94.76 | 241 | 235 | 47.1 |
| C | 14 | 238 | 37619 | 672.2 | 234 | 236 | 55.6 |
| C | 3 | 233 | 2907 | 48.03 | 234 | 236 | 55.6 |
| C | 13 | 61 | 1612 | 24.74 | 234 | 236 | 55.6 |
| D | 7 | 80 | 42683 | 732.8 | 239 | 233 | 57.9 |
| D | 1 | 52 | 41279 | 708.56 | 239 | 233 | 57.9 |
| D | 2 | 234 | 4480 | 73.31 | 239 | 233 | 57.9 |
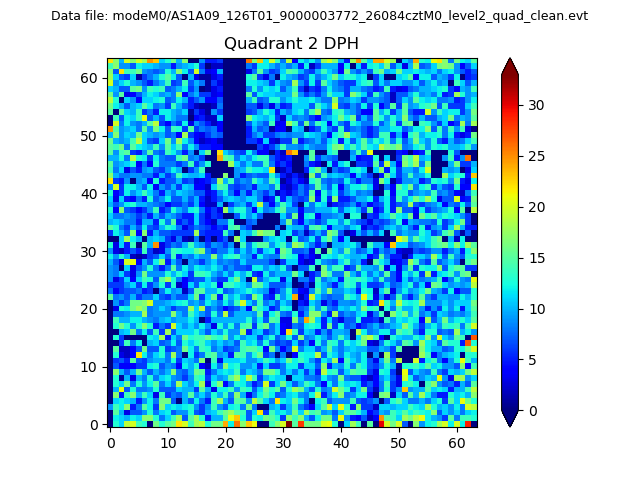
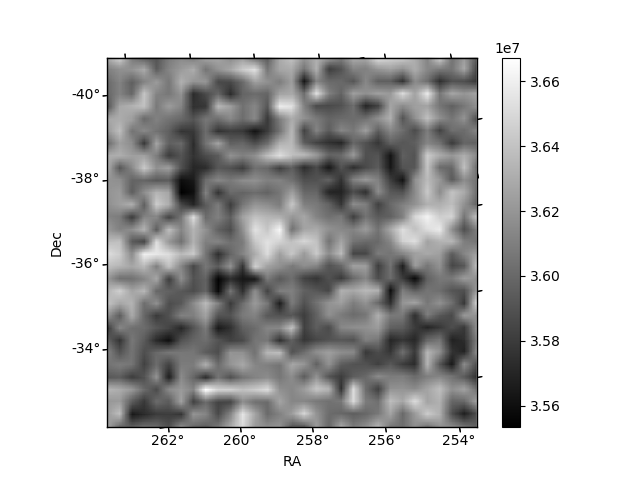
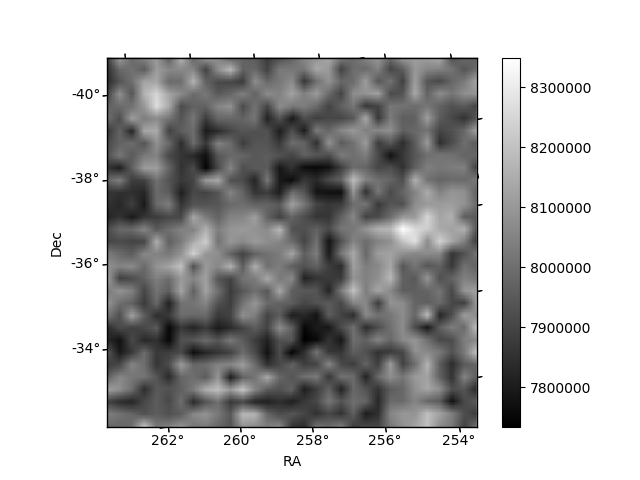
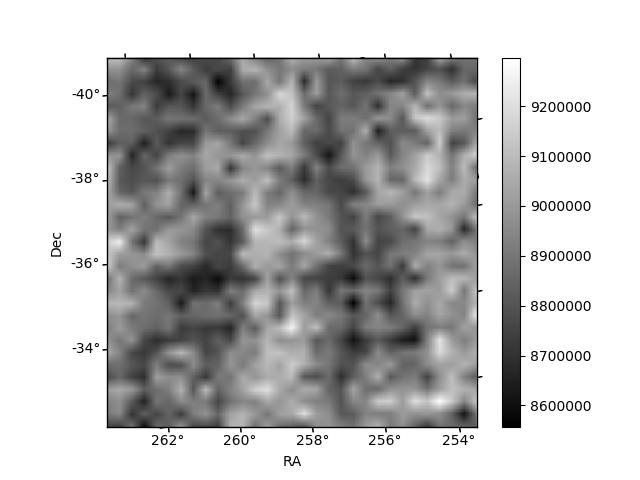
Histogram calculated using DETX and DETY for each event in the final _common_clean file
| Quadrant A | 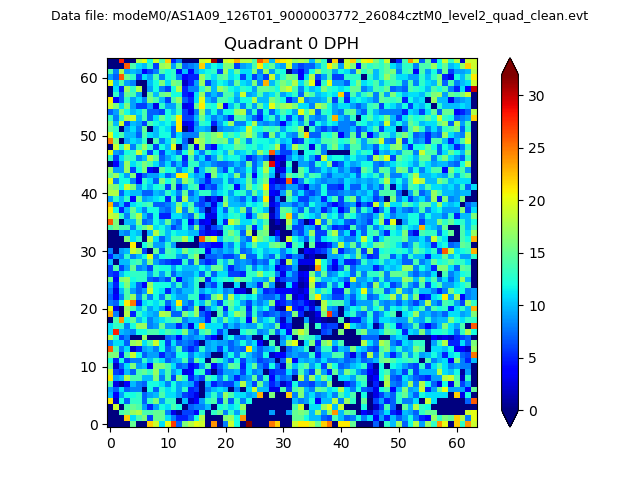 |
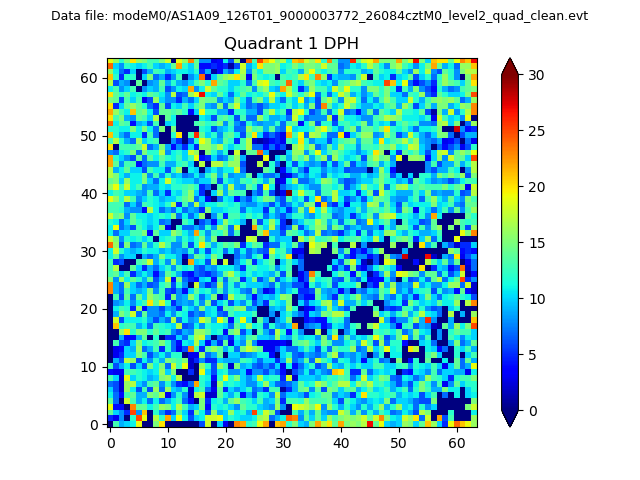 |
Quadrant B |
|---|---|---|---|
| Quadrant D | 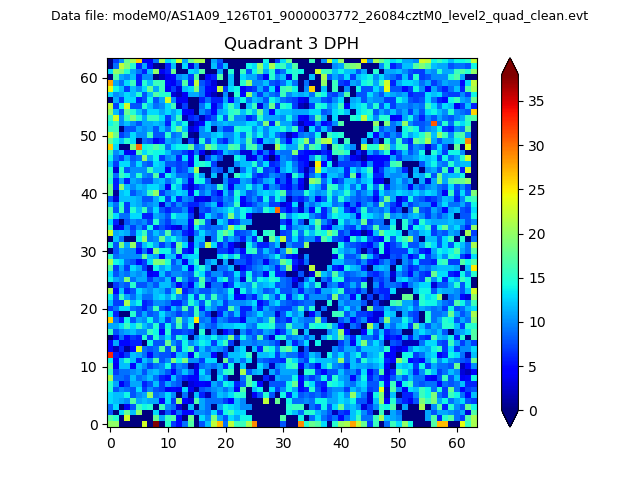 |
 |
Quadrant C |
| Plot type | Count rate plots | Images |
|---|---|---|
| Comparison with Poisson distribution Blue bars denote a histogram of data divided into 1 sec bins. Red curve is a Poisson curve with rate = median count rate of data. |
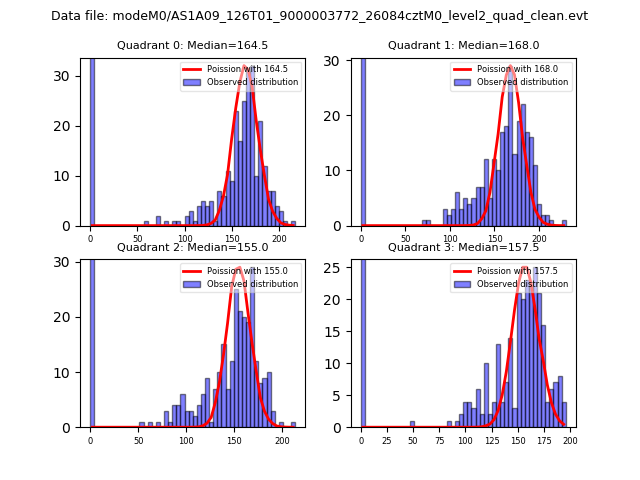 |
 |
| Quadrant-wise count rates Data is divided into 100 sec bins |
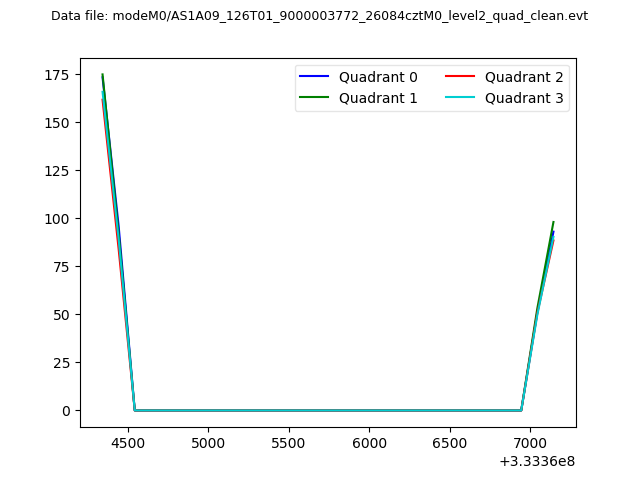 |
|
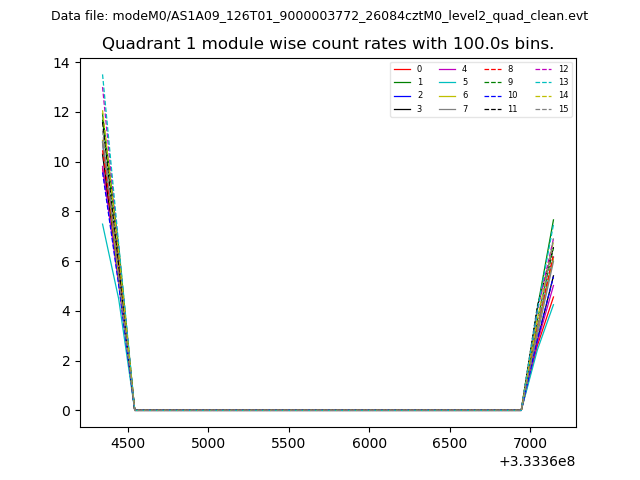
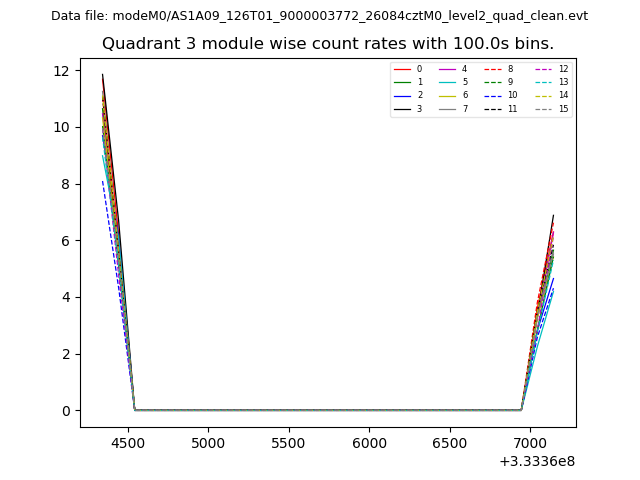
| Module-wise count rates for Quadrant A Data is divided into 100 sec bins |
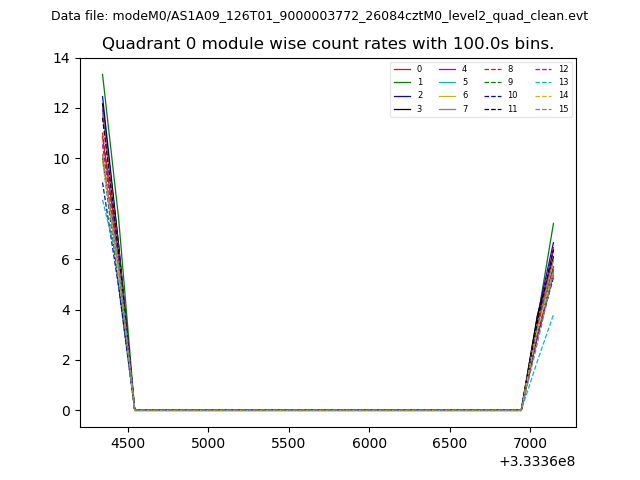 |
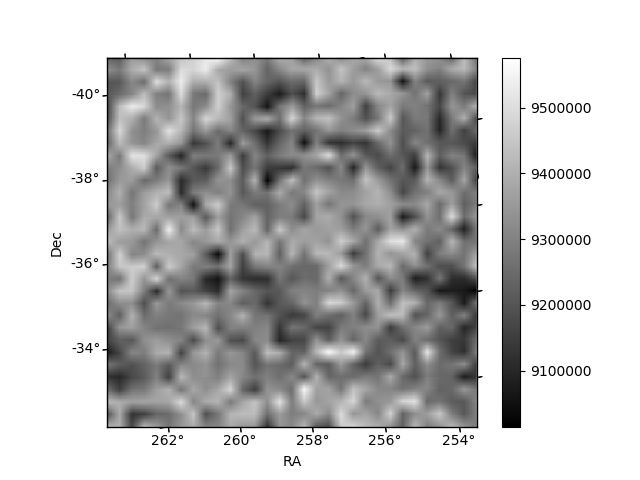 |
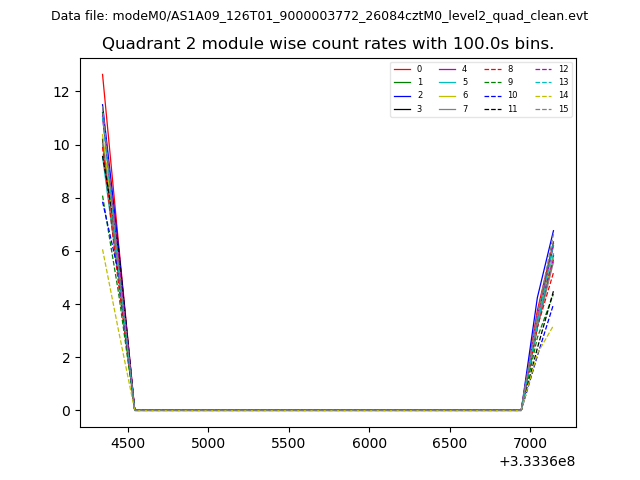
| Module-wise count rates for Quadrant B Data is divided into 100 sec bins |
 |
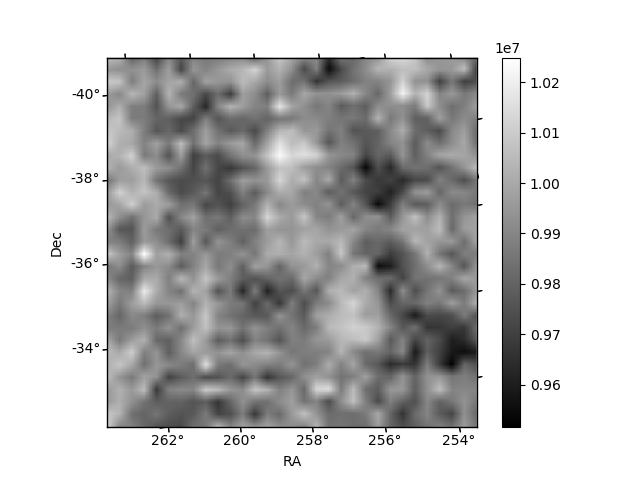 |
| Module-wise count rates for Quadrant C Data is divided into 100 sec bins |
 |
 |
| Module-wise count rates for Quadrant D Data is divided into 100 sec bins |
 |
 |
| Parameter | Plot |
|---|---|
| CZT HV Monitor | 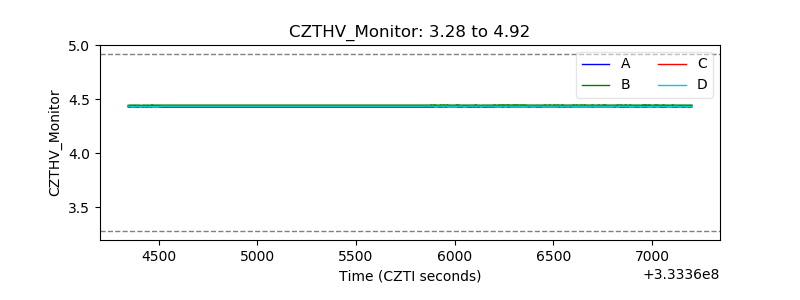 |
| D_VDD | 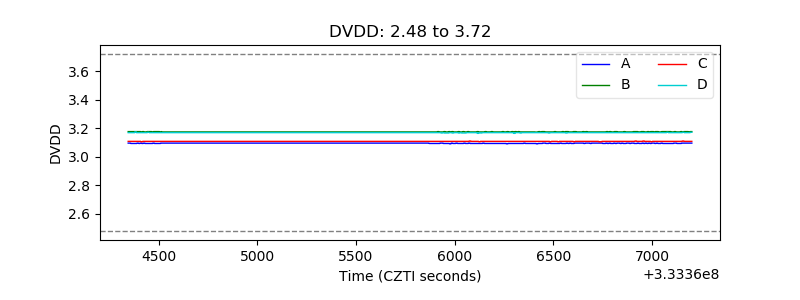 |
| Temperature 1 | 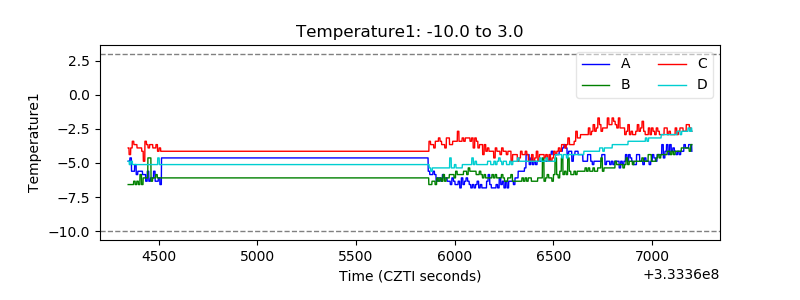 |
| Veto HV Monitor | 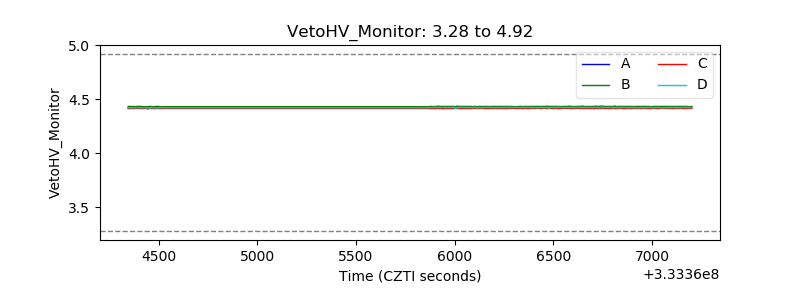 |
| Veto LLD | 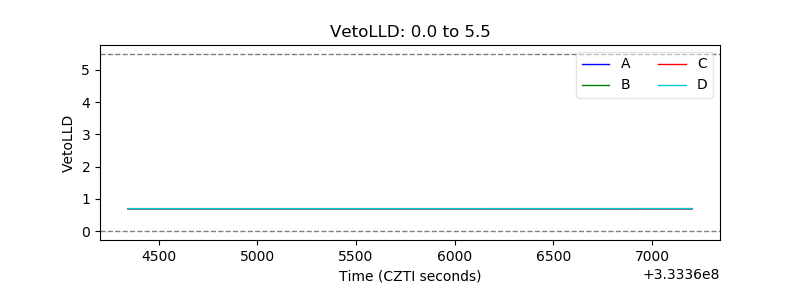 |
| Alpha Counter | 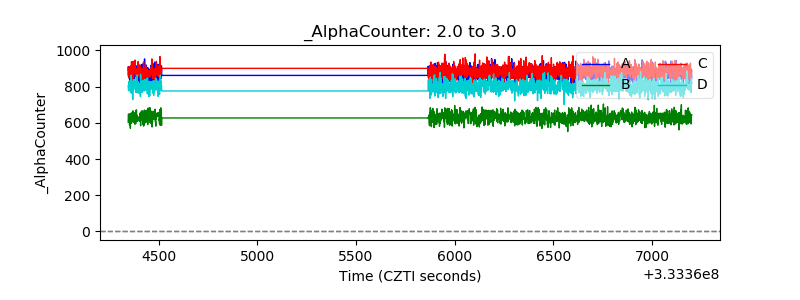 |
| _CPM_Rate | 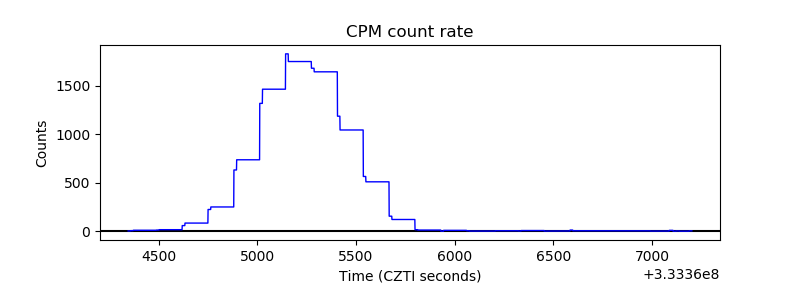 |
| CZT Counter | 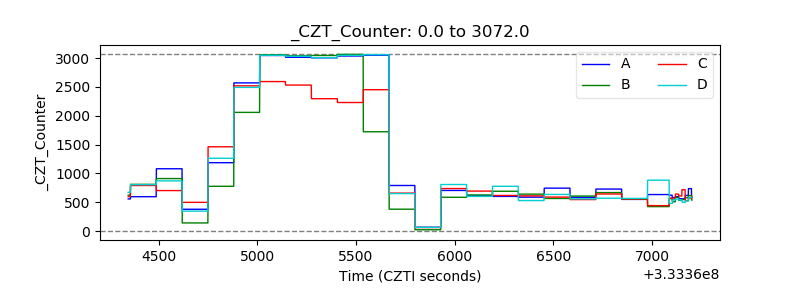 |
| +2.5 Volts monitor |  |
| +5 Volts monitor |  |
| _ROLL_ROT | 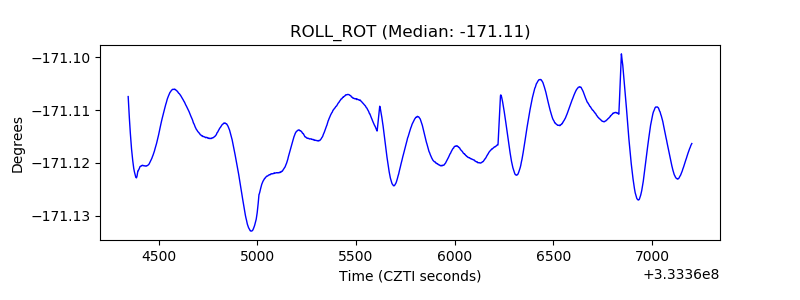 |
| _Roll_DEC | 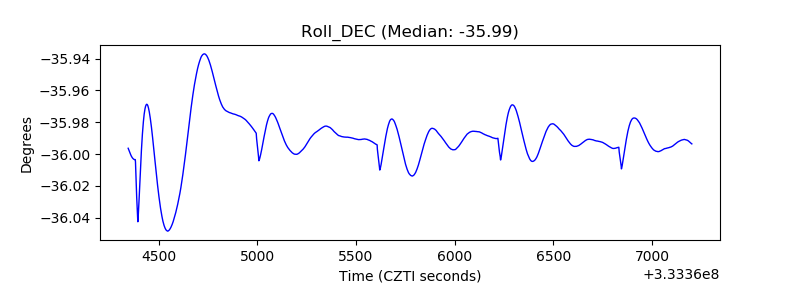 |
| _Roll_RA | 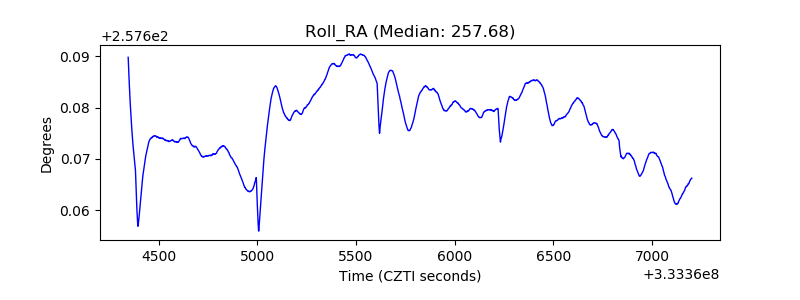 |
| Veto Counter | 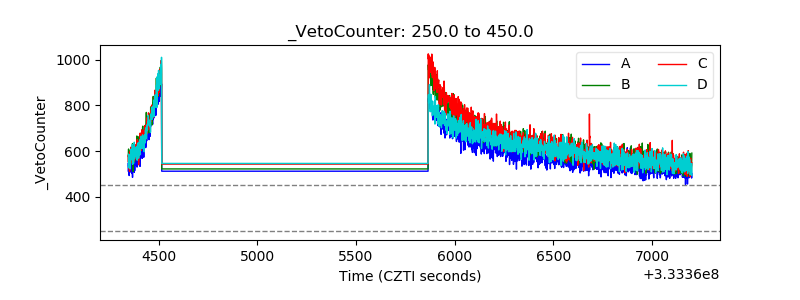 |