| Param | Original file | Final file |
|---|---|---|
| Filename | modeM0/AS1A09_126T01_9000003772_26086cztM0_level2.evt | modeM0/AS1A09_126T01_9000003772_26086cztM0_level2_quad_clean.evt |
| Size (bytes) | 827,429,760 | 185,627,520 |
| Size | 789.1 MB | 177.0 MB |
| Events in quadrant A | 6,239,416 | 1,235,551 |
| Events in quadrant B | 5,864,541 | 1,250,127 |
| Events in quadrant C | 5,724,429 | 1,185,238 |
| Events in quadrant D | 6,477,698 | 1,181,708 |
| Mode M0 | |||
|---|---|---|---|
| Quadrant | BADHDUFLAG | Total packets | Discarded packets |
| A | 0 | 25239 | 0 |
| B | 0 | 23810 | 0 |
| C | 0 | 23655 | 0 |
| D | 0 | 26437 | 0 |
| Mode M9 | |||
|---|---|---|---|
| Quadrant | BADHDUFLAG | Total packets | Discarded packets |
| A | 0 | 22 | 0 |
| B | 0 | 22 | 0 |
| C | 0 | 22 | 0 |
| D | 0 | 22 | 0 |
| Quadrant | Total seconds | Saturated seconds | Saturation percentage |
|---|---|---|---|
| A | 11127 | 194 | 1.743507% |
| B | 11127 | 204 | 1.833378% |
| C | 11128 | 268 | 2.408339% |
| D | 11128 | 154 | 1.383896% |
Noise dominated data is calculated using 1-second bins in cleaned event files. If a bin has >2000 counts, and if more than 50% of those come from <1% of pixels, then it is considered to be noise-dominated and hence unusable.
| Quadrant | # 1 sec bins | Bins with >0 counts | Bins with >2000 counts | High rate bins dominated by noise | Noise dominated (total time) | Noise dominated (detector-on time) | Marked lightcurve |
|---|---|---|---|---|---|---|---|
| A | 13287 | 11127 | 12 | 12 | 0.09% | 0.11% | 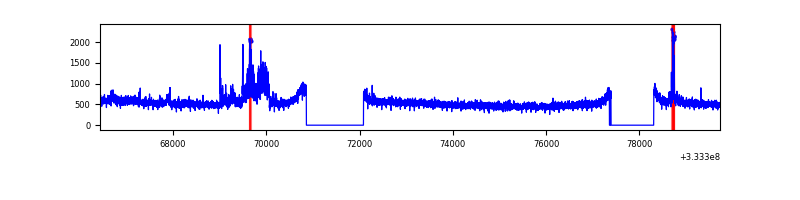 |
| B | 13287 | 11128 | 3 | 3 | 0.02% | 0.03% | 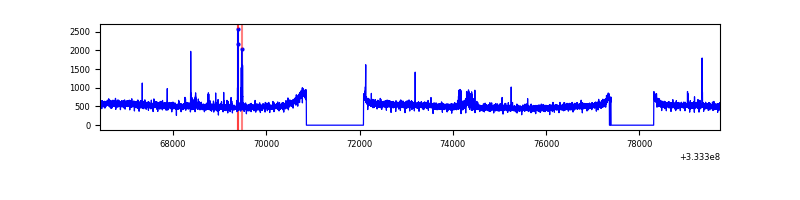 |
| C | 13288 | 11128 | 0 | 0 | 0.00% | 0.00% | 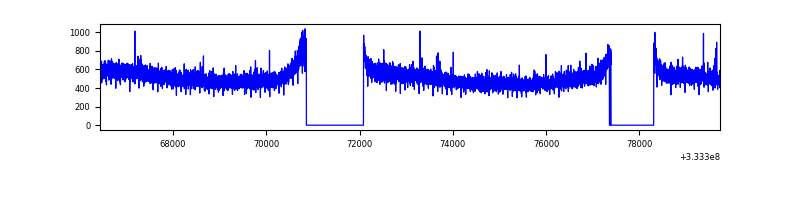 |
| D | 13288 | 11129 | 15 | 15 | 0.11% | 0.13% | 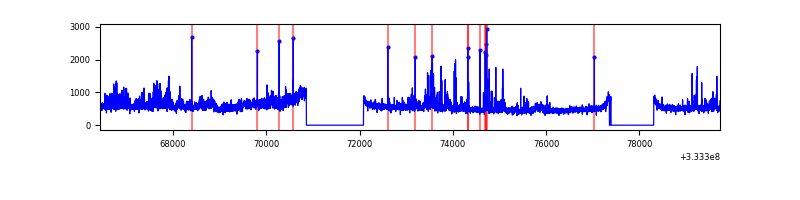 |
Top three noisy pixels from each quadrant. If the there are fewer than three noisy pixels in the level2.evt file, extra rows are filled as -1
| Pixel properties | Quadrant properties | ||||||
|---|---|---|---|---|---|---|---|
| Quadrant | DetID | PixID | Counts | Sigma | Mean | Median | Sigma |
| A | 0 | 13 | 440064 | 1492.47 | 1486 | 1462 | 293.9 |
| A | 5 | 98 | 73051 | 243.6 | 1486 | 1462 | 293.9 |
| A | 13 | 254 | 15989 | 49.43 | 1486 | 1462 | 293.9 |
| B | 0 | 190 | 55278 | 196.46 | 1462 | 1430 | 274.1 |
| B | 12 | 111 | 32341 | 112.78 | 1462 | 1430 | 274.1 |
| B | 11 | 111 | 29865 | 103.75 | 1462 | 1430 | 274.1 |
| C | 14 | 238 | 229653 | 702.48 | 1404 | 1416 | 324.9 |
| C | 3 | 233 | 20323 | 58.19 | 1404 | 1416 | 324.9 |
| C | 13 | 61 | 9665 | 25.39 | 1404 | 1416 | 324.9 |
| D | 7 | 80 | 672990 | 1983.06 | 1435 | 1406 | 338.7 |
| D | 1 | 52 | 216132 | 634.05 | 1435 | 1406 | 338.7 |
| D | 12 | 233 | 117163 | 341.81 | 1435 | 1406 | 338.7 |
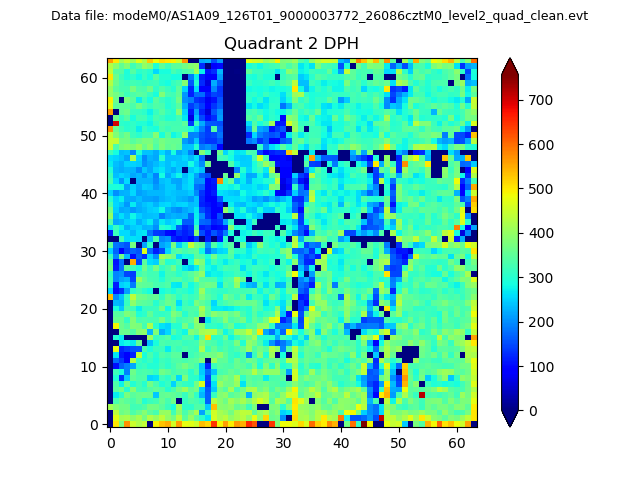
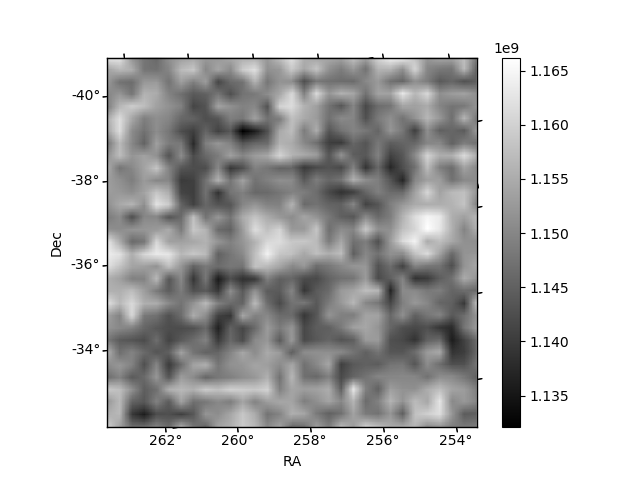
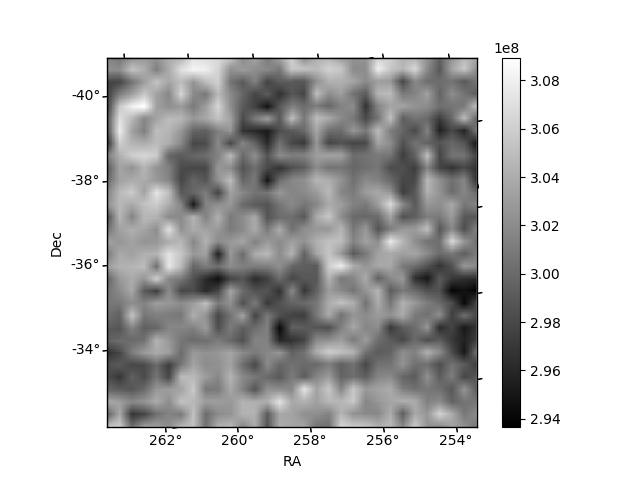
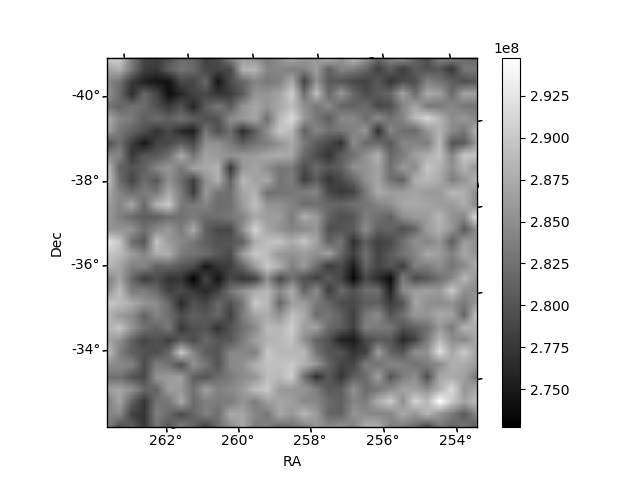
Histogram calculated using DETX and DETY for each event in the final _common_clean file
| Quadrant A | 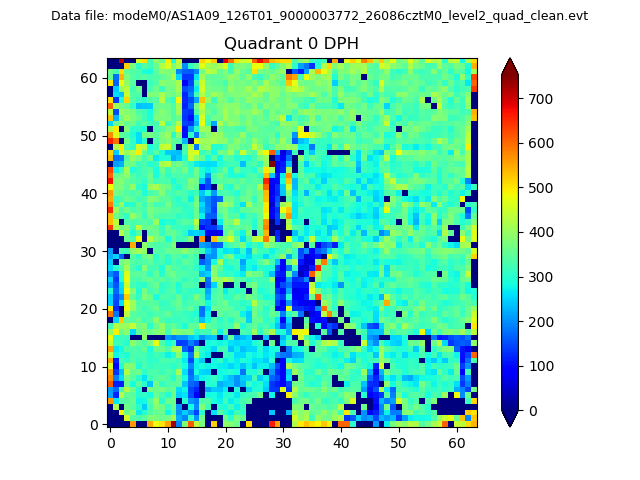 |
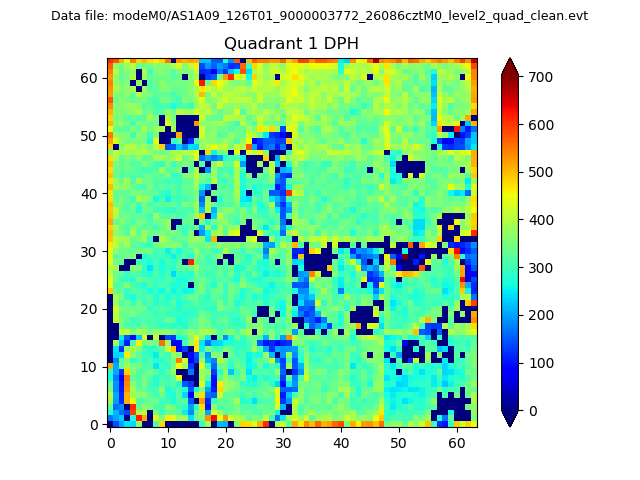 |
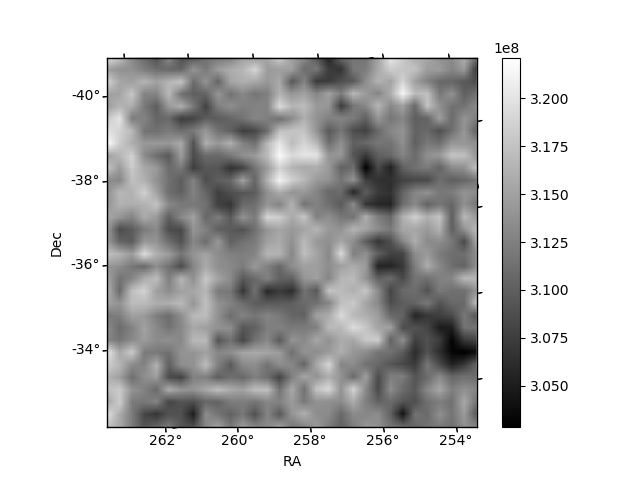
Quadrant B |
|---|---|---|---|
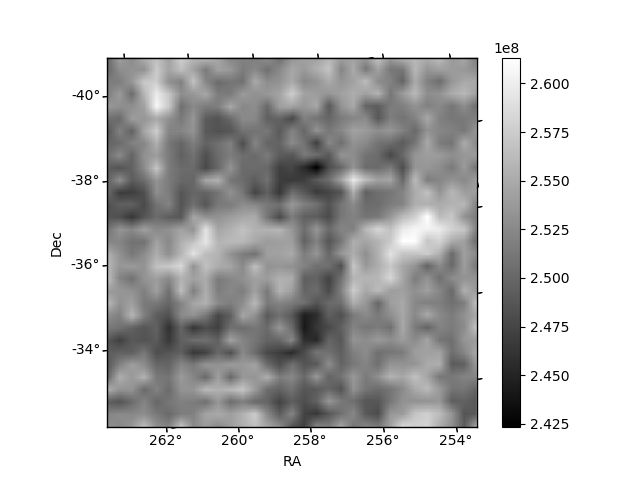
| Quadrant D | 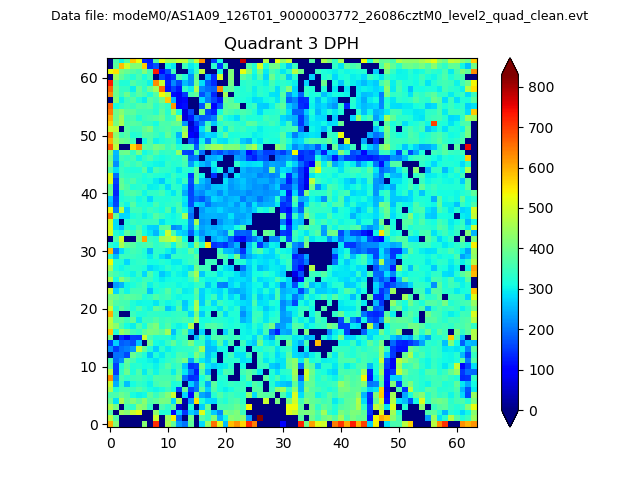 |
 |
Quadrant C |
| Plot type | Count rate plots | Images |
|---|---|---|
| Comparison with Poisson distribution Blue bars denote a histogram of data divided into 1 sec bins. Red curve is a Poisson curve with rate = median count rate of data. |
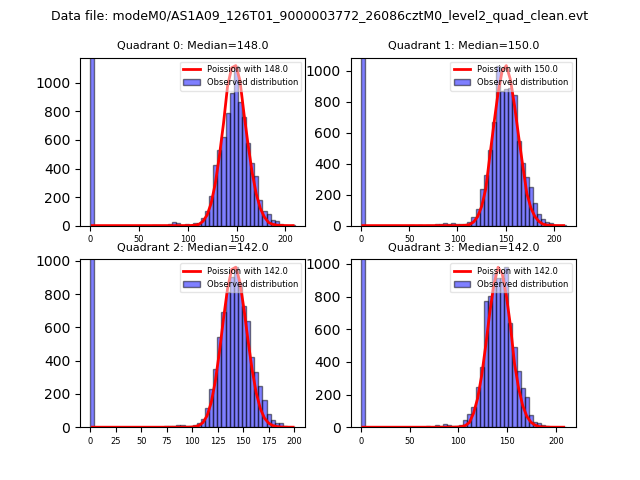 |
 |
| Quadrant-wise count rates Data is divided into 100 sec bins |
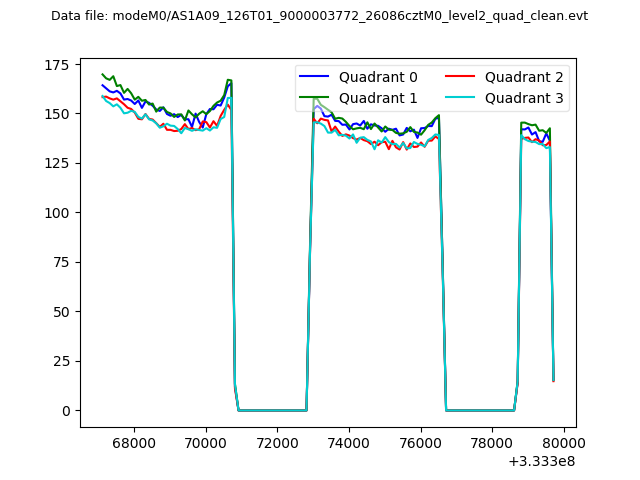 |
|
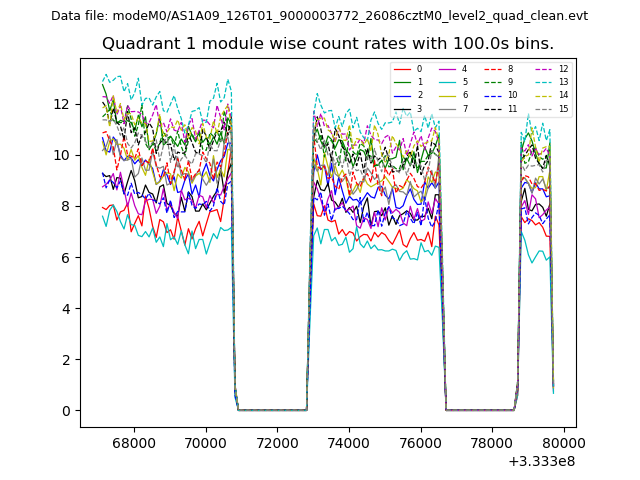
| Module-wise count rates for Quadrant A Data is divided into 100 sec bins |
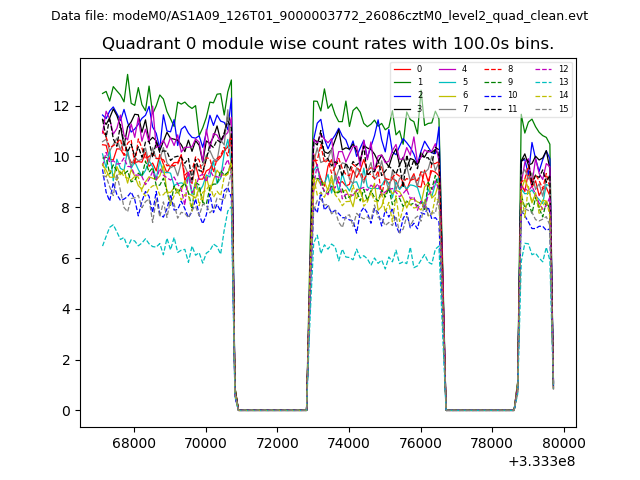 |
 |
| Module-wise count rates for Quadrant B Data is divided into 100 sec bins |
 |
 |
| Module-wise count rates for Quadrant C Data is divided into 100 sec bins |
 |
 |
| Module-wise count rates for Quadrant D Data is divided into 100 sec bins |
 |
 |
| Parameter | Plot |
|---|---|
| CZT HV Monitor |  |
| D_VDD | 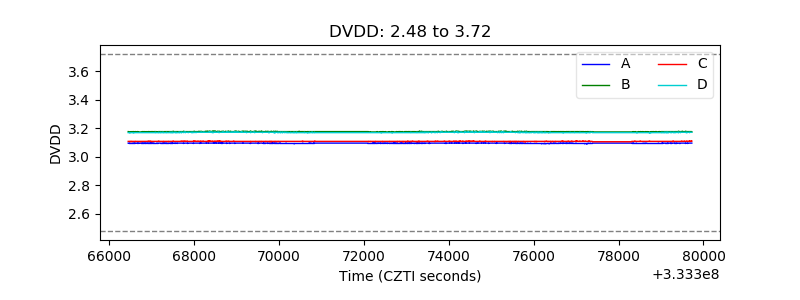 |
| Temperature 1 | 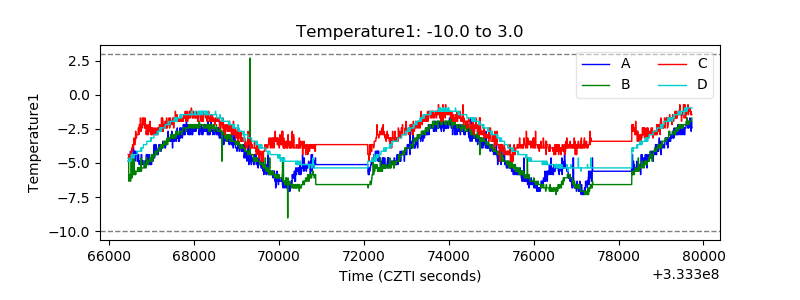 |
| Veto HV Monitor |  |
| Veto LLD | 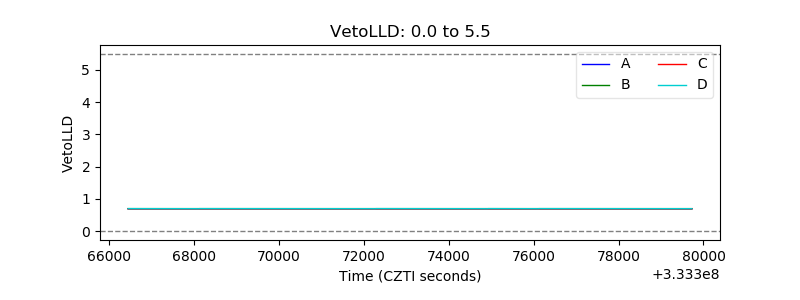 |
| Alpha Counter | 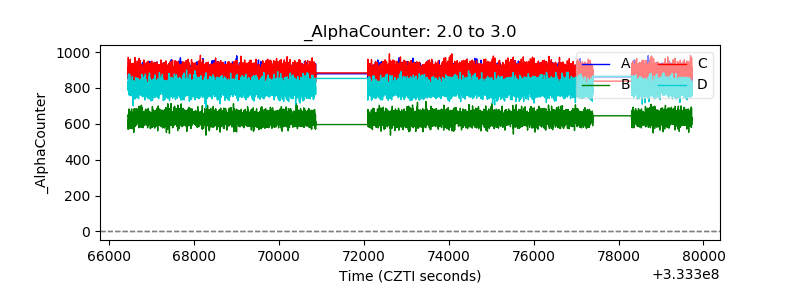 |
| _CPM_Rate | 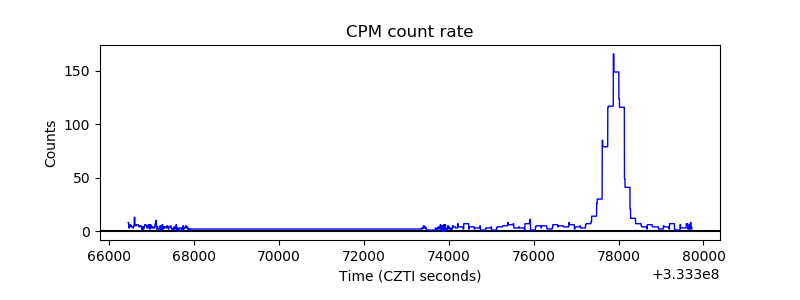 |
| CZT Counter | 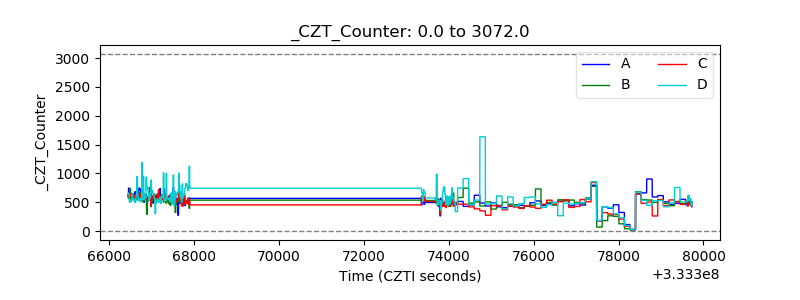 |
| +2.5 Volts monitor | 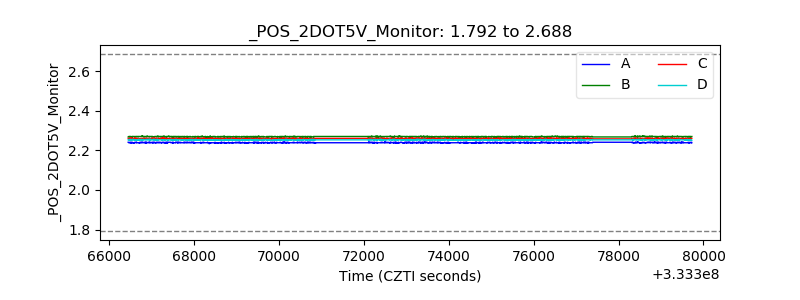 |
| +5 Volts monitor |  |
| _ROLL_ROT |  |
| _Roll_DEC |  |
| _Roll_RA | 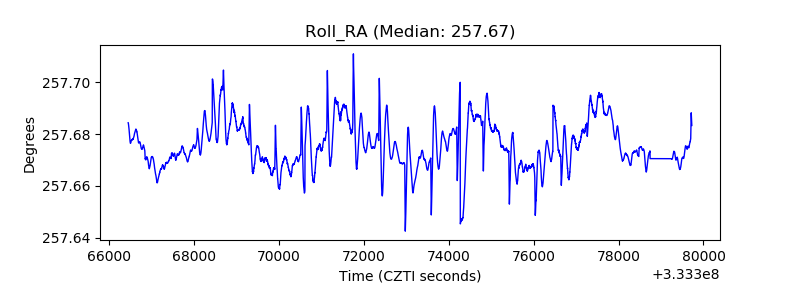 |
| Veto Counter |  |