| Param | Original file | Final file |
|---|---|---|
| Filename | modeM0/AS1A09_126T01_9000003772_26087cztM0_level2.evt | modeM0/AS1A09_126T01_9000003772_26087cztM0_level2_quad_clean.evt |
| Size (bytes) | 518,336,640 | 105,189,120 |
| Size | 494.3 MB | 100.3 MB |
| Events in quadrant A | 3,678,873 | 683,405 |
| Events in quadrant B | 3,835,163 | 688,305 |
| Events in quadrant C | 3,599,077 | 656,733 |
| Events in quadrant D | 4,090,714 | 650,838 |
| Mode M0 | |||
|---|---|---|---|
| Quadrant | BADHDUFLAG | Total packets | Discarded packets |
| A | 0 | 15453 | 0 |
| B | 0 | 15806 | 0 |
| C | 0 | 15227 | 0 |
| D | 0 | 16803 | 0 |
| Mode M9 | |||
|---|---|---|---|
| Quadrant | BADHDUFLAG | Total packets | Discarded packets |
| A | 0 | 8 | 0 |
| B | 0 | 9 | 0 |
| C | 0 | 9 | 0 |
| D | 0 | 9 | 0 |
| Quadrant | Total seconds | Saturated seconds | Saturation percentage |
|---|---|---|---|
| A | 7273 | 166 | 2.282414% |
| B | 7272 | 185 | 2.544004% |
| C | 7272 | 192 | 2.640264% |
| D | 7272 | 196 | 2.695270% |
Noise dominated data is calculated using 1-second bins in cleaned event files. If a bin has >2000 counts, and if more than 50% of those come from <1% of pixels, then it is considered to be noise-dominated and hence unusable.
| Quadrant | # 1 sec bins | Bins with >0 counts | Bins with >2000 counts | High rate bins dominated by noise | Noise dominated (total time) | Noise dominated (detector-on time) | Marked lightcurve |
|---|---|---|---|---|---|---|---|
| A | 7678 | 7273 | 8 | 8 | 0.10% | 0.11% | 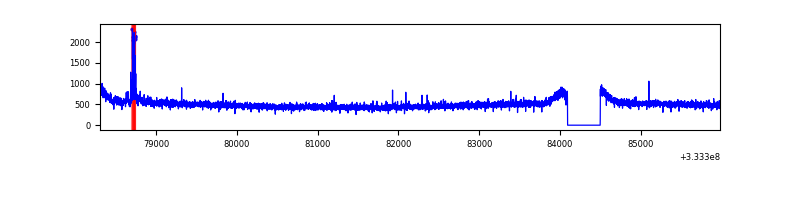 |
| B | 7677 | 7272 | 4 | 4 | 0.05% | 0.06% | 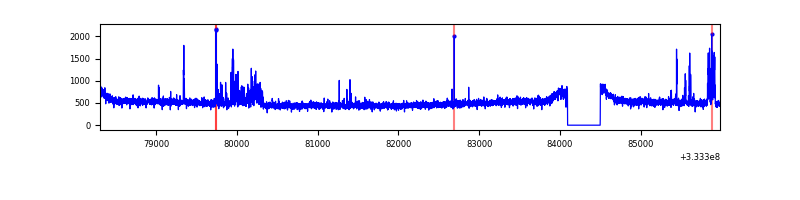 |
| C | 7677 | 7272 | 0 | 0 | 0.00% | 0.00% | 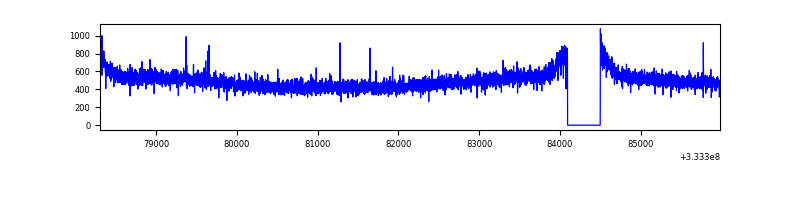 |
| D | 7676 | 7271 | 72 | 72 | 0.94% | 0.99% | 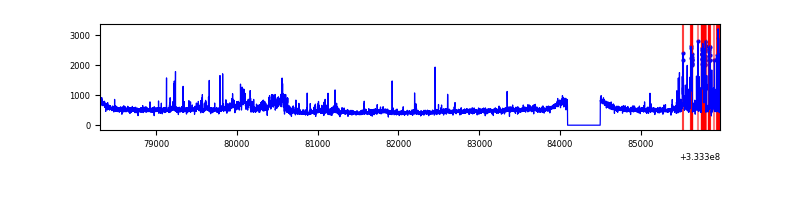 |
Top three noisy pixels from each quadrant. If the there are fewer than three noisy pixels in the level2.evt file, extra rows are filled as -1
| Pixel properties | Quadrant properties | ||||||
|---|---|---|---|---|---|---|---|
| Quadrant | DetID | PixID | Counts | Sigma | Mean | Median | Sigma |
| A | 5 | 98 | 72079 | 377.47 | 935 | 914 | 188.5 |
| A | 13 | 254 | 11821 | 57.85 | 935 | 914 | 188.5 |
| A | 3 | 137 | 8734 | 41.48 | 935 | 914 | 188.5 |
| B | 15 | 33 | 167250 | 940.83 | 921 | 899 | 176.8 |
| B | 12 | 111 | 21717 | 117.74 | 921 | 899 | 176.8 |
| B | 0 | 190 | 21487 | 116.44 | 921 | 899 | 176.8 |
| C | 14 | 238 | 142438 | 680.73 | 884 | 891 | 207.9 |
| C | 3 | 233 | 10114 | 44.36 | 884 | 891 | 207.9 |
| C | 2 | 16 | 7393 | 31.27 | 884 | 891 | 207.9 |
| D | 1 | 52 | 383392 | 1782.85 | 901 | 881 | 214.6 |
| D | 7 | 80 | 166368 | 771.32 | 901 | 881 | 214.6 |
| D | 12 | 1 | 89165 | 411.48 | 901 | 881 | 214.6 |
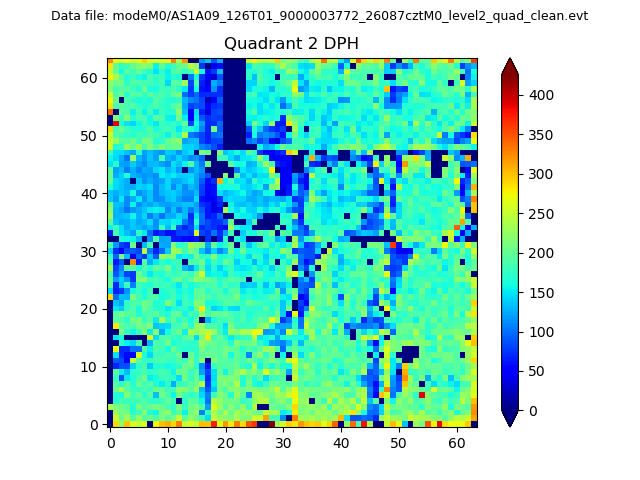
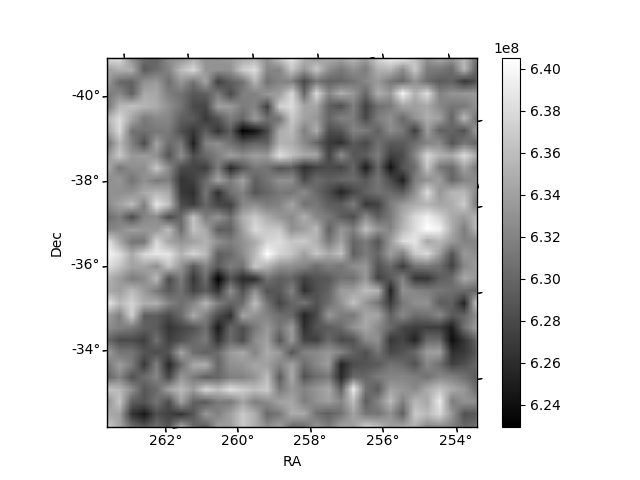
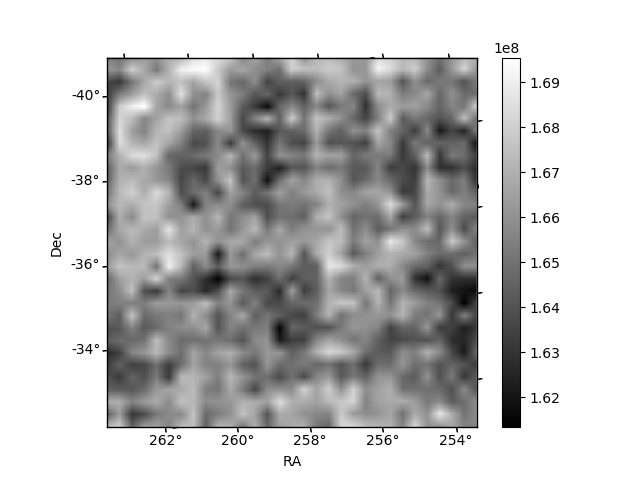
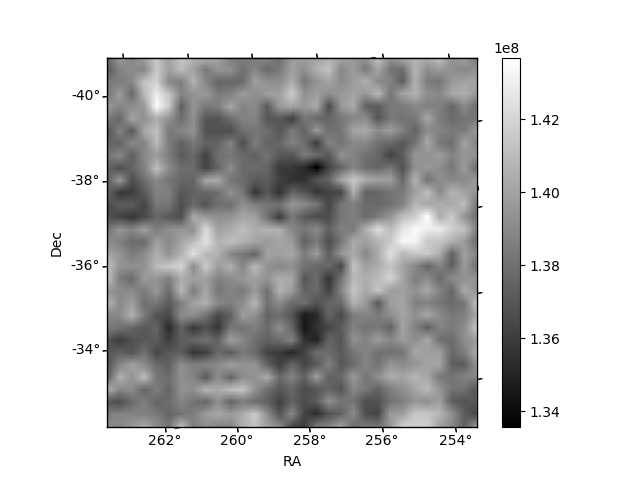
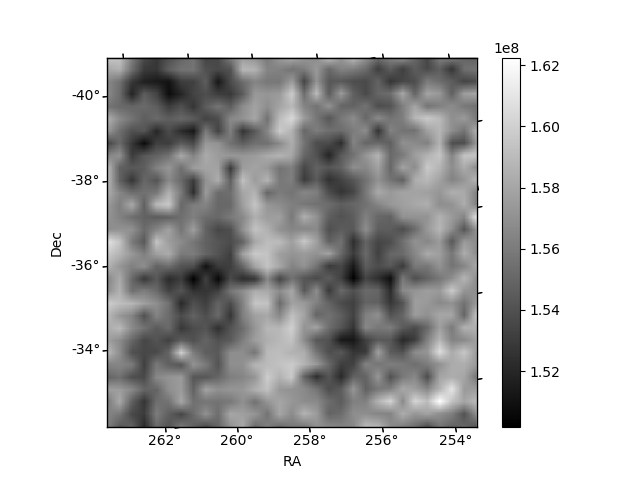
Histogram calculated using DETX and DETY for each event in the final _common_clean file
| Quadrant A | 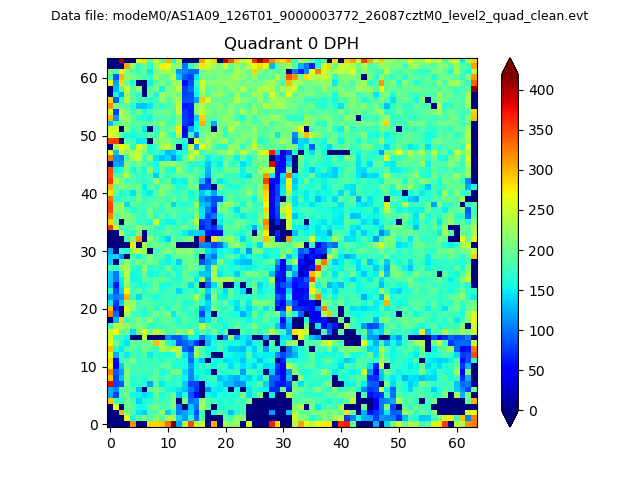 |
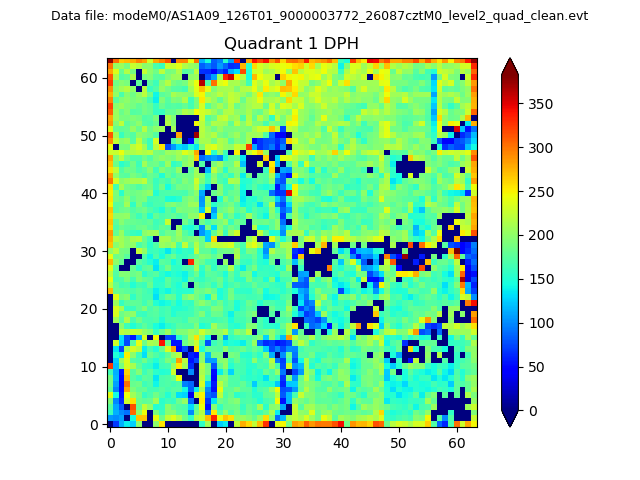 |
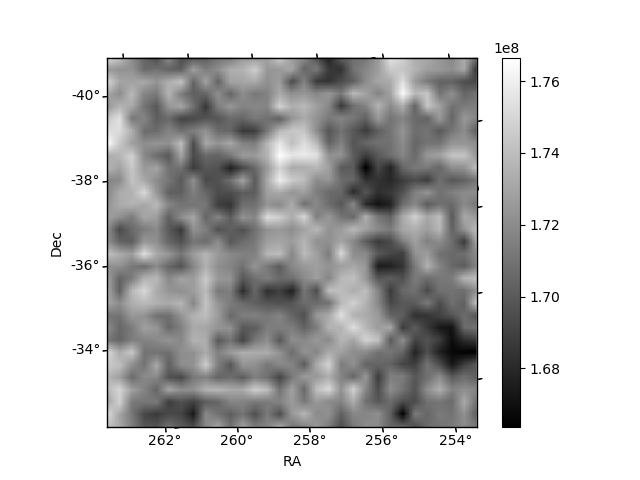
Quadrant B |
|---|---|---|---|
| Quadrant D | 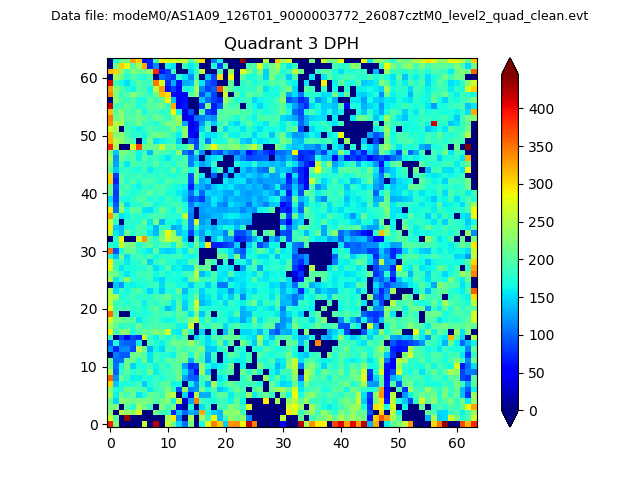 |
 |
Quadrant C |
| Plot type | Count rate plots | Images |
|---|---|---|
| Comparison with Poisson distribution Blue bars denote a histogram of data divided into 1 sec bins. Red curve is a Poisson curve with rate = median count rate of data. |
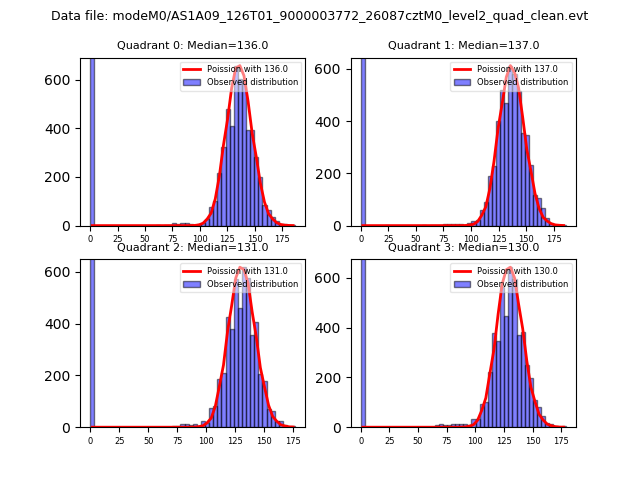 |
 |
| Quadrant-wise count rates Data is divided into 100 sec bins |
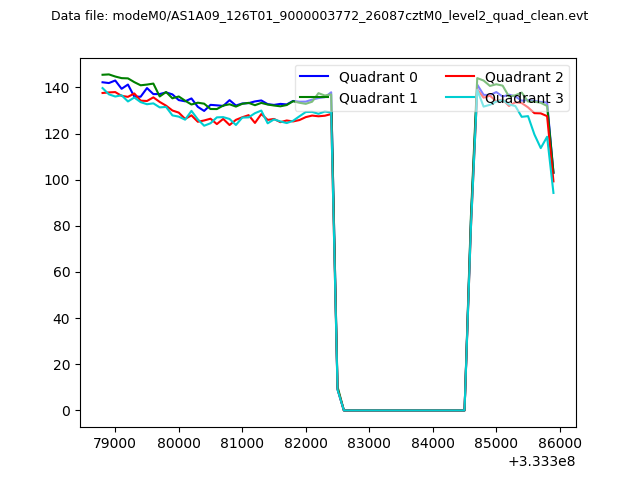 |
|
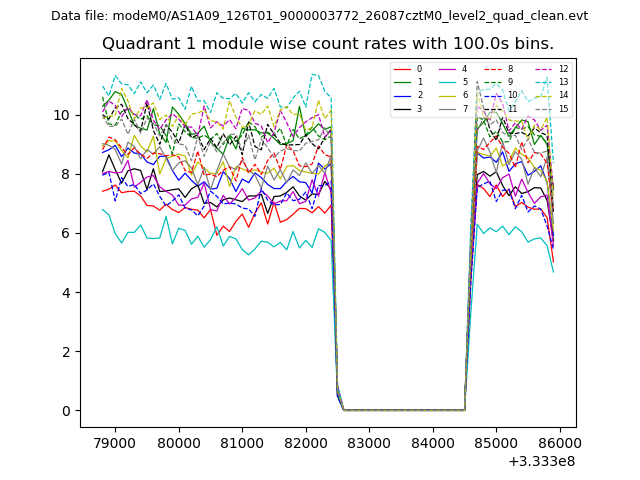
| Module-wise count rates for Quadrant A Data is divided into 100 sec bins |
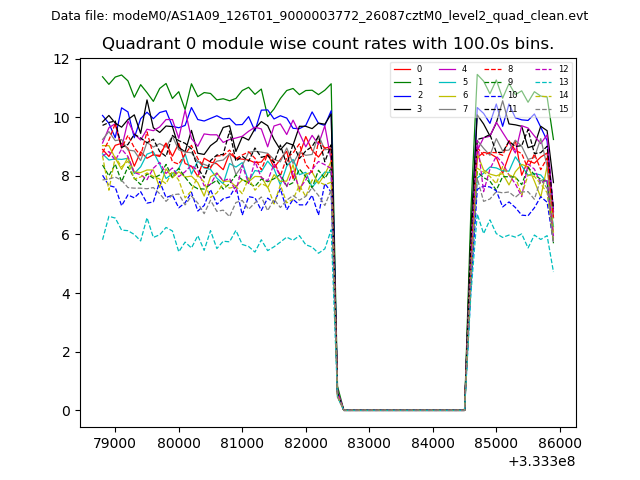 |
 |
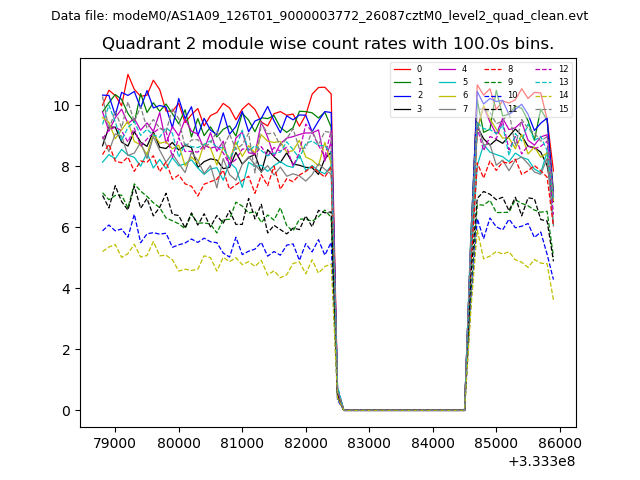
| Module-wise count rates for Quadrant B Data is divided into 100 sec bins |
 |
 |
| Module-wise count rates for Quadrant C Data is divided into 100 sec bins |
 |
 |
| Module-wise count rates for Quadrant D Data is divided into 100 sec bins |
 |
 |
| Parameter | Plot |
|---|---|
| CZT HV Monitor | 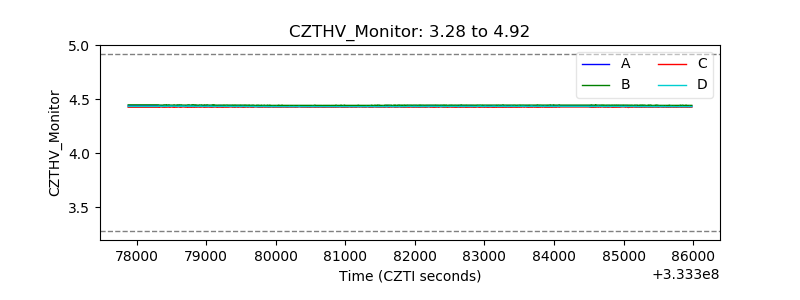 |
| D_VDD | 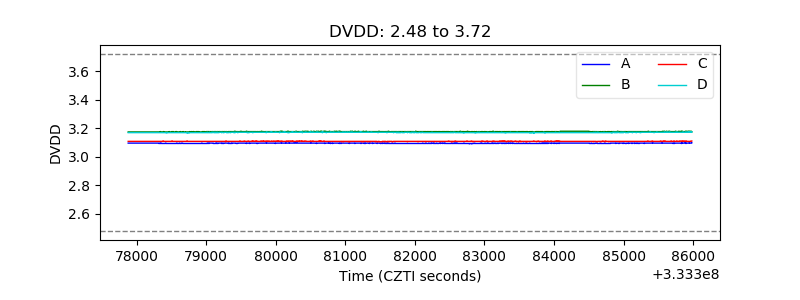 |
| Temperature 1 | 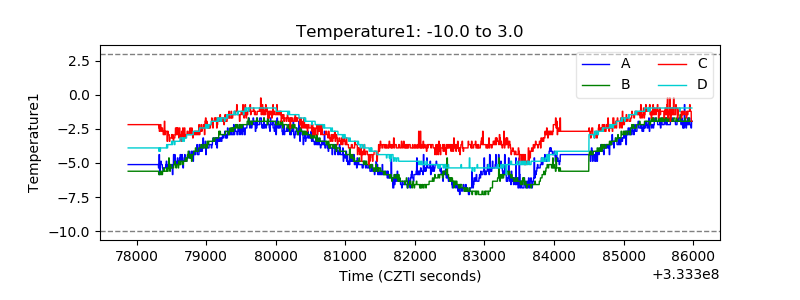 |
| Veto HV Monitor | 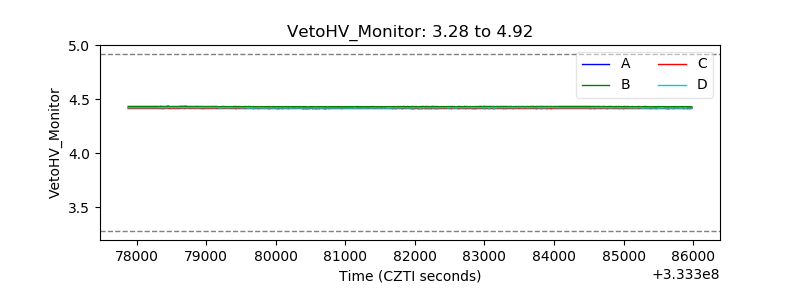 |
| Veto LLD | 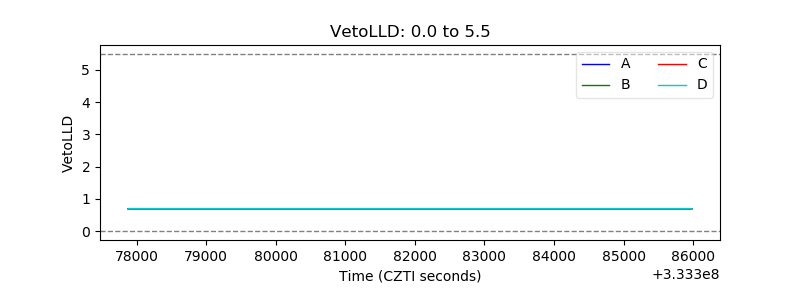 |
| Alpha Counter | 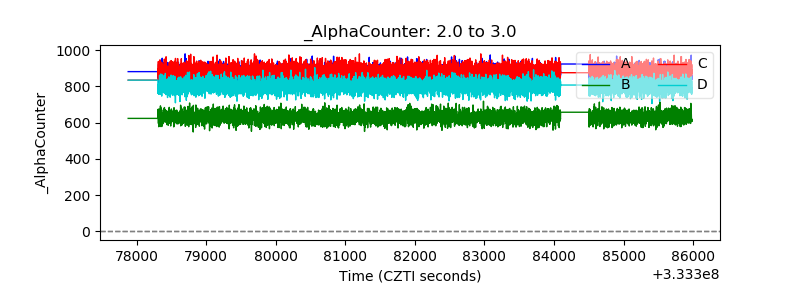 |
| _CPM_Rate | 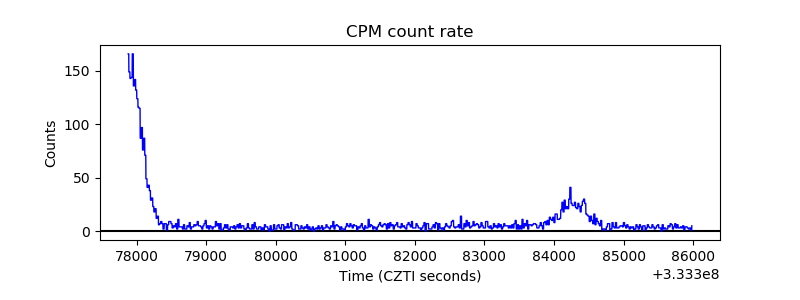 |
| CZT Counter | 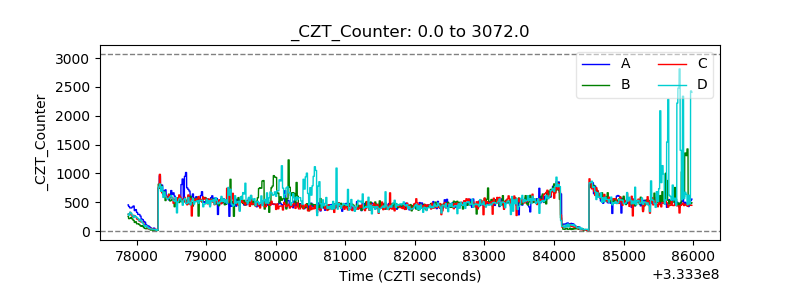 |
| +2.5 Volts monitor | 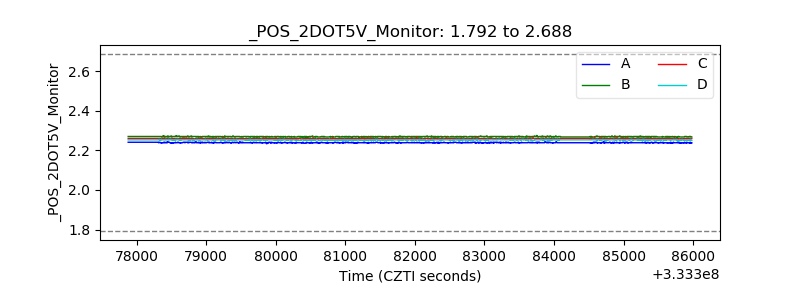 |
| +5 Volts monitor |  |
| _ROLL_ROT | 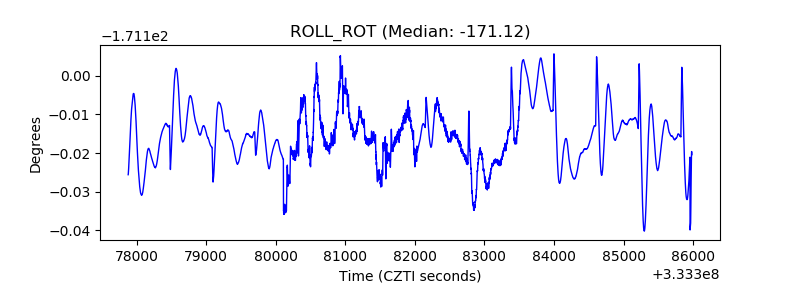 |
| _Roll_DEC | 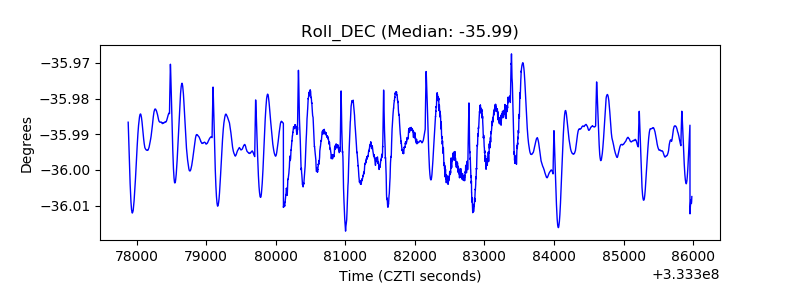 |
| _Roll_RA | 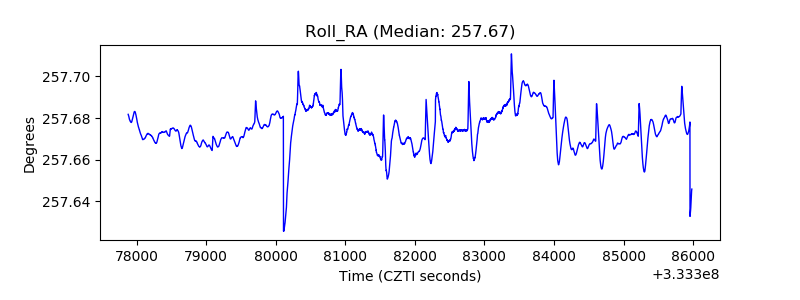 |
| Veto Counter | 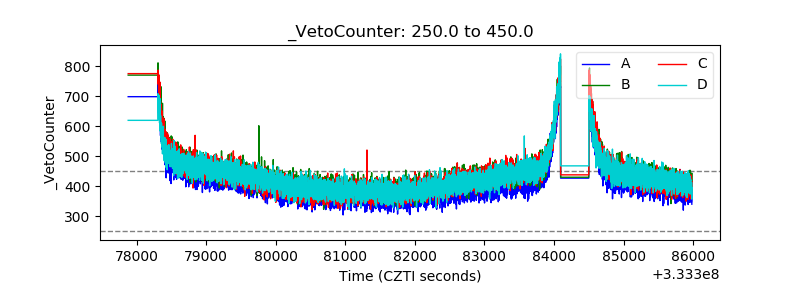 |