| Param | Original file | Final file |
|---|---|---|
| Filename | modeM0/AS1A09_126T01_9000003772_26089cztM0_level2.evt | modeM0/AS1A09_126T01_9000003772_26089cztM0_level2_quad_clean.evt |
| Size (bytes) | 1,549,851,840 | 259,539,840 |
| Size | 1.4 GB | 247.5 MB |
| Events in quadrant A | 9,080,465 | 1,703,530 |
| Events in quadrant B | 9,429,408 | 1,713,776 |
| Events in quadrant C | 9,054,300 | 1,633,371 |
| Events in quadrant D | 18,104,292 | 1,513,826 |
| Mode M0 | |||
|---|---|---|---|
| Quadrant | BADHDUFLAG | Total packets | Discarded packets |
| A | 0 | 38964 | 0 |
| B | 0 | 39804 | 0 |
| C | 0 | 39075 | 0 |
| D | 0 | 66462 | 0 |
| Mode M9 | |||
|---|---|---|---|
| Quadrant | BADHDUFLAG | Total packets | Discarded packets |
| A | 0 | 7 | 0 |
| B | 0 | 7 | 0 |
| C | 0 | 7 | 0 |
| D | 0 | 7 | 0 |
| Quadrant | Total seconds | Saturated seconds | Saturation percentage |
|---|---|---|---|
| A | 18801 | 259 | 1.377586% |
| B | 18801 | 352 | 1.872241% |
| C | 18801 | 400 | 2.127546% |
| D | 18801 | 2156 | 11.467475% |
Noise dominated data is calculated using 1-second bins in cleaned event files. If a bin has >2000 counts, and if more than 50% of those come from <1% of pixels, then it is considered to be noise-dominated and hence unusable.
| Quadrant | # 1 sec bins | Bins with >0 counts | Bins with >2000 counts | High rate bins dominated by noise | Noise dominated (total time) | Noise dominated (detector-on time) | Marked lightcurve |
|---|---|---|---|---|---|---|---|
| A | 19621 | 18804 | 0 | 0 | 0.00% | 0.00% | 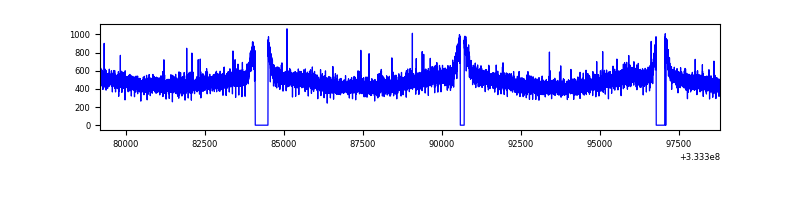 |
| B | 19621 | 18804 | 5 | 5 | 0.03% | 0.03% | 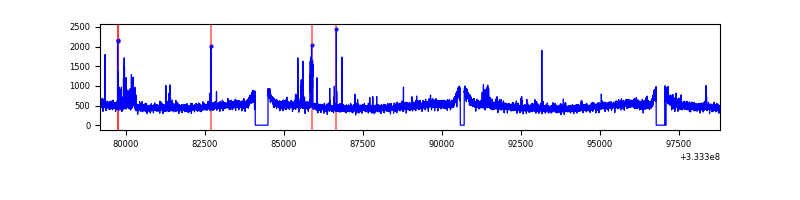 |
| C | 19621 | 18803 | 0 | 0 | 0.00% | 0.00% | 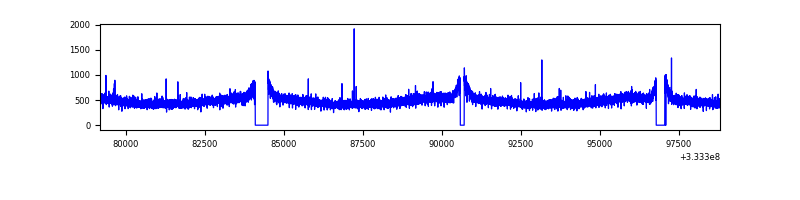 |
| D | 19621 | 18801 | 1847 | 1847 | 9.41% | 9.82% | 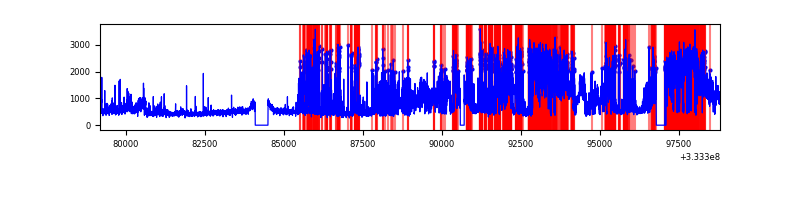 |
Top three noisy pixels from each quadrant. If the there are fewer than three noisy pixels in the level2.evt file, extra rows are filled as -1
| Pixel properties | Quadrant properties | ||||||
|---|---|---|---|---|---|---|---|
| Quadrant | DetID | PixID | Counts | Sigma | Mean | Median | Sigma |
| A | 13 | 254 | 31842 | 62.6 | 2351 | 2305 | 471.9 |
| A | 3 | 137 | 22259 | 42.29 | 2351 | 2305 | 471.9 |
| A | 0 | 226 | 20306 | 38.15 | 2351 | 2305 | 471.9 |
| B | 15 | 33 | 197404 | 439.42 | 2324 | 2267 | 444.1 |
| B | 12 | 111 | 55215 | 119.23 | 2324 | 2267 | 444.1 |
| B | 0 | 190 | 53698 | 115.82 | 2324 | 2267 | 444.1 |
| C | 14 | 238 | 355855 | 680.96 | 2224 | 2241 | 519.3 |
| C | 3 | 233 | 22041 | 38.13 | 2224 | 2241 | 519.3 |
| C | 2 | 16 | 17409 | 29.21 | 2224 | 2241 | 519.3 |
| D | 1 | 52 | 8798656 | 16876.77 | 2179 | 2129 | 521.2 |
| D | 12 | 233 | 665923 | 1273.54 | 2179 | 2129 | 521.2 |
| D | 7 | 80 | 218635 | 415.38 | 2179 | 2129 | 521.2 |
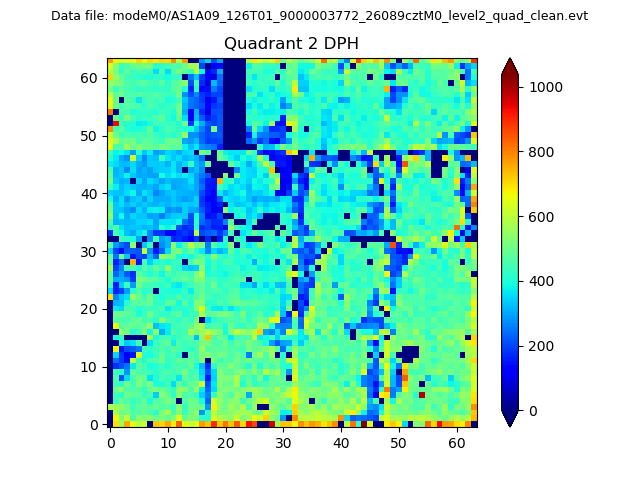
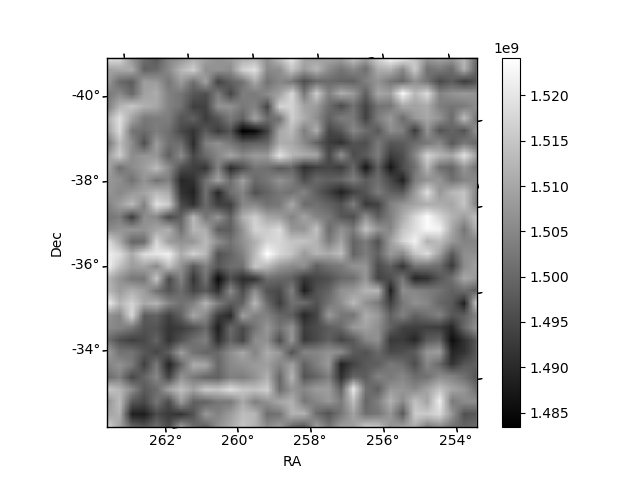
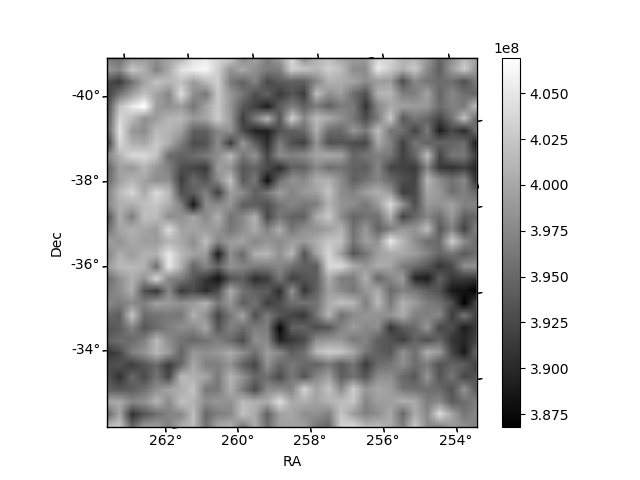
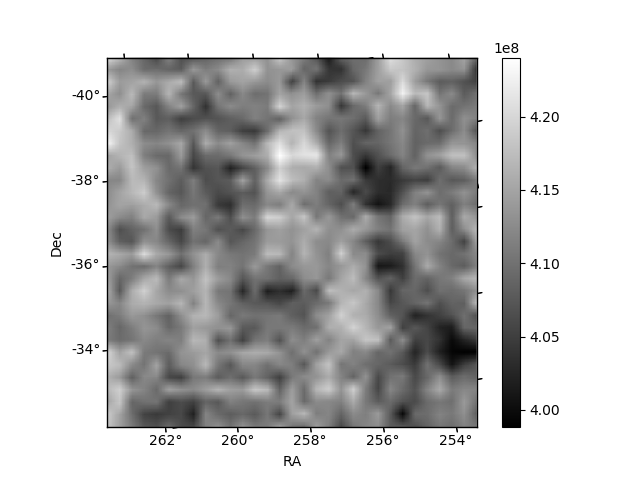
Histogram calculated using DETX and DETY for each event in the final _common_clean file
| Quadrant A | 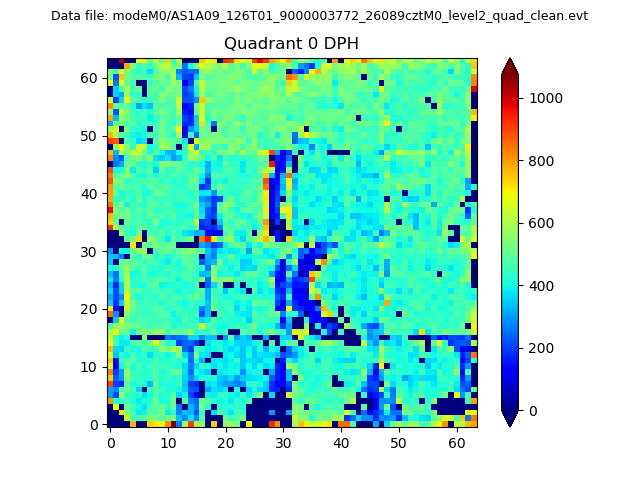 |
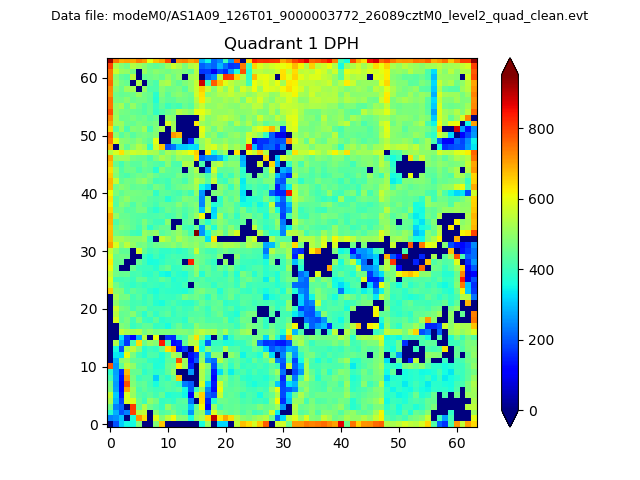 |
Quadrant B |
|---|---|---|---|
| Quadrant D | 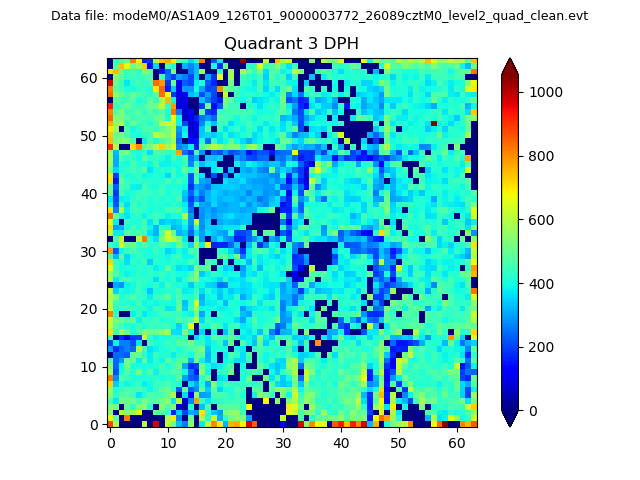 |
 |
Quadrant C |
| Plot type | Count rate plots | Images |
|---|---|---|
| Comparison with Poisson distribution Blue bars denote a histogram of data divided into 1 sec bins. Red curve is a Poisson curve with rate = median count rate of data. |
 |
 |
| Quadrant-wise count rates Data is divided into 100 sec bins |
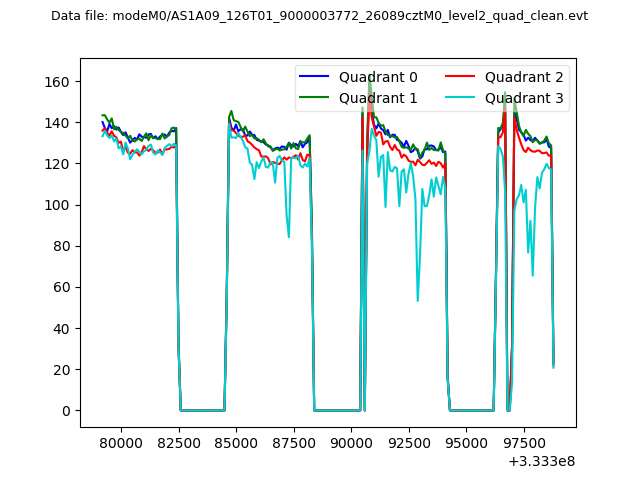 |
|
| Module-wise count rates for Quadrant A Data is divided into 100 sec bins |
 |
 |
| Module-wise count rates for Quadrant B Data is divided into 100 sec bins |
 |
 |
| Module-wise count rates for Quadrant C Data is divided into 100 sec bins |
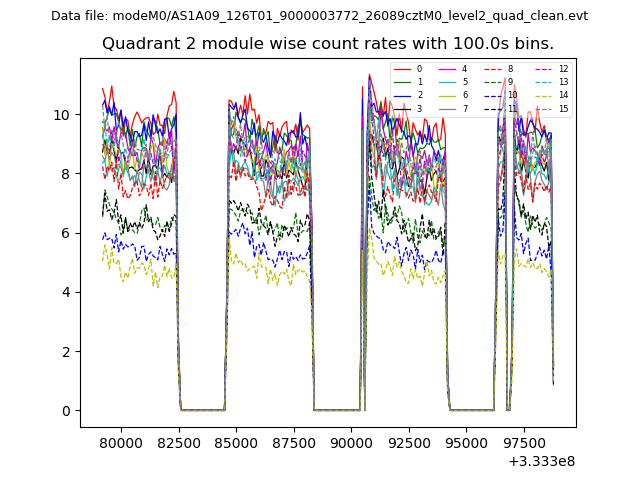 |
 |
| Module-wise count rates for Quadrant D Data is divided into 100 sec bins |
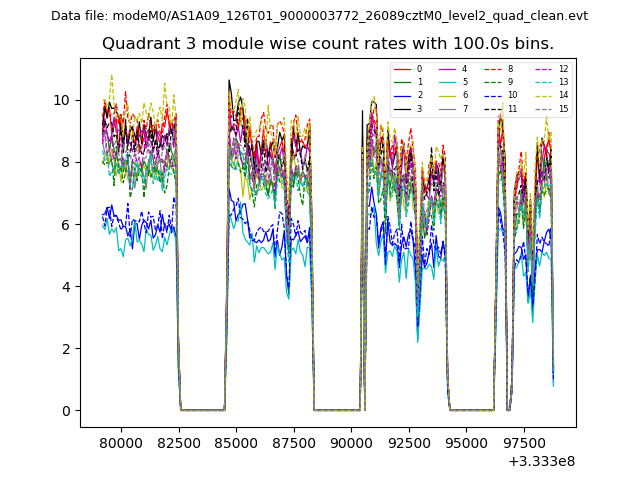 |
 |
| Parameter | Plot |
|---|---|
| CZT HV Monitor |  |
| D_VDD | 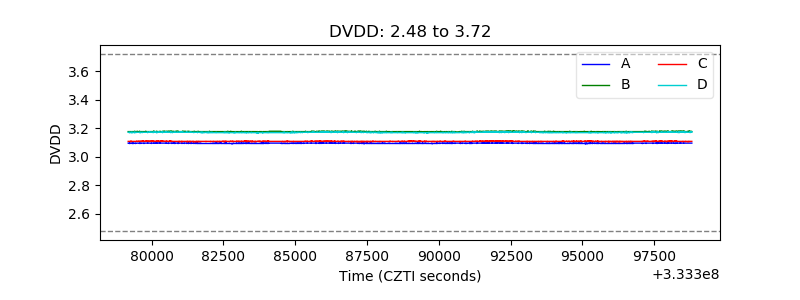 |
| Temperature 1 | 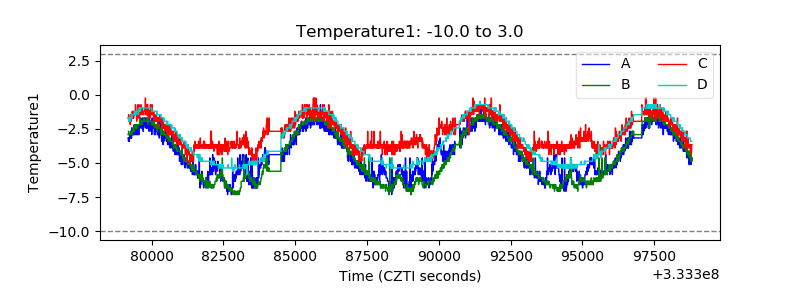 |
| Veto HV Monitor | 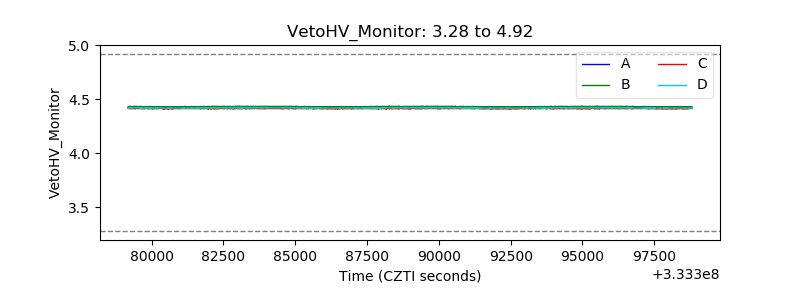 |
| Veto LLD | 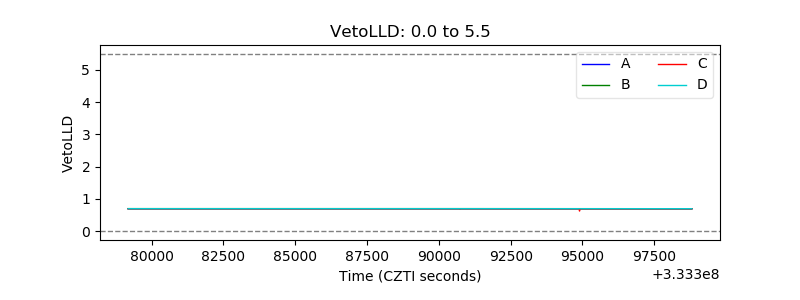 |
| Alpha Counter | 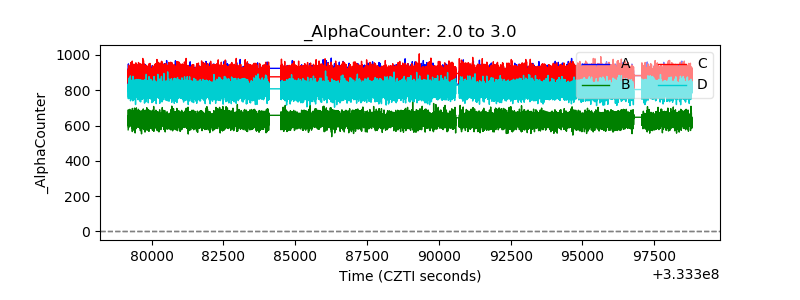 |
| _CPM_Rate | 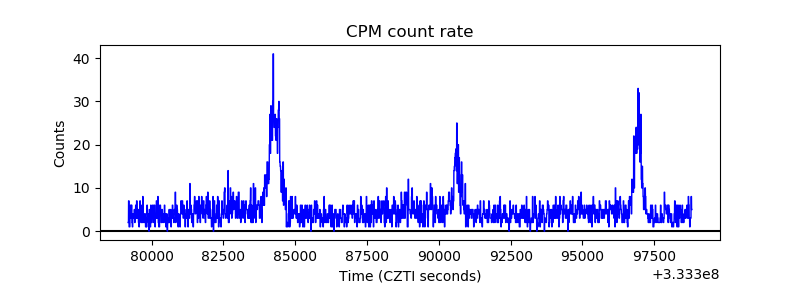 |
| CZT Counter | 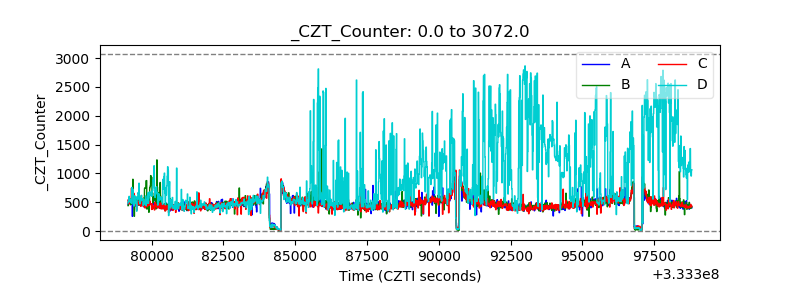 |
| +2.5 Volts monitor |  |
| +5 Volts monitor |  |
| _ROLL_ROT | 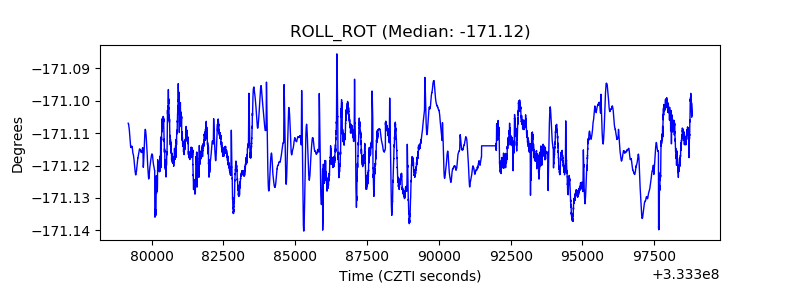 |
| _Roll_DEC | 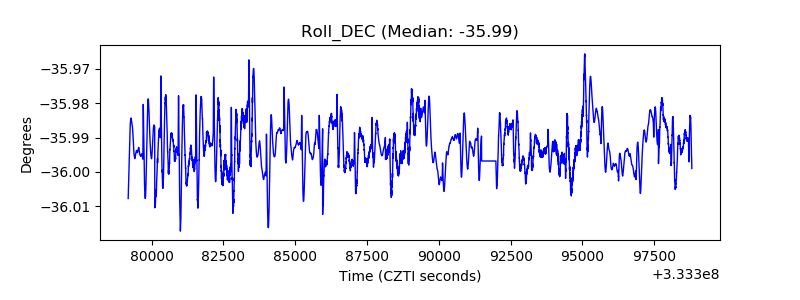 |
| _Roll_RA | 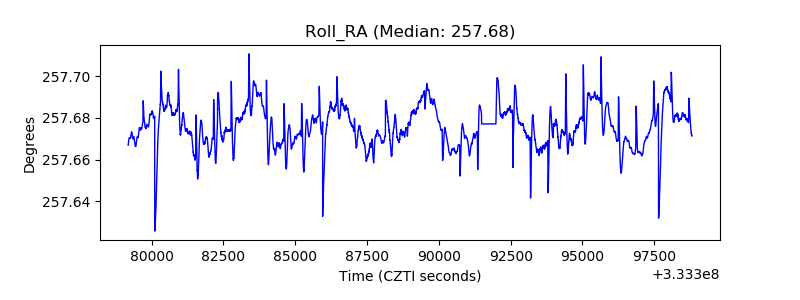 |
| Veto Counter | 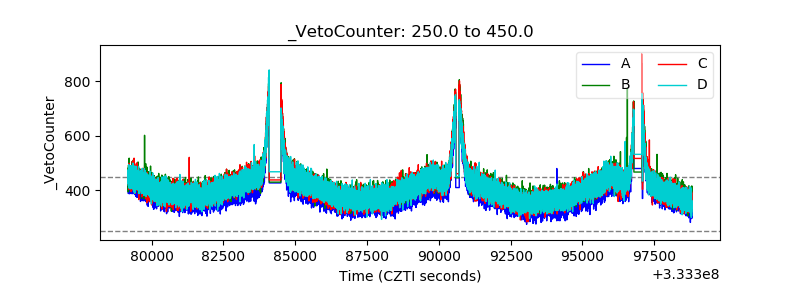 |