| Param | Original file | Final file |
|---|---|---|
| Filename | modeM0/AS1A09_126T01_9000003772_26091cztM0_level2.evt | modeM0/AS1A09_126T01_9000003772_26091cztM0_level2_quad_clean.evt |
| Size (bytes) | 559,880,640 | 101,465,280 |
| Size | 533.9 MB | 96.8 MB |
| Events in quadrant A | 3,371,819 | 667,378 |
| Events in quadrant B | 3,484,656 | 672,690 |
| Events in quadrant C | 3,373,629 | 639,538 |
| Events in quadrant D | 6,238,829 | 592,898 |
| Mode M0 | |||
|---|---|---|---|
| Quadrant | BADHDUFLAG | Total packets | Discarded packets |
| A | 0 | 14650 | 0 |
| B | 0 | 14878 | 0 |
| C | 0 | 14753 | 0 |
| D | 0 | 23386 | 0 |
| Mode M9 | |||
|---|---|---|---|
| Quadrant | BADHDUFLAG | Total packets | Discarded packets |
| A | 0 | 5 | 0 |
| B | 0 | 5 | 0 |
| C | 0 | 5 | 0 |
| D | 0 | 5 | 0 |
| Quadrant | Total seconds | Saturated seconds | Saturation percentage |
|---|---|---|---|
| A | 7178 | 17 | 0.236835% |
| B | 7179 | 34 | 0.473604% |
| C | 7179 | 56 | 0.780053% |
| D | 7179 | 694 | 9.667085% |
Noise dominated data is calculated using 1-second bins in cleaned event files. If a bin has >2000 counts, and if more than 50% of those come from <1% of pixels, then it is considered to be noise-dominated and hence unusable.
| Quadrant | # 1 sec bins | Bins with >0 counts | Bins with >2000 counts | High rate bins dominated by noise | Noise dominated (total time) | Noise dominated (detector-on time) | Marked lightcurve |
|---|---|---|---|---|---|---|---|
| A | 7683 | 7178 | 0 | 0 | 0.00% | 0.00% | 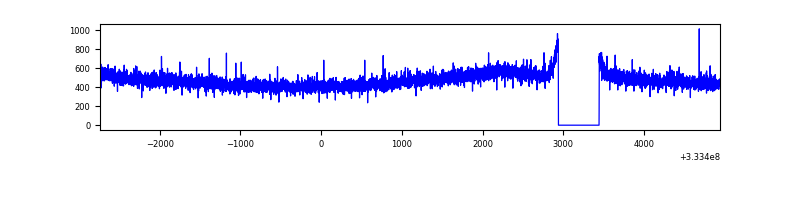 |
| B | 7684 | 7180 | 0 | 0 | 0.00% | 0.00% | 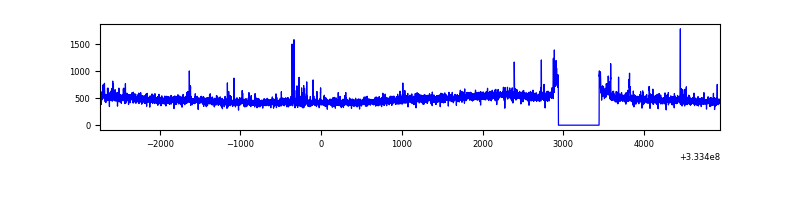 |
| C | 7684 | 7180 | 0 | 0 | 0.00% | 0.00% | 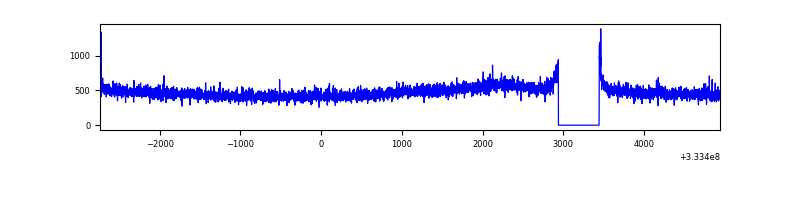 |
| D | 7684 | 7180 | 711 | 711 | 9.25% | 9.90% | 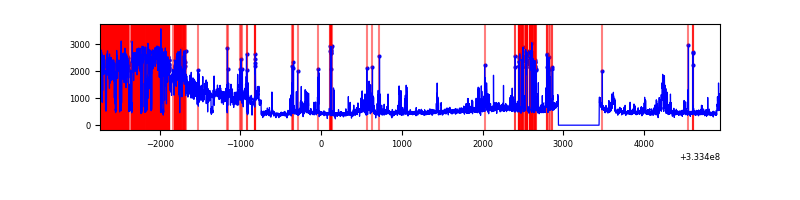 |
Top three noisy pixels from each quadrant. If the there are fewer than three noisy pixels in the level2.evt file, extra rows are filled as -1
| Pixel properties | Quadrant properties | ||||||
|---|---|---|---|---|---|---|---|
| Quadrant | DetID | PixID | Counts | Sigma | Mean | Median | Sigma |
| A | 13 | 254 | 12237 | 64.11 | 873 | 856 | 177.5 |
| A | 3 | 137 | 8149 | 41.08 | 873 | 856 | 177.5 |
| A | 0 | 226 | 7669 | 38.38 | 873 | 856 | 177.5 |
| B | 0 | 190 | 32234 | 187.83 | 867 | 846 | 167.1 |
| B | 0 | 229 | 24159 | 139.51 | 867 | 846 | 167.1 |
| B | 12 | 111 | 20468 | 117.42 | 867 | 846 | 167.1 |
| C | 14 | 238 | 131590 | 671.17 | 826 | 833 | 194.8 |
| C | 3 | 233 | 19068 | 93.6 | 826 | 833 | 194.8 |
| C | 13 | 61 | 5805 | 25.52 | 826 | 833 | 194.8 |
| D | 1 | 52 | 3002029 | 15359.8 | 810 | 789 | 195.4 |
| D | 10 | 230 | 96006 | 487.3 | 810 | 789 | 195.4 |
| D | 12 | 233 | 56820 | 286.76 | 810 | 789 | 195.4 |
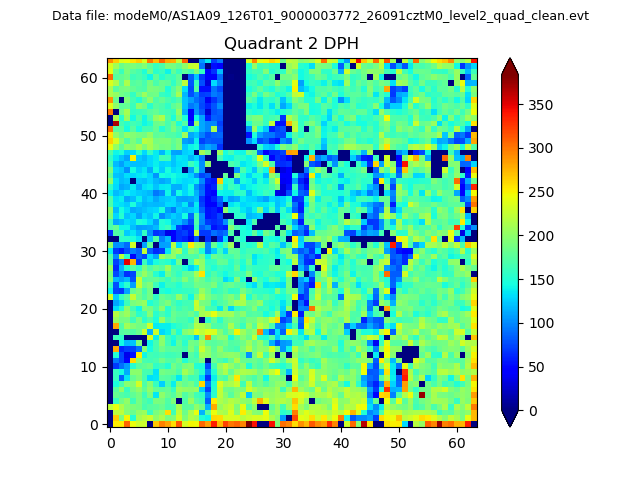
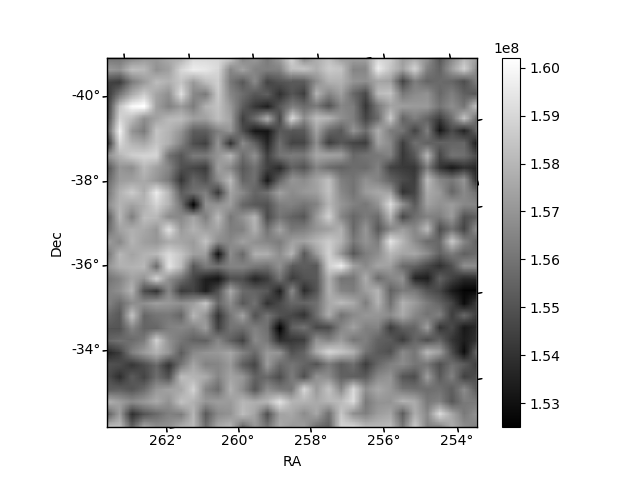
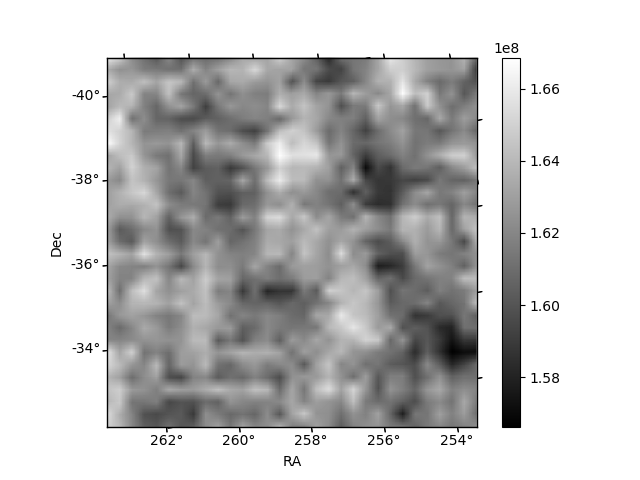
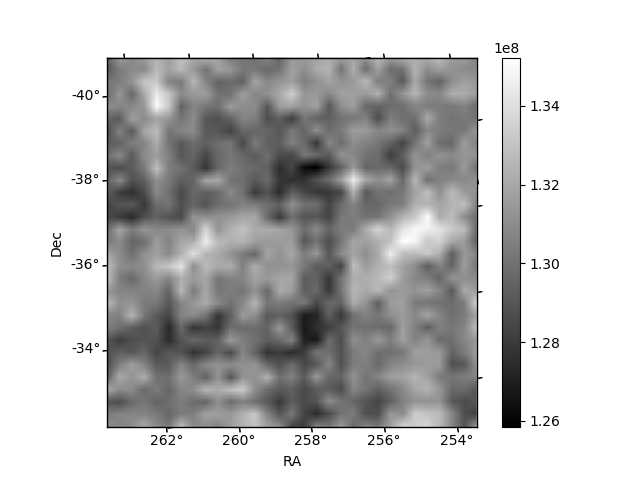
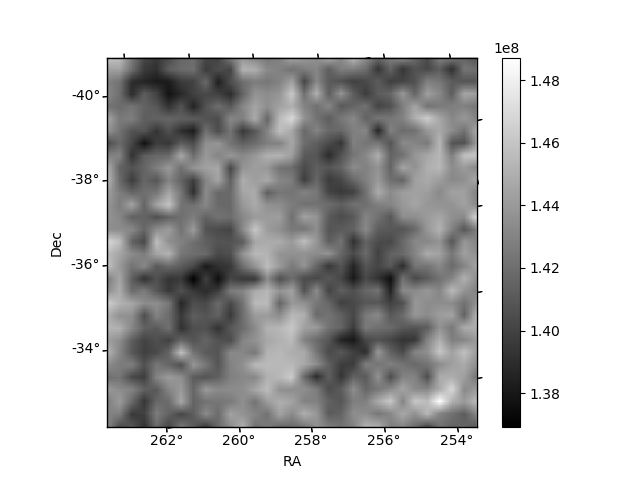
Histogram calculated using DETX and DETY for each event in the final _common_clean file
| Quadrant A |  |
 |
Quadrant B |
|---|---|---|---|
| Quadrant D | 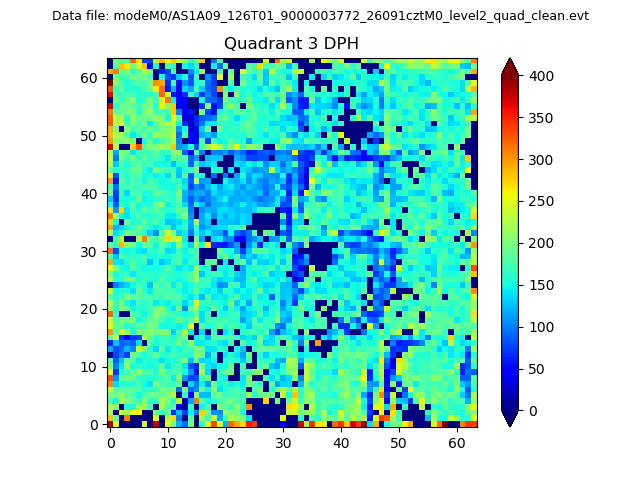 |
 |
Quadrant C |
| Plot type | Count rate plots | Images |
|---|---|---|
| Comparison with Poisson distribution Blue bars denote a histogram of data divided into 1 sec bins. Red curve is a Poisson curve with rate = median count rate of data. |
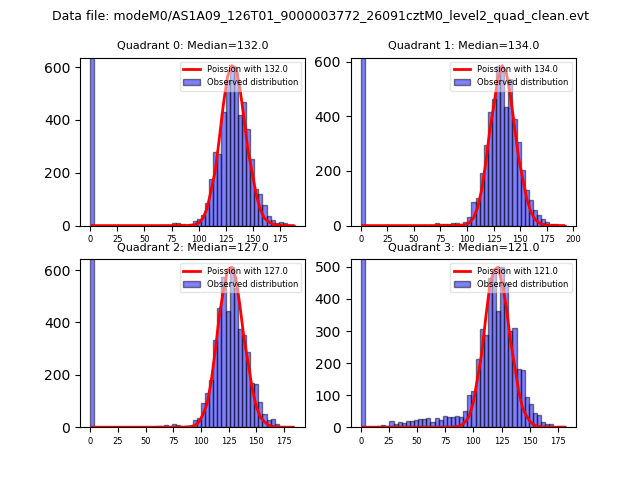 |
 |
| Quadrant-wise count rates Data is divided into 100 sec bins |
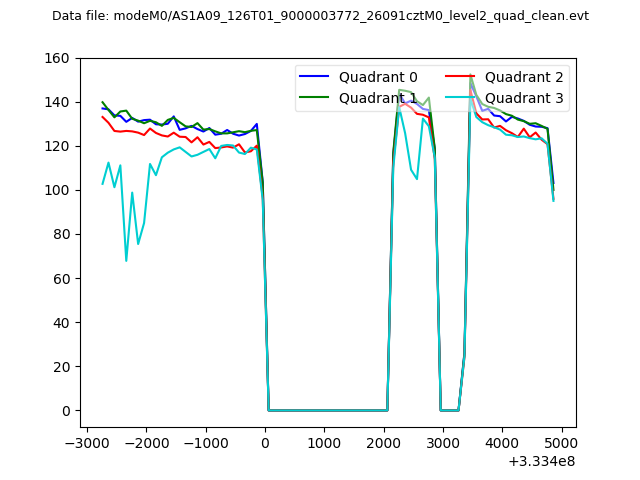 |
|
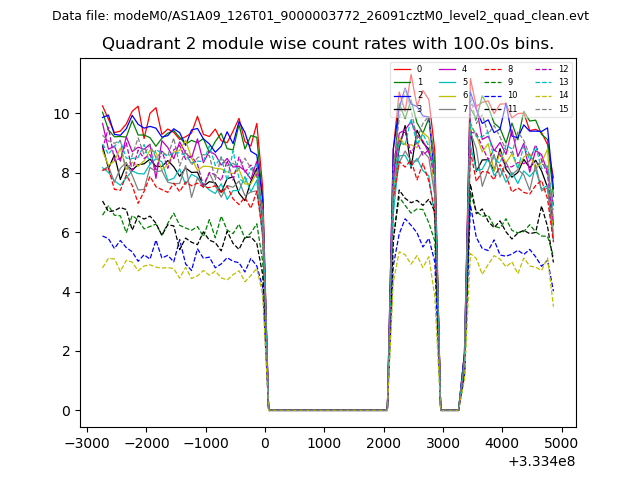
| Module-wise count rates for Quadrant A Data is divided into 100 sec bins |
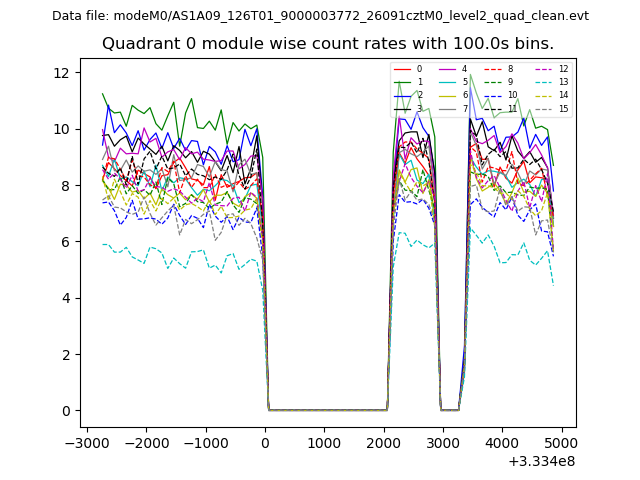 |
 |
| Module-wise count rates for Quadrant B Data is divided into 100 sec bins |
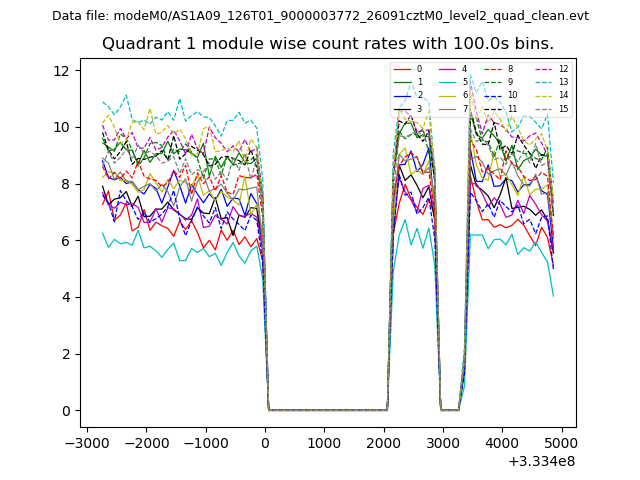 |
 |
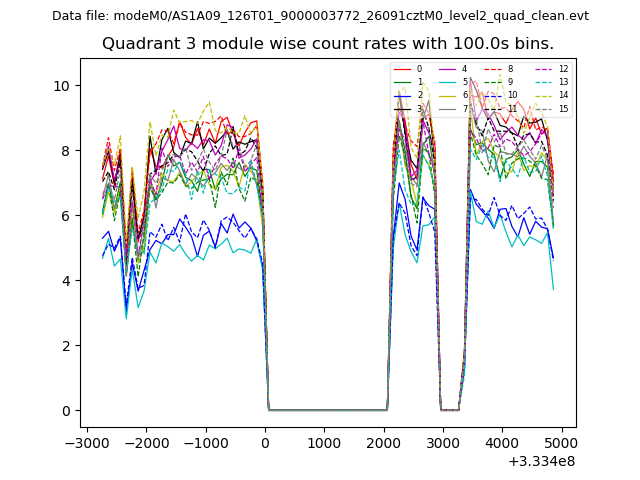
| Module-wise count rates for Quadrant C Data is divided into 100 sec bins |
 |
 |
| Module-wise count rates for Quadrant D Data is divided into 100 sec bins |
 |
 |
| Parameter | Plot |
|---|---|
| CZT HV Monitor |  |
| D_VDD | 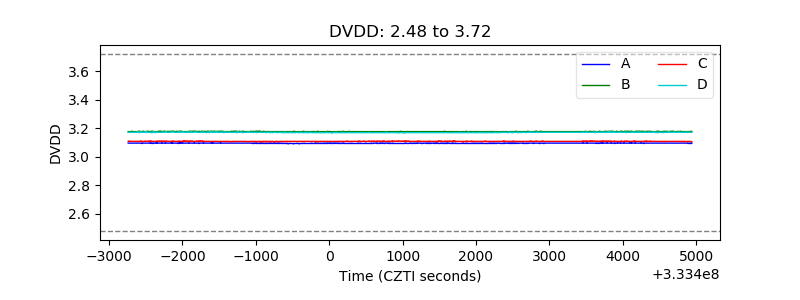 |
| Temperature 1 | 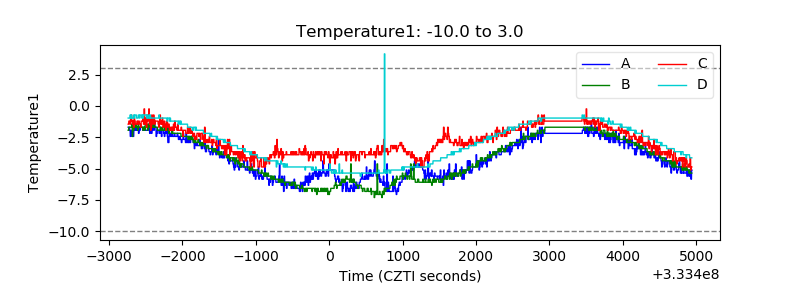 |
| Veto HV Monitor | 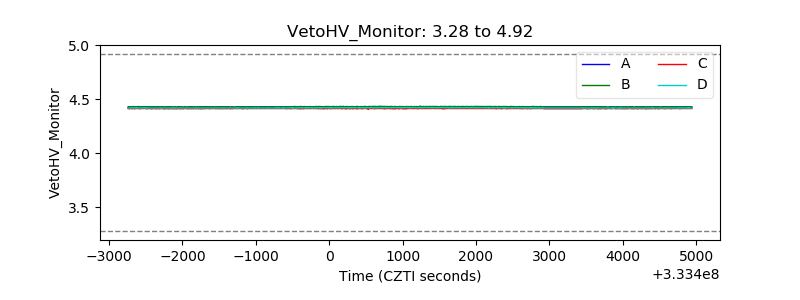 |
| Veto LLD | 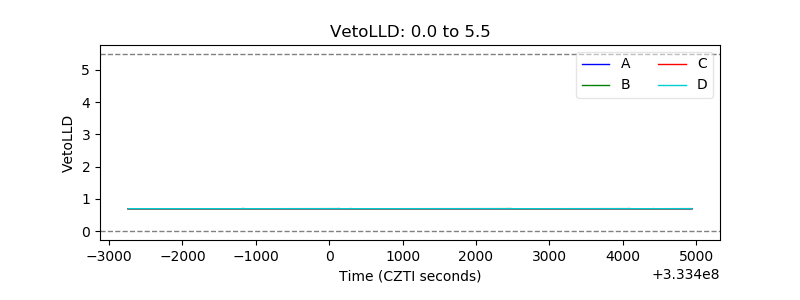 |
| Alpha Counter | 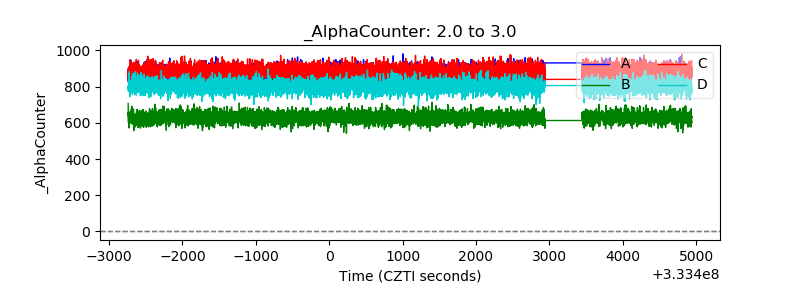 |
| _CPM_Rate |  |
| CZT Counter | 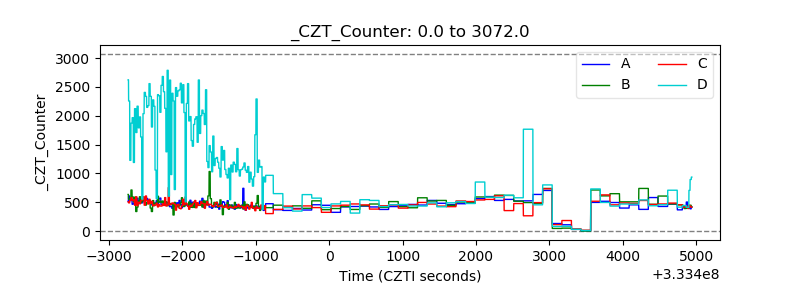 |
| +2.5 Volts monitor | 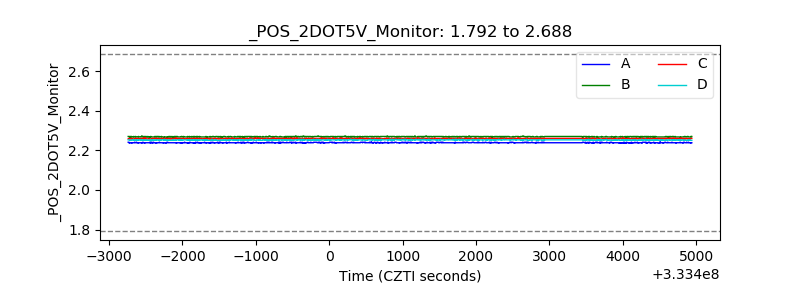 |
| +5 Volts monitor | 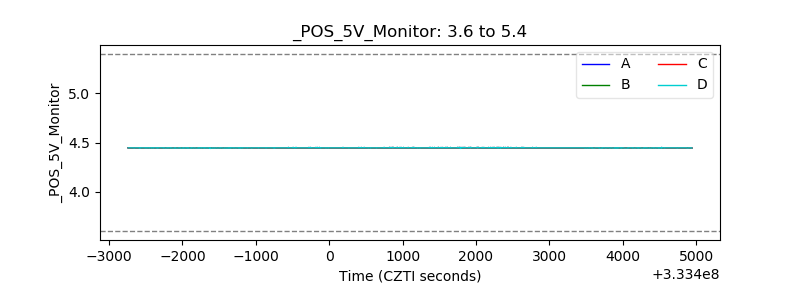 |
| _ROLL_ROT | 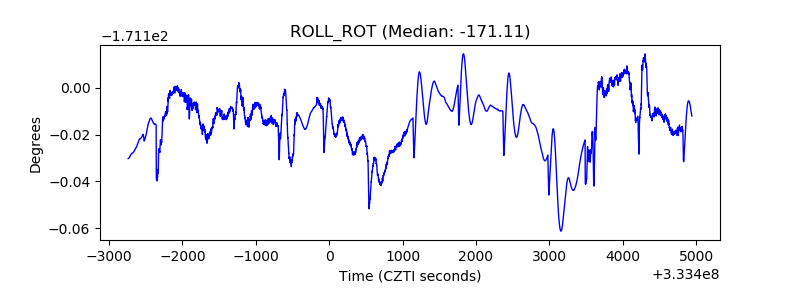 |
| _Roll_DEC | 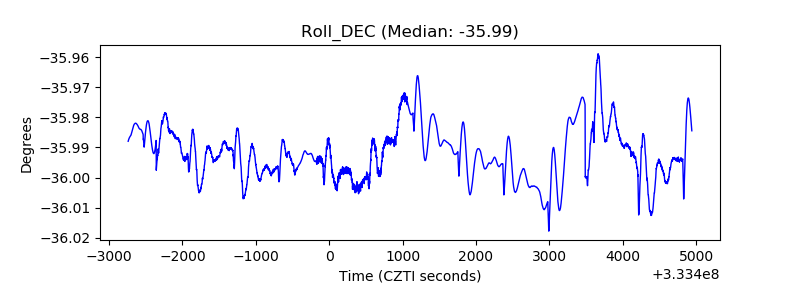 |
| _Roll_RA | 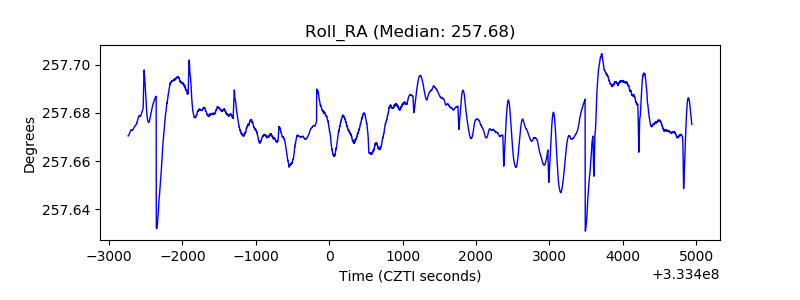 |
| Veto Counter | 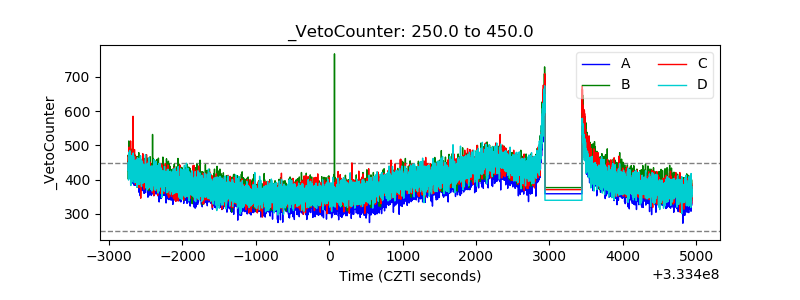 |