| Param | Original file | Final file |
|---|---|---|
| Filename | modeM0/AS1T03_218T01_9000003770cztM0_level2.fits | modeM0/AS1T03_218T01_9000003770cztM0_level2_quad_clean.evt |
| Size (bytes) | 192,317,760 | 85,452,480 |
| Size | 183.4 MB | 81.5 MB |
| Events in quadrant A | 1,245,248 | 372,076 |
| Events in quadrant B | 1,180,158 | 371,951 |
| Events in quadrant C | 1,172,306 | 344,675 |
| Events in quadrant D | 1,053,178 | 322,606 |
| Mode SS | |||
|---|---|---|---|
| Quadrant | BADHDUFLAG | Total packets | Discarded packets |
| A | 0 | 344 | 0 |
| B | 0 | 344 | 0 |
| C | 0 | 344 | 0 |
| D | 0 | 344 | 0 |
| Mode M0 | |||
|---|---|---|---|
| Quadrant | BADHDUFLAG | Total packets | Discarded packets |
| A | 0 | 38267 | 0 |
| B | 0 | 37023 | 0 |
| C | 0 | 36507 | 0 |
| D | 0 | 38973 | 0 |
| Mode M9 | |||
|---|---|---|---|
| Quadrant | BADHDUFLAG | Total packets | Discarded packets |
| A | 0 | 40 | 0 |
| B | 0 | 40 | 0 |
| C | 0 | 40 | 0 |
| D | 0 | 40 | 0 |
| Quadrant | Total seconds | Saturated seconds | Saturation percentage |
|---|---|---|---|
| A | 17038 | 225 | 1.320578% |
| B | 17038 | 220 | 1.291231% |
| C | 17037 | 255 | 1.496742% |
| D | 17038 | 135 | 0.792347% |
Noise dominated data is calculated using 1-second bins in cleaned event files. If a bin has >2000 counts, and if more than 50% of those come from <1% of pixels, then it is considered to be noise-dominated and hence unusable.
| Quadrant | # 1 sec bins | Bins with >0 counts | Bins with >2000 counts | High rate bins dominated by noise | Noise dominated (total time) | Noise dominated (detector-on time) | Marked lightcurve |
|---|---|---|---|---|---|---|---|
| A | 20888 | 17034 | 0 | 0 | 0.00% | 0.00% |  |
| B | 20888 | 17034 | 0 | 0 | 0.00% | 0.00% |  |
| C | 20887 | 17033 | 0 | 0 | 0.00% | 0.00% |  |
| D | 20888 | 17035 | 0 | 0 | 0.00% | 0.00% |  |
Top three noisy pixels from each quadrant. If the there are fewer than three noisy pixels in the level2.evt file, extra rows are filled as -1
| Pixel properties | Quadrant properties | ||||||
|---|---|---|---|---|---|---|---|
| Quadrant | DetID | PixID | Counts | Sigma | Mean | Median | Sigma |
| A | 0 | 29 | 1001 | 8.82 | 324 | 308 | 78.5 |
| A | 9 | 19 | 950 | 8.17 | 324 | 308 | 78.5 |
| A | 7 | 110 | 940 | 8.05 | 324 | 308 | 78.5 |
| B | 2 | 9 | 926 | 10.12 | 312 | 301 | 61.8 |
| B | 3 | 17 | 777 | 7.7 | 312 | 301 | 61.8 |
| B | 5 | 128 | 742 | 7.14 | 312 | 301 | 61.8 |
| C | 1 | 81 | 916 | 7.92 | 309 | 292 | 78.7 |
| C | 1 | 80 | 865 | 7.28 | 309 | 292 | 78.7 |
| C | 7 | 111 | 786 | 6.27 | 309 | 292 | 78.7 |
| D | 6 | 231 | 760 | 6.1 | 300 | 277 | 79.2 |
| D | 6 | 67 | 744 | 5.9 | 300 | 277 | 79.2 |
| D | 7 | 3 | 729 | 5.71 | 300 | 277 | 79.2 |
Histogram calculated using DETX and DETY for each event in the final _common_clean file
| Quadrant A | 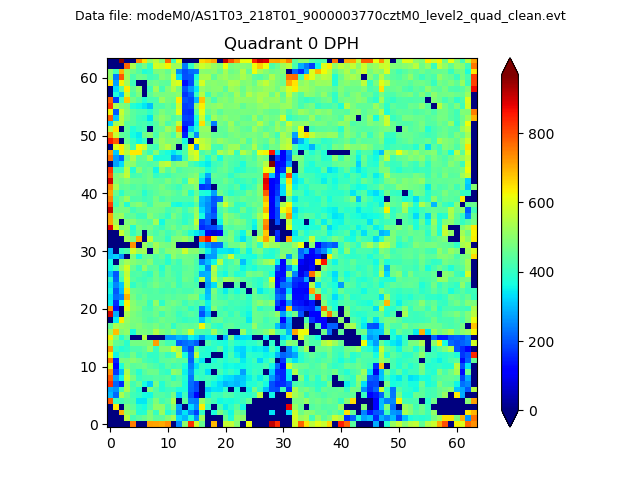 |
 |
Quadrant B |
|---|---|---|---|
| Quadrant D | 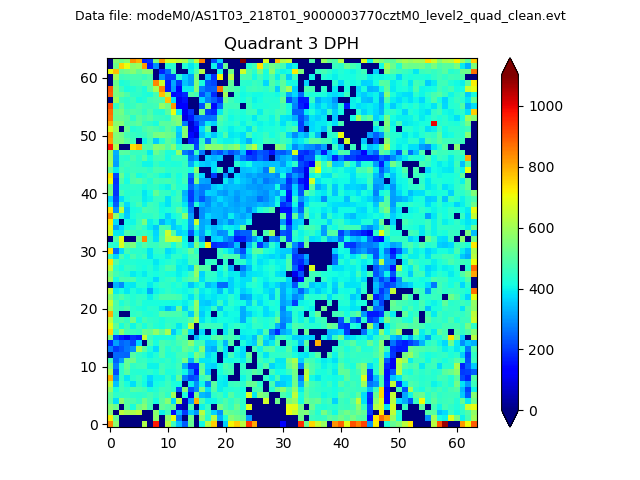 |
 |
Quadrant C |
| Plot type | Count rate plots | Images |
|---|---|---|
| Comparison with Poisson distribution Blue bars denote a histogram of data divided into 1 sec bins. Red curve is a Poisson curve with rate = median count rate of data. |
 |
 |
| Quadrant-wise count rates Data is divided into 100 sec bins |
 |
|
| Module-wise count rates for Quadrant A Data is divided into 100 sec bins |
 |
 |
| Module-wise count rates for Quadrant B Data is divided into 100 sec bins |
 |
 |
| Module-wise count rates for Quadrant C Data is divided into 100 sec bins |
 |
 |
| Module-wise count rates for Quadrant D Data is divided into 100 sec bins |
 |
 |
| Parameter | Plot |
|---|---|
| CZT HV Monitor |  |
| D_VDD |  |
| Temperature 1 |  |
| Veto HV Monitor |  |
| Veto LLD |  |
| Alpha Counter |  |
| _CPM_Rate |  |
| CZT Counter |  |
| +2.5 Volts monitor |  |
| +5 Volts monitor |  |
| _ROLL_ROT |  |
| _Roll_DEC |  |
| _Roll_RA |  |
| Veto Counter |  |