| Param | Original file | Final file |
|---|---|---|
| Filename | modeM0/AS1T03_218T01_9000003770_26081cztM0_level2.evt | modeM0/AS1T03_218T01_9000003770_26081cztM0_level2_quad_clean.evt |
| Size (bytes) | 368,763,840 | 64,581,120 |
| Size | 351.7 MB | 61.6 MB |
| Events in quadrant A | 2,824,037 | 406,478 |
| Events in quadrant B | 2,600,644 | 412,953 |
| Events in quadrant C | 2,619,690 | 391,860 |
| Events in quadrant D | 2,783,347 | 393,461 |
| Mode M0 | |||
|---|---|---|---|
| Quadrant | BADHDUFLAG | Total packets | Discarded packets |
| A | 0 | 11453 | 0 |
| B | 0 | 10786 | 0 |
| C | 0 | 10813 | 0 |
| D | 0 | 11226 | 0 |
| Mode M9 | |||
|---|---|---|---|
| Quadrant | BADHDUFLAG | Total packets | Discarded packets |
| A | 0 | 12 | 0 |
| B | 0 | 12 | 0 |
| C | 0 | 12 | 0 |
| D | 0 | 12 | 0 |
| Quadrant | Total seconds | Saturated seconds | Saturation percentage |
|---|---|---|---|
| A | 5000 | 98 | 1.960000% |
| B | 4999 | 71 | 1.420284% |
| C | 4999 | 92 | 1.840368% |
| D | 4999 | 32 | 0.640128% |
Noise dominated data is calculated using 1-second bins in cleaned event files. If a bin has >2000 counts, and if more than 50% of those come from <1% of pixels, then it is considered to be noise-dominated and hence unusable.
| Quadrant | # 1 sec bins | Bins with >0 counts | Bins with >2000 counts | High rate bins dominated by noise | Noise dominated (total time) | Noise dominated (detector-on time) | Marked lightcurve |
|---|---|---|---|---|---|---|---|
| A | 6175 | 5000 | 40 | 40 | 0.65% | 0.80% | 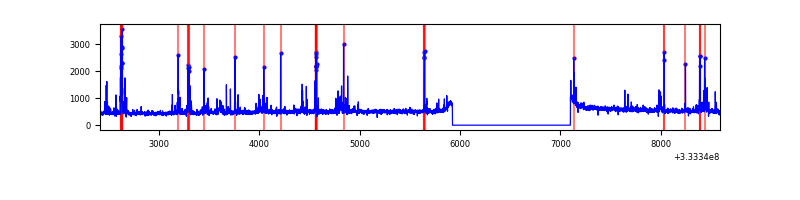 |
| B | 6174 | 4999 | 7 | 7 | 0.11% | 0.14% | 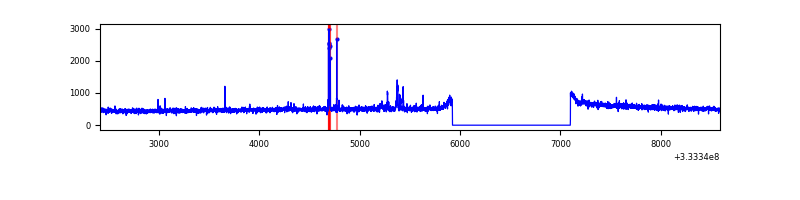 |
| C | 6174 | 4999 | 0 | 0 | 0.00% | 0.00% | 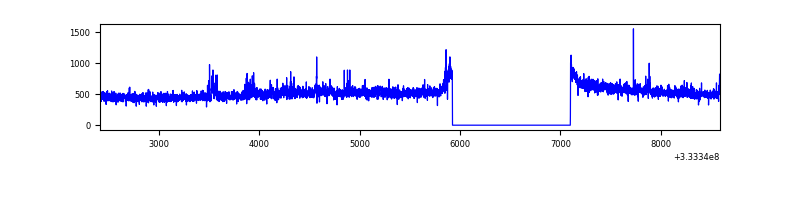 |
| D | 6174 | 4999 | 3 | 3 | 0.05% | 0.06% | 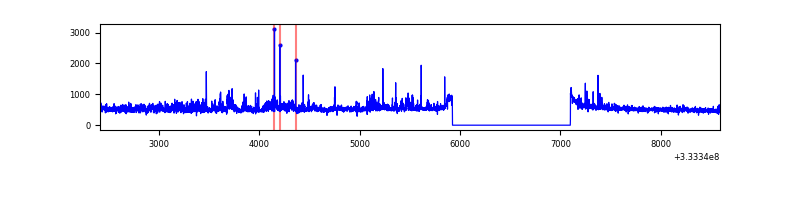 |
Top three noisy pixels from each quadrant. If the there are fewer than three noisy pixels in the level2.evt file, extra rows are filled as -1
| Pixel properties | Quadrant properties | ||||||
|---|---|---|---|---|---|---|---|
| Quadrant | DetID | PixID | Counts | Sigma | Mean | Median | Sigma |
| A | 0 | 13 | 300919 | 2311.33 | 653 | 642 | 129.9 |
| A | 13 | 254 | 8073 | 57.2 | 653 | 642 | 129.9 |
| A | 11 | 29 | 6962 | 48.65 | 653 | 642 | 129.9 |
| B | 0 | 190 | 30093 | 243.68 | 648 | 633 | 120.9 |
| B | 0 | 245 | 23351 | 187.91 | 648 | 633 | 120.9 |
| B | 12 | 111 | 14523 | 114.89 | 648 | 633 | 120.9 |
| C | 14 | 238 | 102926 | 704.12 | 625 | 629 | 145.3 |
| C | 5 | 4 | 57608 | 392.19 | 625 | 629 | 145.3 |
| C | 2 | 16 | 15160 | 100.02 | 625 | 629 | 145.3 |
| D | 7 | 80 | 179879 | 1187.37 | 634 | 620 | 151.0 |
| D | 1 | 52 | 176671 | 1166.12 | 634 | 620 | 151.0 |
| D | 2 | 234 | 19468 | 124.84 | 634 | 620 | 151.0 |
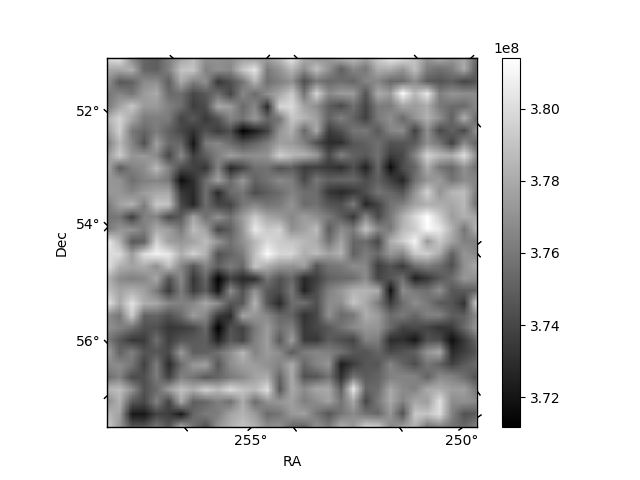
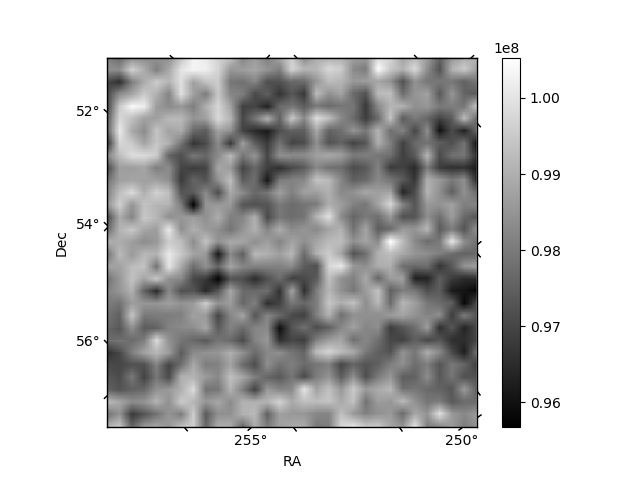
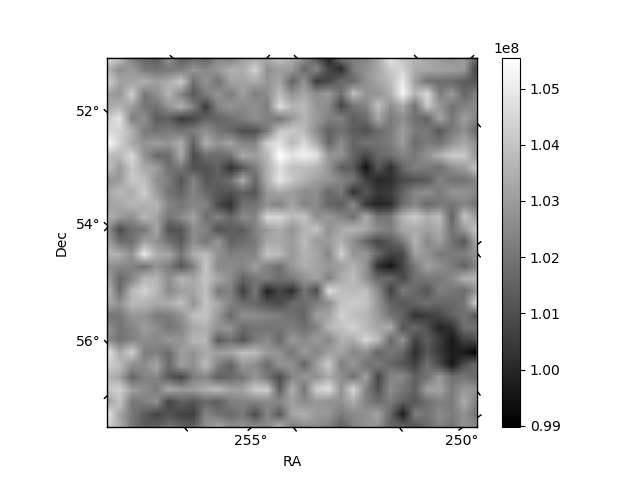
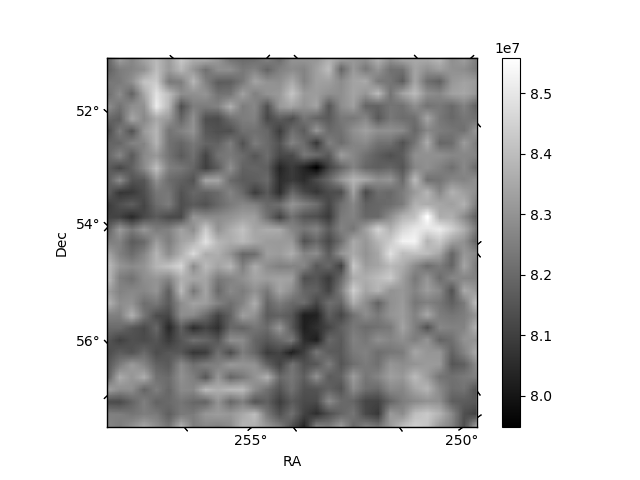
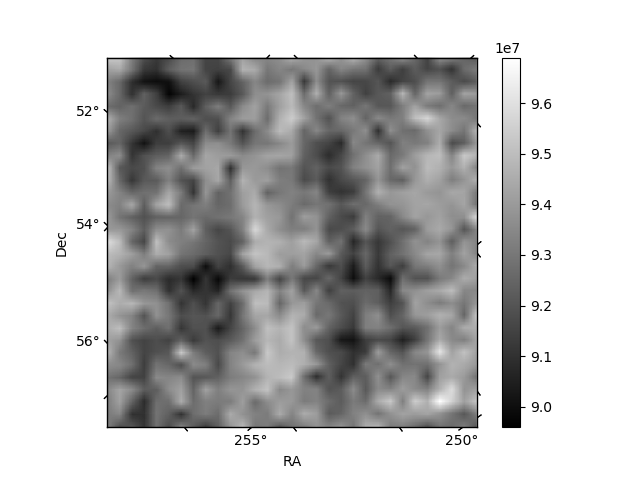
Histogram calculated using DETX and DETY for each event in the final _common_clean file
| Quadrant A | 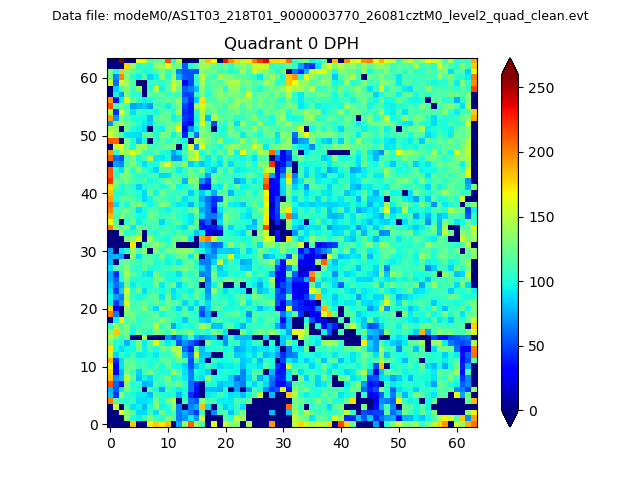 |
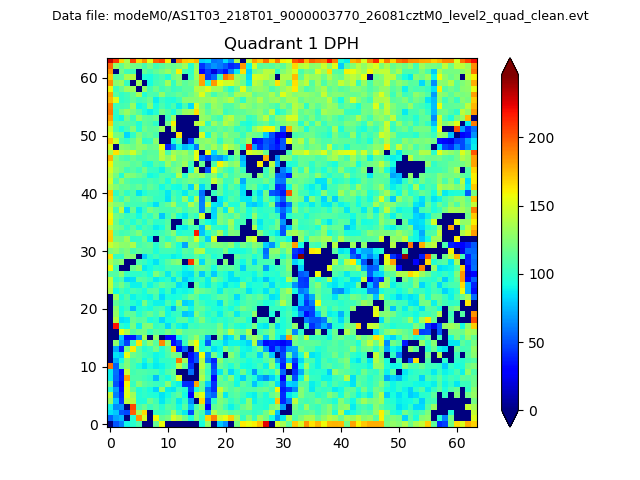 |
Quadrant B |
|---|---|---|---|
| Quadrant D |  |
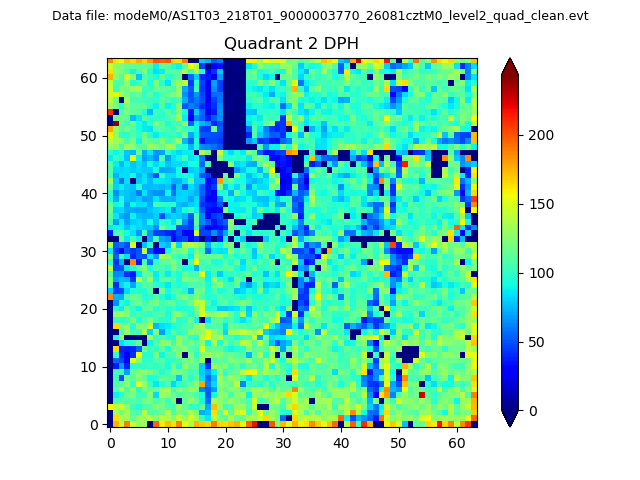 |
Quadrant C |
| Plot type | Count rate plots | Images |
|---|---|---|
| Comparison with Poisson distribution Blue bars denote a histogram of data divided into 1 sec bins. Red curve is a Poisson curve with rate = median count rate of data. |
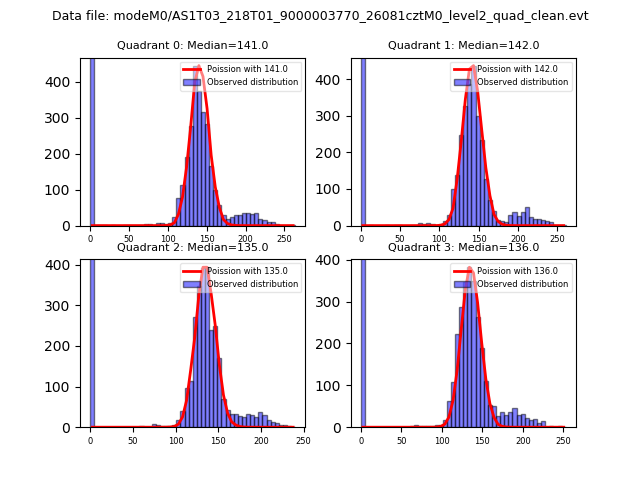 |
 |
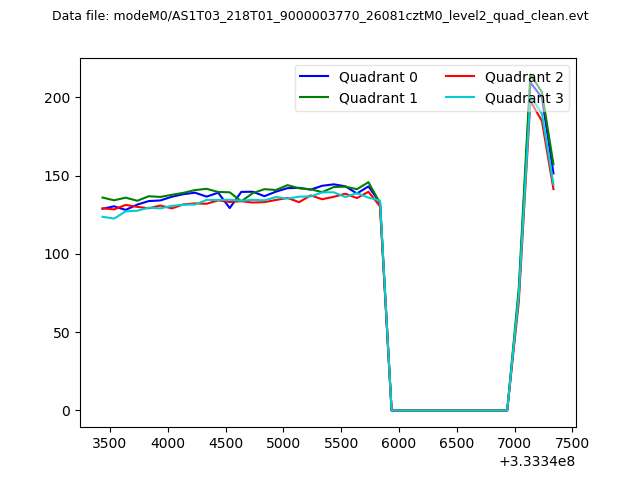
| Quadrant-wise count rates Data is divided into 100 sec bins |
 |
|
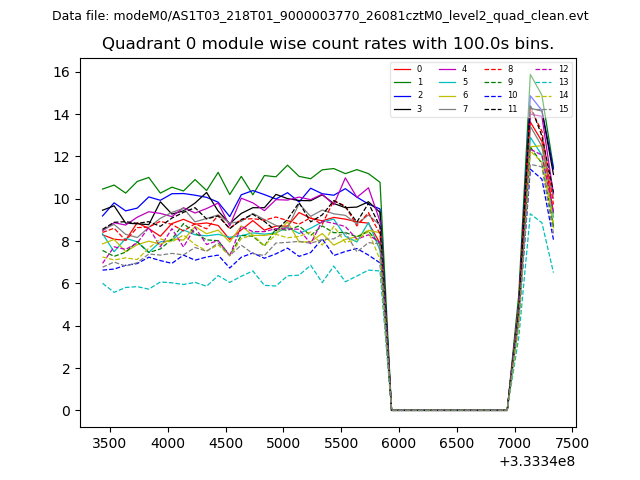
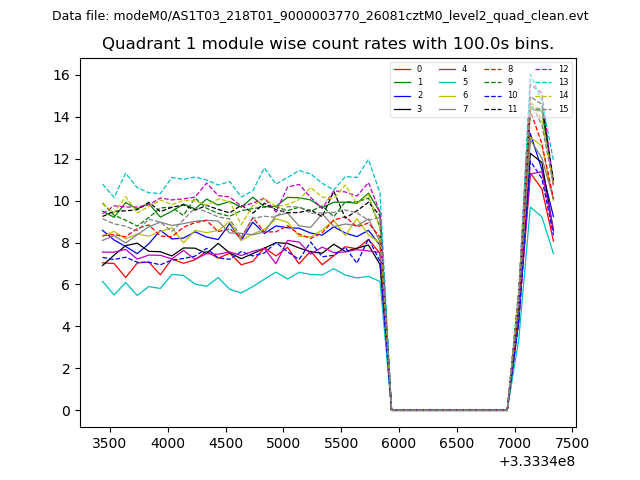
| Module-wise count rates for Quadrant A Data is divided into 100 sec bins |
 |
 |
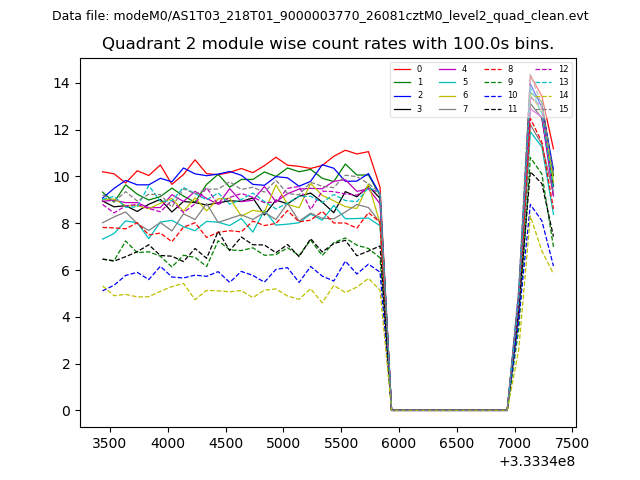
| Module-wise count rates for Quadrant B Data is divided into 100 sec bins |
 |
 |
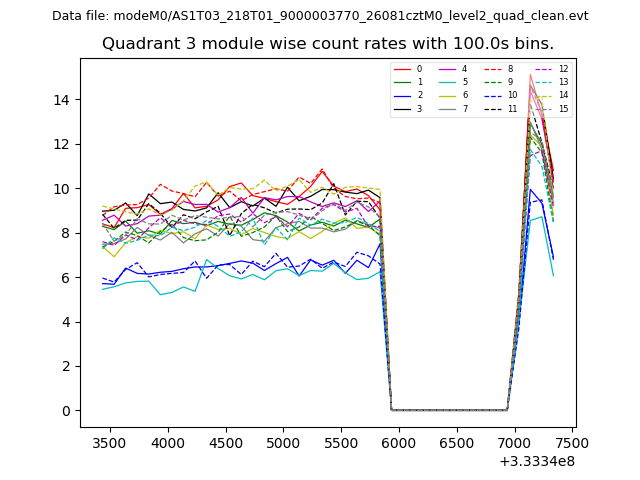
| Module-wise count rates for Quadrant C Data is divided into 100 sec bins |
 |
 |
| Module-wise count rates for Quadrant D Data is divided into 100 sec bins |
 |
 |
| Parameter | Plot |
|---|---|
| CZT HV Monitor | 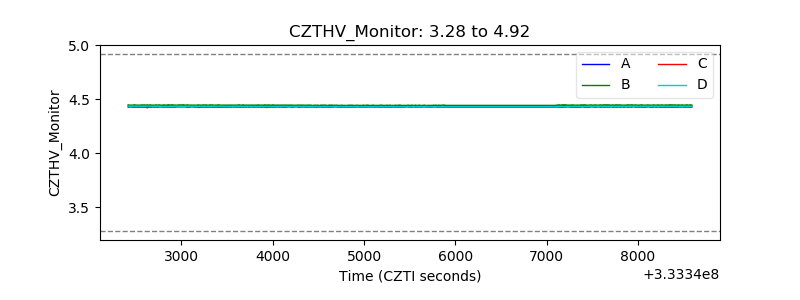 |
| D_VDD | 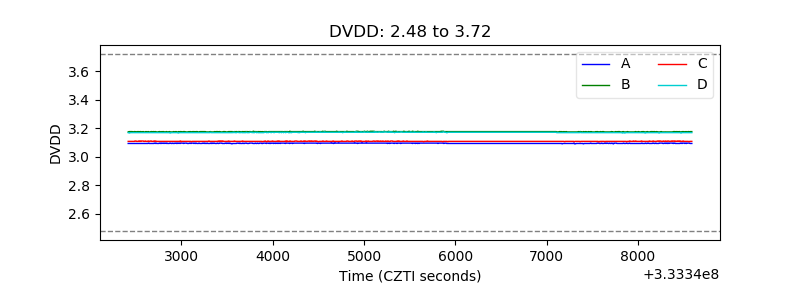 |
| Temperature 1 | 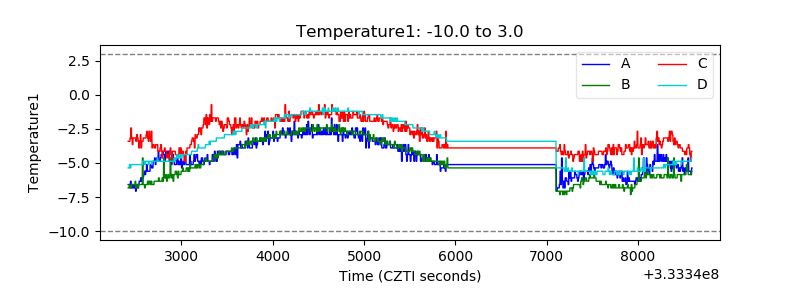 |
| Veto HV Monitor |  |
| Veto LLD | 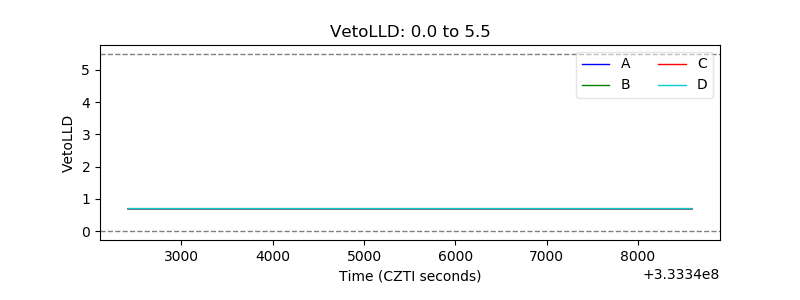 |
| Alpha Counter | 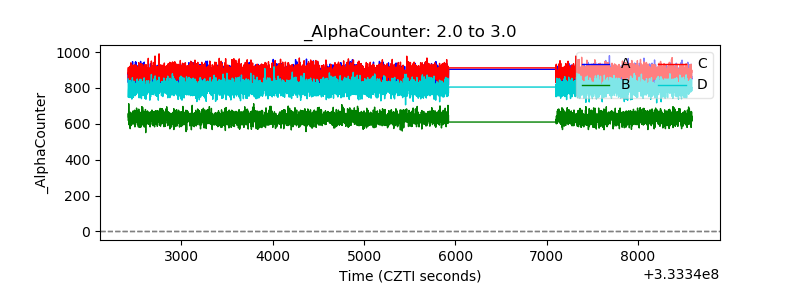 |
| _CPM_Rate |  |
| CZT Counter | 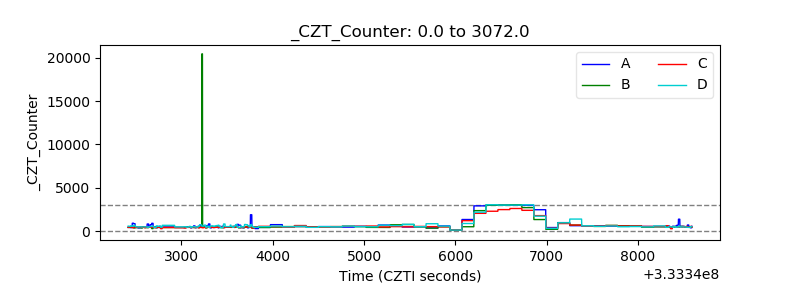 |
| +2.5 Volts monitor | 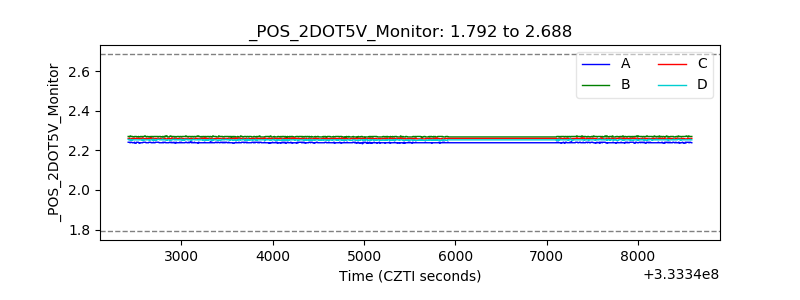 |
| +5 Volts monitor | 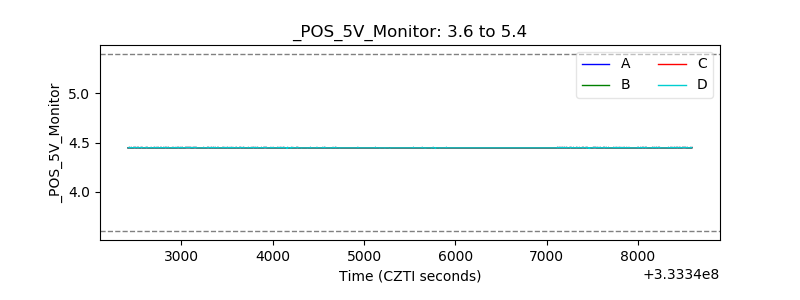 |
| _ROLL_ROT | 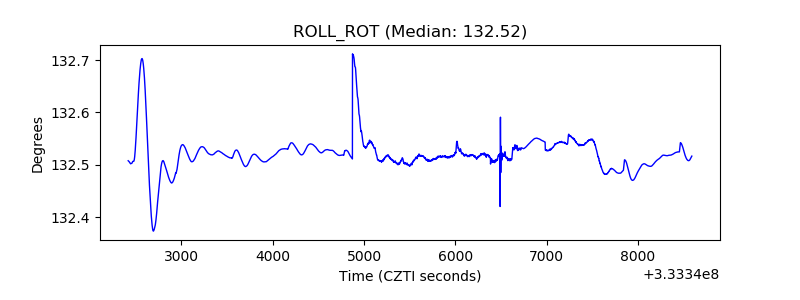 |
| _Roll_DEC | 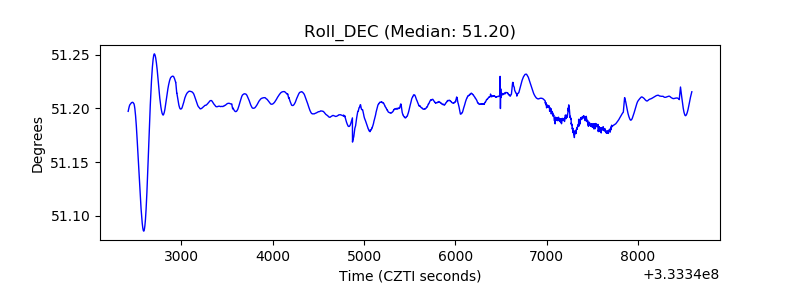 |
| _Roll_RA | 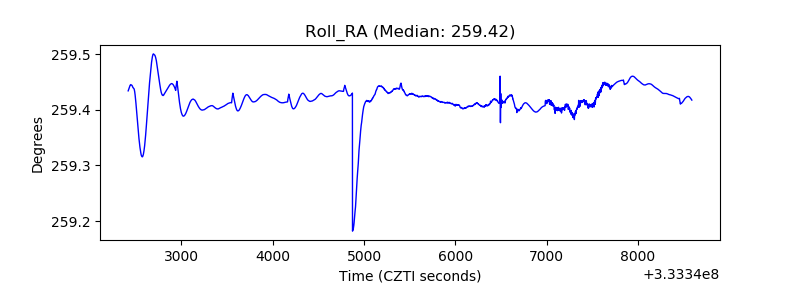 |
| Veto Counter | 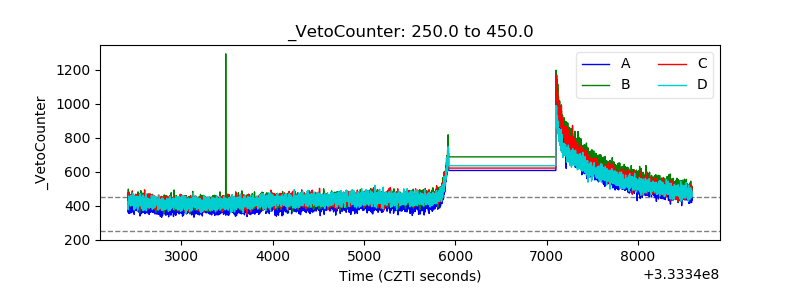 |