| Param | Original file | Final file |
|---|---|---|
| Filename | modeM0/AS1T03_218T01_9000003770_26083cztM0_level2.evt | modeM0/AS1T03_218T01_9000003770_26083cztM0_level2_quad_clean.evt |
| Size (bytes) | 747,630,720 | 137,476,800 |
| Size | 713.0 MB | 131.1 MB |
| Events in quadrant A | 5,621,577 | 890,927 |
| Events in quadrant B | 5,406,347 | 900,221 |
| Events in quadrant C | 5,300,625 | 839,690 |
| Events in quadrant D | 5,639,396 | 842,459 |
| Mode M0 | |||
|---|---|---|---|
| Quadrant | BADHDUFLAG | Total packets | Discarded packets |
| A | 0 | 22714 | 0 |
| B | 0 | 21979 | 0 |
| C | 0 | 21539 | 0 |
| D | 0 | 22875 | 0 |
| Mode M9 | |||
|---|---|---|---|
| Quadrant | BADHDUFLAG | Total packets | Discarded packets |
| A | 0 | 28 | 0 |
| B | 0 | 28 | 0 |
| C | 0 | 28 | 0 |
| D | 0 | 28 | 0 |
| Quadrant | Total seconds | Saturated seconds | Saturation percentage |
|---|---|---|---|
| A | 9970 | 130 | 1.303912% |
| B | 9971 | 146 | 1.464246% |
| C | 9970 | 152 | 1.524574% |
| D | 9971 | 100 | 1.002908% |
Noise dominated data is calculated using 1-second bins in cleaned event files. If a bin has >2000 counts, and if more than 50% of those come from <1% of pixels, then it is considered to be noise-dominated and hence unusable.
| Quadrant | # 1 sec bins | Bins with >0 counts | Bins with >2000 counts | High rate bins dominated by noise | Noise dominated (total time) | Noise dominated (detector-on time) | Marked lightcurve |
|---|---|---|---|---|---|---|---|
| A | 12645 | 9970 | 12 | 12 | 0.09% | 0.12% | 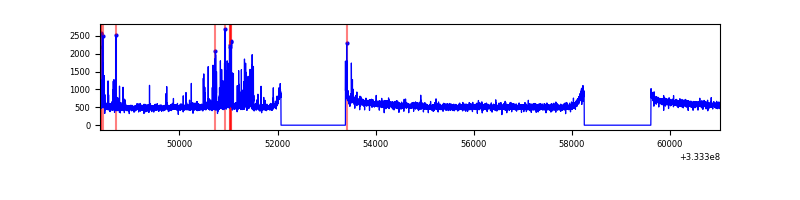 |
| B | 12646 | 9971 | 6 | 6 | 0.05% | 0.06% | 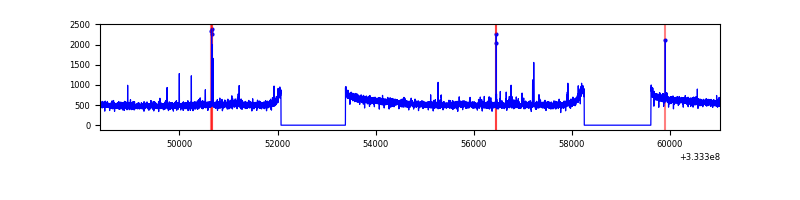 |
| C | 12646 | 9971 | 0 | 0 | 0.00% | 0.00% | 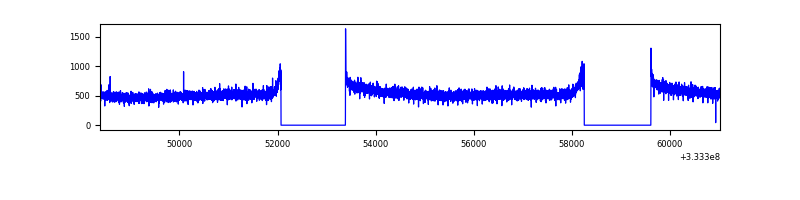 |
| D | 12646 | 9971 | 24 | 24 | 0.19% | 0.24% | 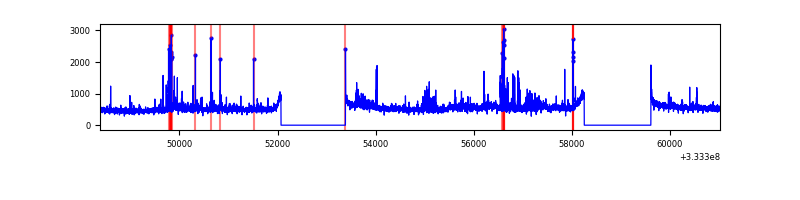 |
Top three noisy pixels from each quadrant. If the there are fewer than three noisy pixels in the level2.evt file, extra rows are filled as -1
| Pixel properties | Quadrant properties | ||||||
|---|---|---|---|---|---|---|---|
| Quadrant | DetID | PixID | Counts | Sigma | Mean | Median | Sigma |
| A | 0 | 13 | 274670 | 1018.31 | 1387 | 1365 | 268.4 |
| A | 13 | 254 | 14535 | 49.07 | 1387 | 1365 | 268.4 |
| A | 0 | 226 | 12048 | 39.8 | 1387 | 1365 | 268.4 |
| B | 12 | 111 | 29998 | 114.71 | 1363 | 1333 | 249.9 |
| B | 11 | 111 | 26680 | 101.43 | 1363 | 1333 | 249.9 |
| B | 14 | 111 | 24592 | 93.07 | 1363 | 1333 | 249.9 |
| C | 14 | 238 | 216559 | 726.69 | 1298 | 1306 | 296.2 |
| C | 3 | 233 | 20493 | 64.77 | 1298 | 1306 | 296.2 |
| C | 13 | 61 | 9235 | 26.77 | 1298 | 1306 | 296.2 |
| D | 1 | 52 | 356386 | 1131.83 | 1329 | 1301 | 313.7 |
| D | 7 | 80 | 129556 | 408.81 | 1329 | 1301 | 313.7 |
| D | 12 | 233 | 58912 | 183.63 | 1329 | 1301 | 313.7 |
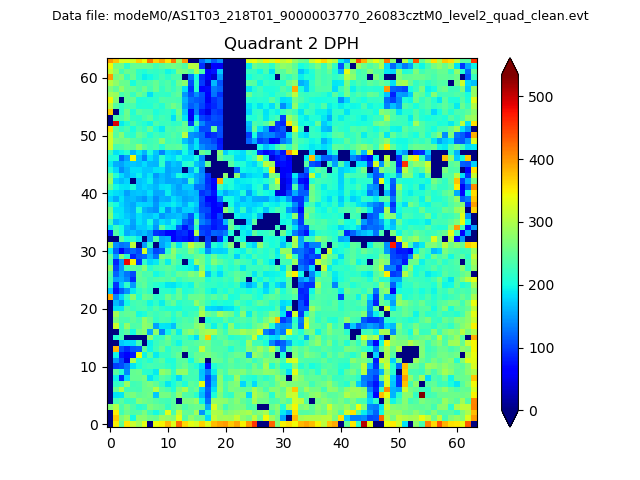
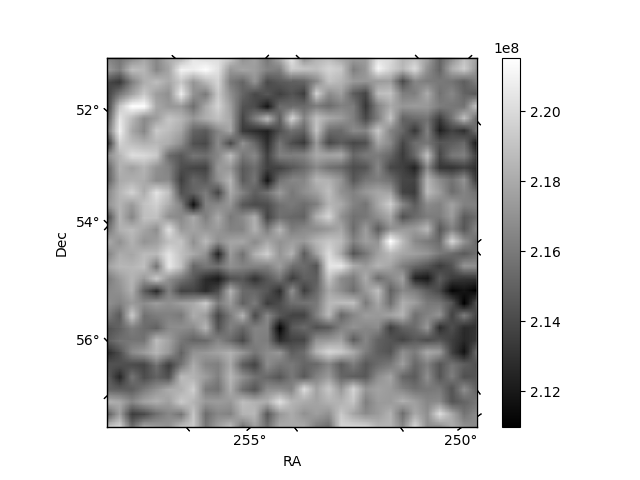
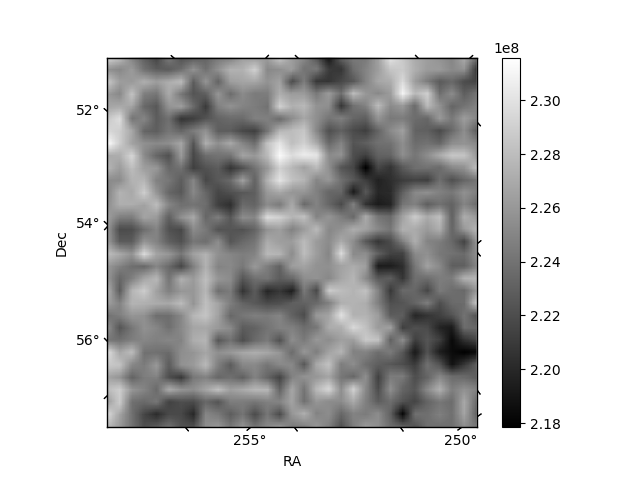
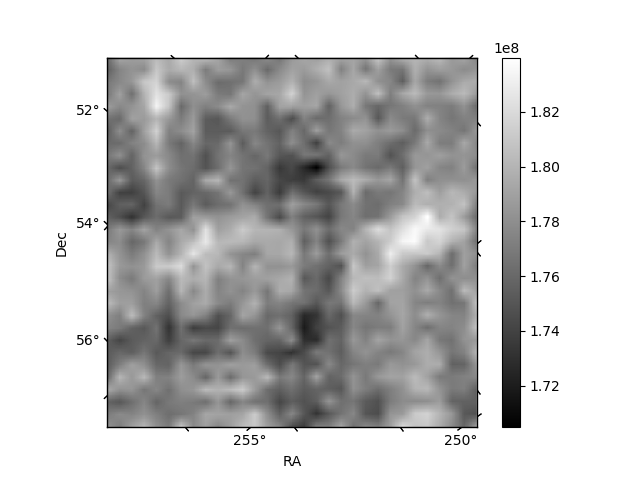
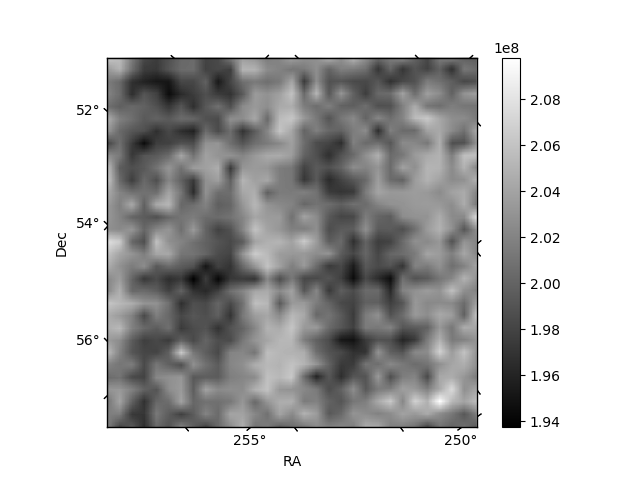
Histogram calculated using DETX and DETY for each event in the final _common_clean file
| Quadrant A | 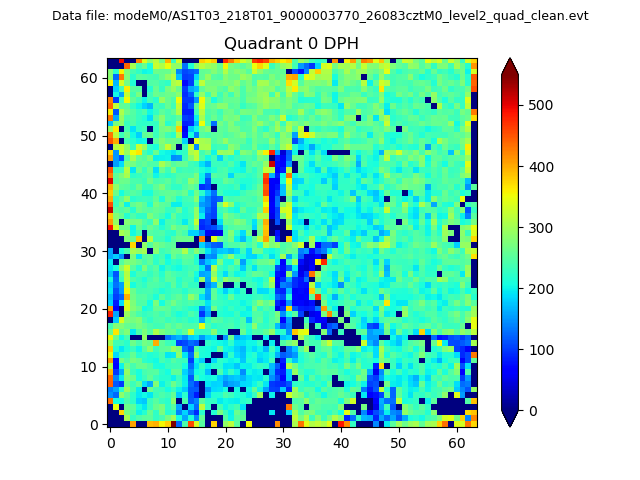 |
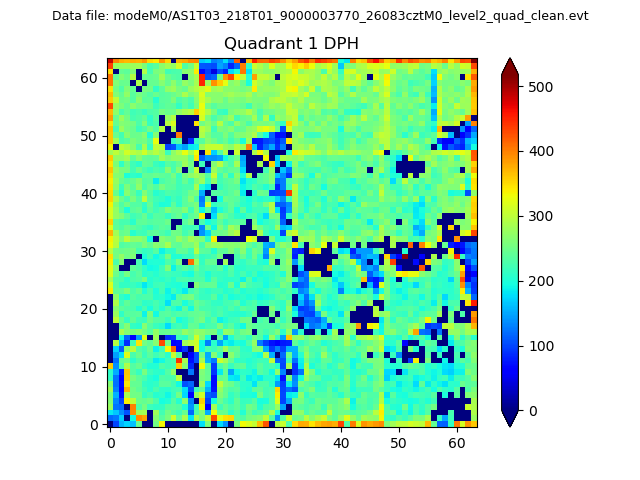 |
Quadrant B |
|---|---|---|---|
| Quadrant D | 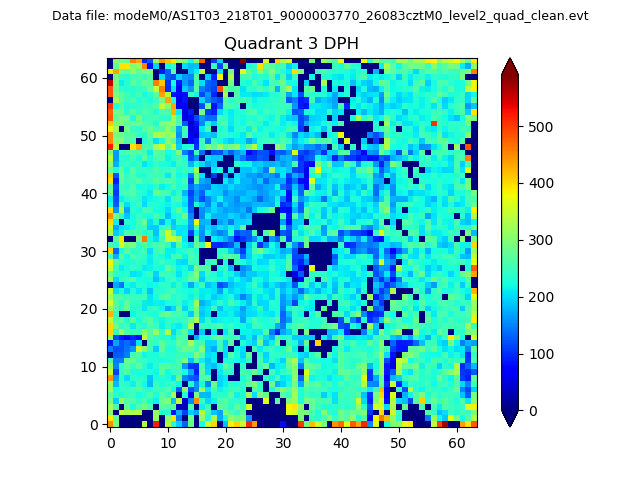 |
 |
Quadrant C |
| Plot type | Count rate plots | Images |
|---|---|---|
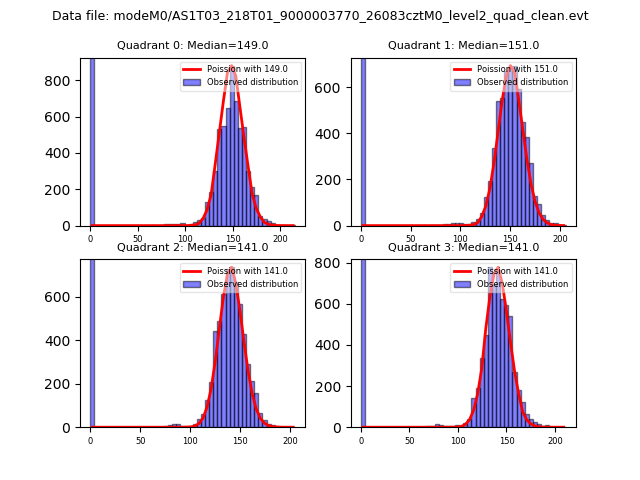
| Comparison with Poisson distribution Blue bars denote a histogram of data divided into 1 sec bins. Red curve is a Poisson curve with rate = median count rate of data. |
 |
 |
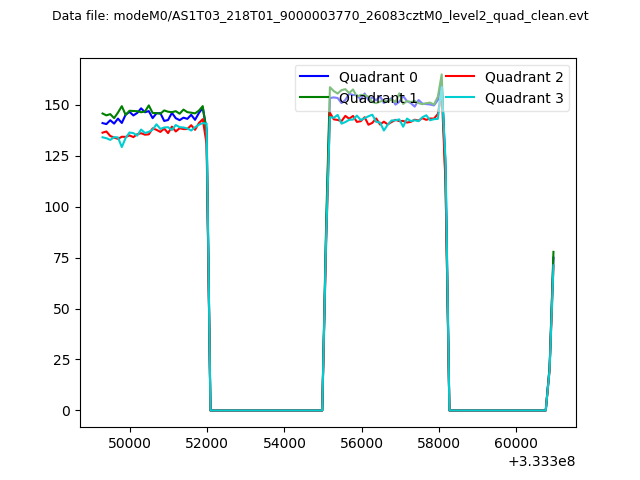
| Quadrant-wise count rates Data is divided into 100 sec bins |
 |
|
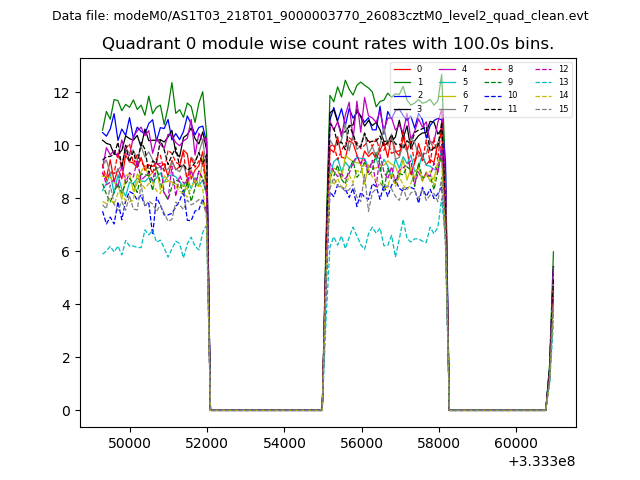
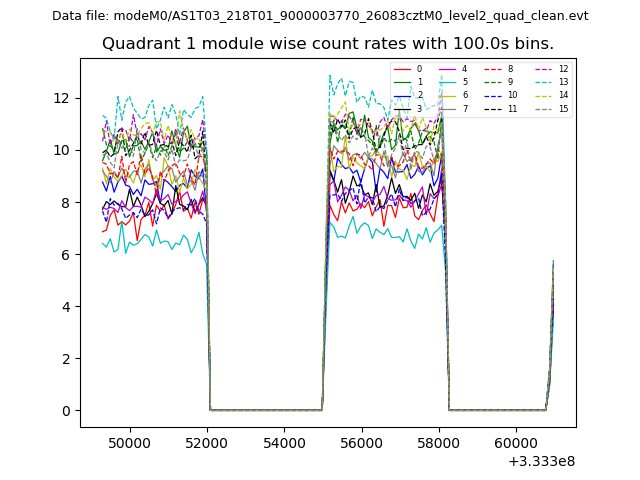
| Module-wise count rates for Quadrant A Data is divided into 100 sec bins |
 |
 |
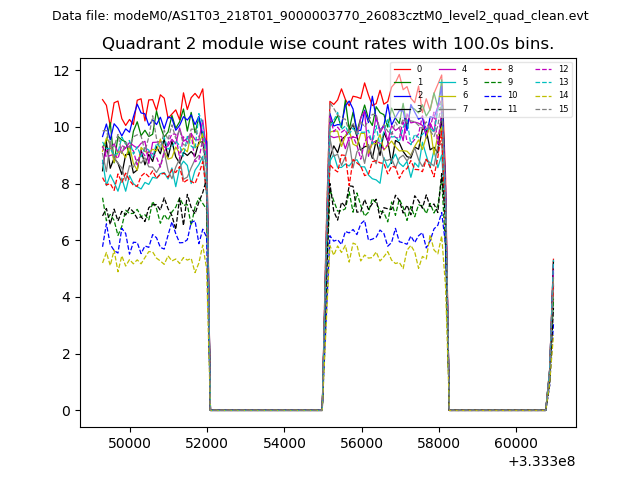
| Module-wise count rates for Quadrant B Data is divided into 100 sec bins |
 |
 |
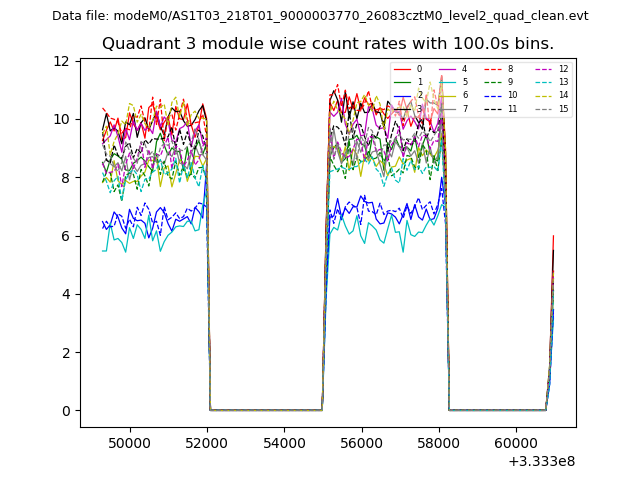
| Module-wise count rates for Quadrant C Data is divided into 100 sec bins |
 |
 |
| Module-wise count rates for Quadrant D Data is divided into 100 sec bins |
 |
 |
| Parameter | Plot |
|---|---|
| CZT HV Monitor | 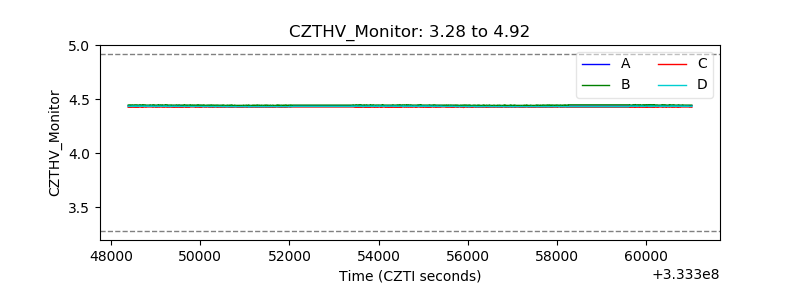 |
| D_VDD | 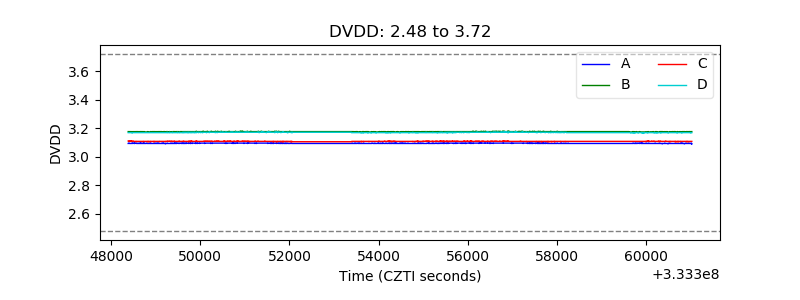 |
| Temperature 1 | 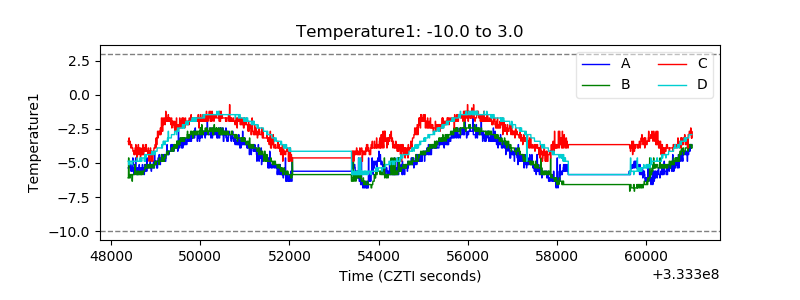 |
| Veto HV Monitor | 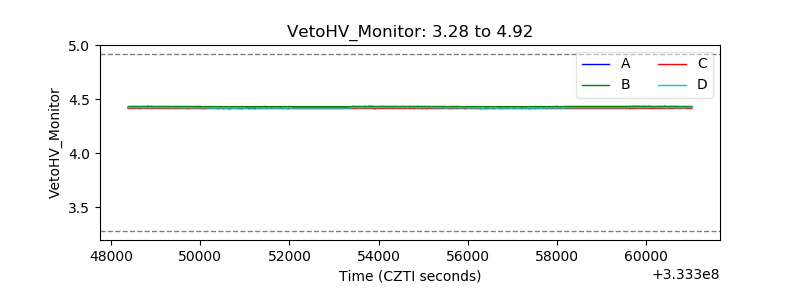 |
| Veto LLD | 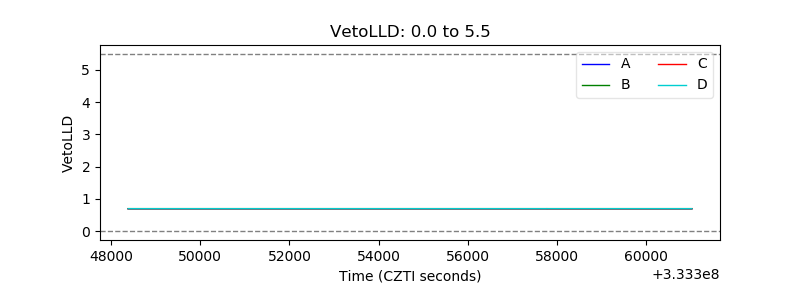 |
| Alpha Counter | 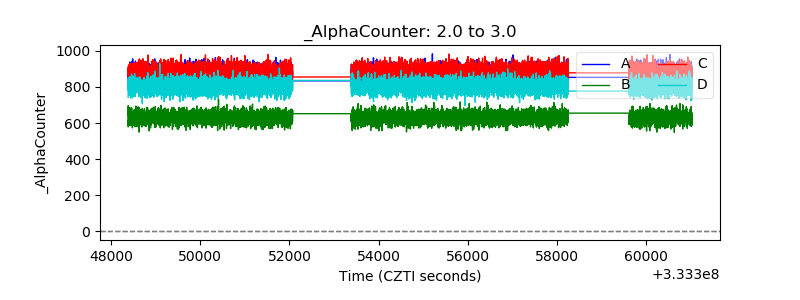 |
| _CPM_Rate | 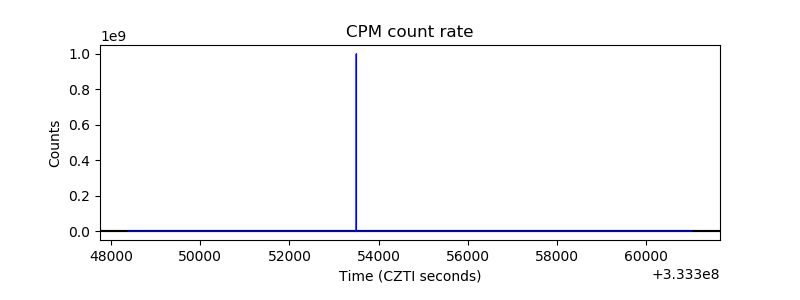 |
| CZT Counter | 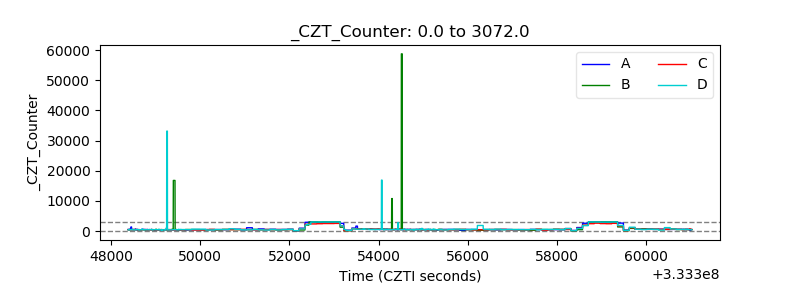 |
| +2.5 Volts monitor |  |
| +5 Volts monitor |  |
| _ROLL_ROT | 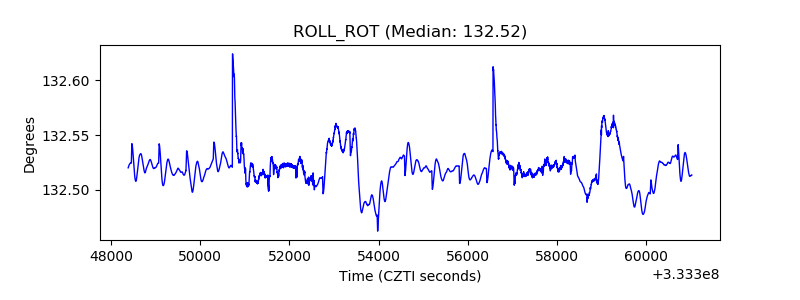 |
| _Roll_DEC | 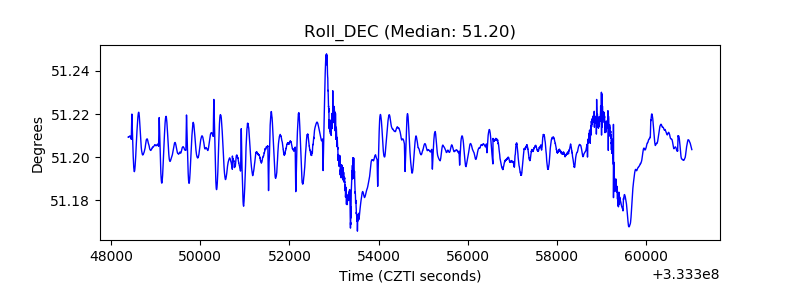 |
| _Roll_RA | 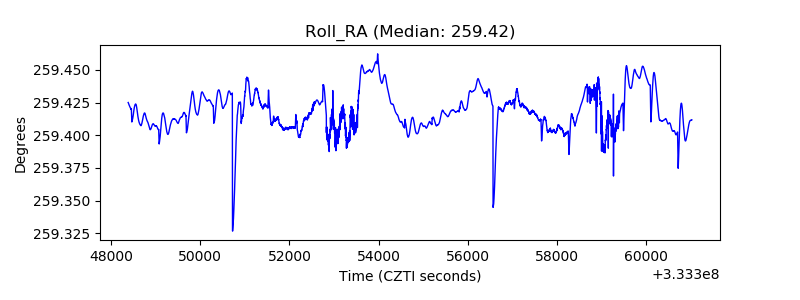 |
| Veto Counter | 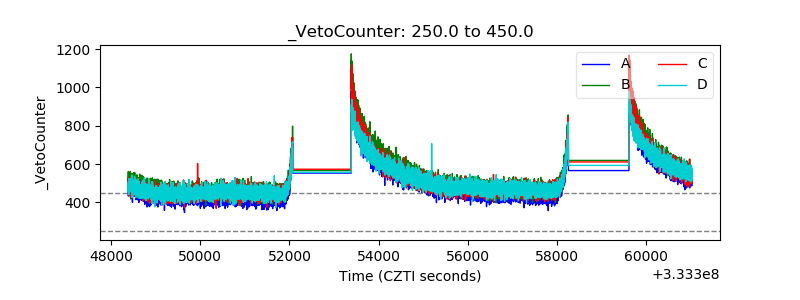 |