| Param | Original file | Final file |
|---|---|---|
| Filename | modeM0/AS1T03_218T01_9000003770_26084cztM0_level2.evt | modeM0/AS1T03_218T01_9000003770_26084cztM0_level2_quad_clean.evt |
| Size (bytes) | 278,242,560 | 55,598,400 |
| Size | 265.4 MB | 53.0 MB |
| Events in quadrant A | 2,025,147 | 368,996 |
| Events in quadrant B | 2,028,692 | 368,955 |
| Events in quadrant C | 1,974,425 | 341,104 |
| Events in quadrant D | 2,146,468 | 343,413 |
| Mode M0 | |||
|---|---|---|---|
| Quadrant | BADHDUFLAG | Total packets | Discarded packets |
| A | 0 | 8224 | 0 |
| B | 0 | 8268 | 0 |
| C | 0 | 7986 | 0 |
| D | 0 | 8620 | 0 |
| Mode M9 | |||
|---|---|---|---|
| Quadrant | BADHDUFLAG | Total packets | Discarded packets |
| A | 0 | 5 | 0 |
| B | 0 | 6 | 0 |
| C | 0 | 6 | 0 |
| D | 0 | 6 | 0 |
| Quadrant | Total seconds | Saturated seconds | Saturation percentage |
|---|---|---|---|
| A | 3688 | 9 | 0.244035% |
| B | 3688 | 19 | 0.515184% |
| C | 3688 | 24 | 0.650759% |
| D | 3688 | 11 | 0.298265% |
Noise dominated data is calculated using 1-second bins in cleaned event files. If a bin has >2000 counts, and if more than 50% of those come from <1% of pixels, then it is considered to be noise-dominated and hence unusable.
| Quadrant | # 1 sec bins | Bins with >0 counts | Bins with >2000 counts | High rate bins dominated by noise | Noise dominated (total time) | Noise dominated (detector-on time) | Marked lightcurve |
|---|---|---|---|---|---|---|---|
| A | 3688 | 3688 | 1 | 1 | 0.03% | 0.03% | 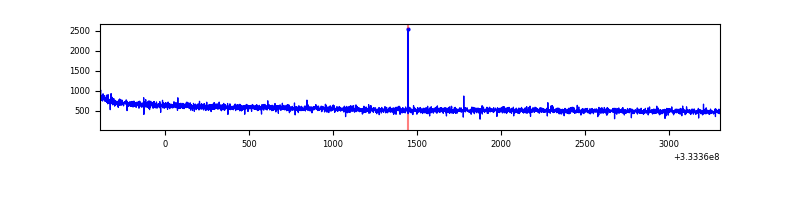 |
| B | 3688 | 3688 | 2 | 2 | 0.05% | 0.05% | 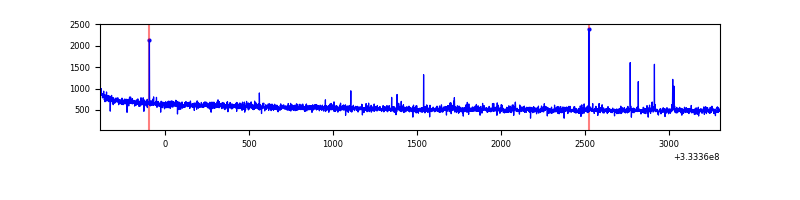 |
| C | 3688 | 3688 | 0 | 0 | 0.00% | 0.00% | 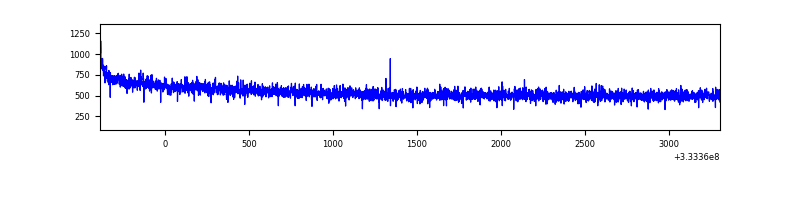 |
| D | 3688 | 3688 | 2 | 2 | 0.05% | 0.05% | 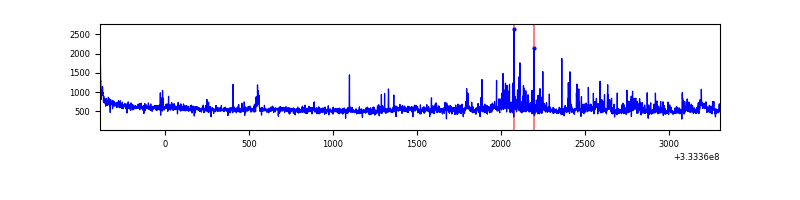 |
Top three noisy pixels from each quadrant. If the there are fewer than three noisy pixels in the level2.evt file, extra rows are filled as -1
| Pixel properties | Quadrant properties | ||||||
|---|---|---|---|---|---|---|---|
| Quadrant | DetID | PixID | Counts | Sigma | Mean | Median | Sigma |
| A | 13 | 254 | 5695 | 50.46 | 524 | 517 | 102.6 |
| A | 0 | 226 | 4608 | 39.86 | 524 | 517 | 102.6 |
| A | 3 | 137 | 4271 | 36.58 | 524 | 517 | 102.6 |
| B | 12 | 111 | 10554 | 107.4 | 512 | 504 | 93.6 |
| B | 11 | 111 | 9609 | 97.31 | 512 | 504 | 93.6 |
| B | 14 | 111 | 8590 | 86.42 | 512 | 504 | 93.6 |
| C | 14 | 238 | 81447 | 730.37 | 484 | 487 | 110.8 |
| C | 3 | 233 | 3460 | 26.82 | 484 | 487 | 110.8 |
| C | 13 | 61 | 3415 | 26.41 | 484 | 487 | 110.8 |
| D | 7 | 80 | 118216 | 995.74 | 500 | 489 | 118.2 |
| D | 1 | 52 | 116346 | 979.93 | 500 | 489 | 118.2 |
| D | 2 | 234 | 12591 | 102.36 | 500 | 489 | 118.2 |
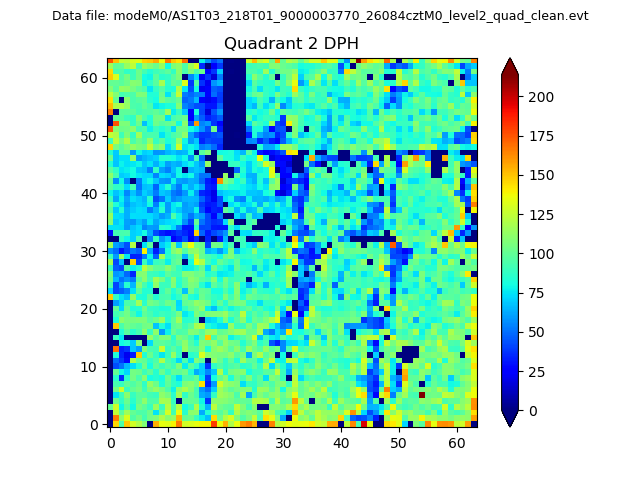
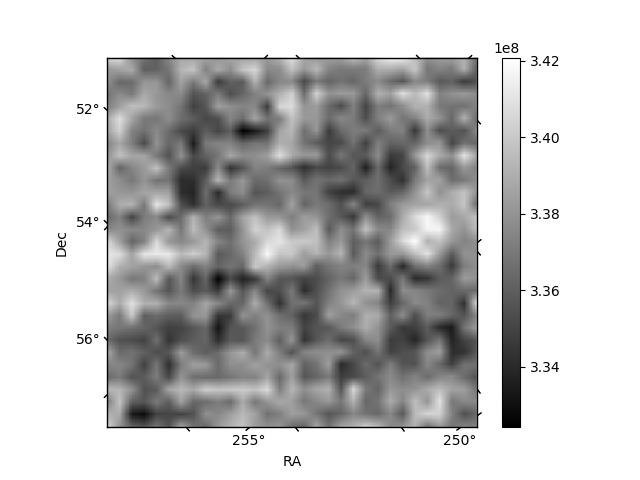
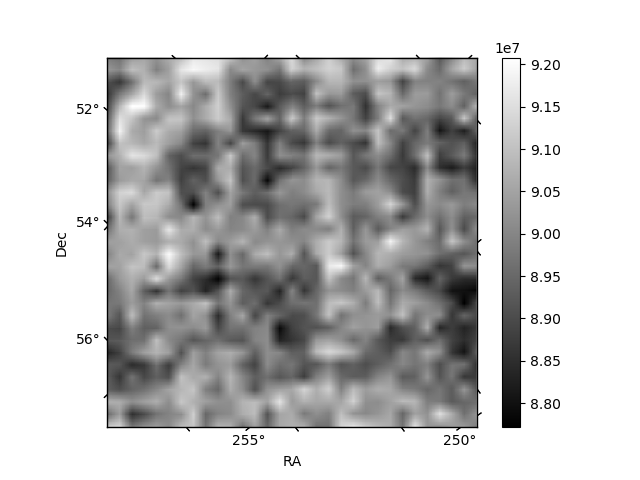
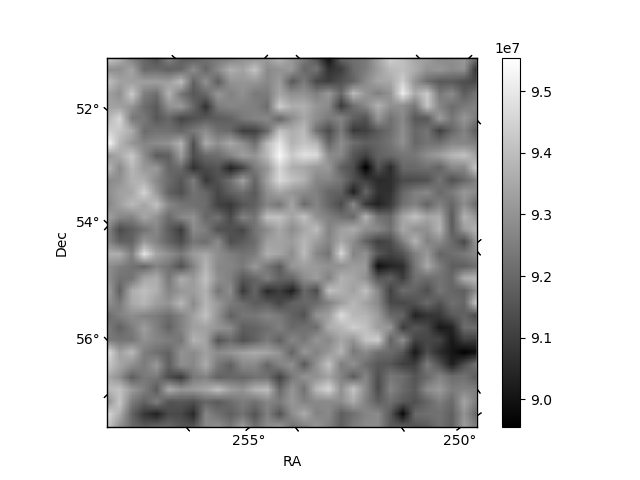
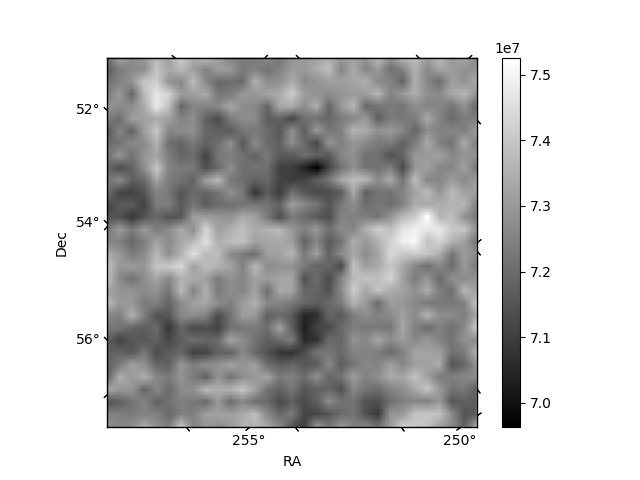
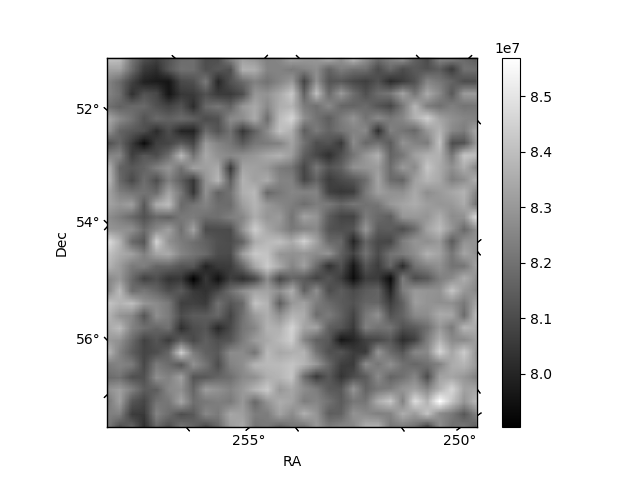
Histogram calculated using DETX and DETY for each event in the final _common_clean file
| Quadrant A | 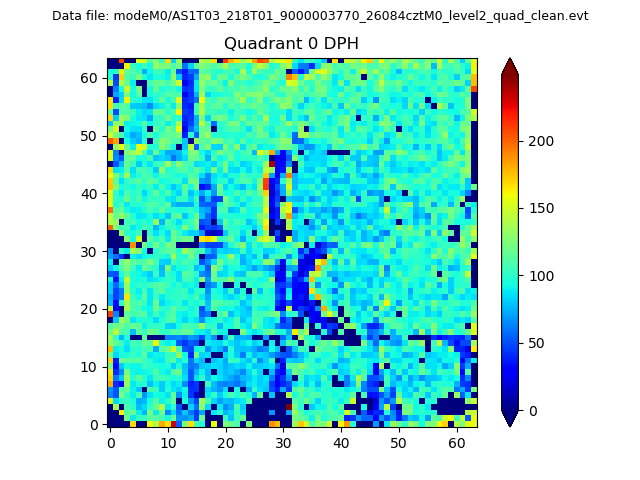 |
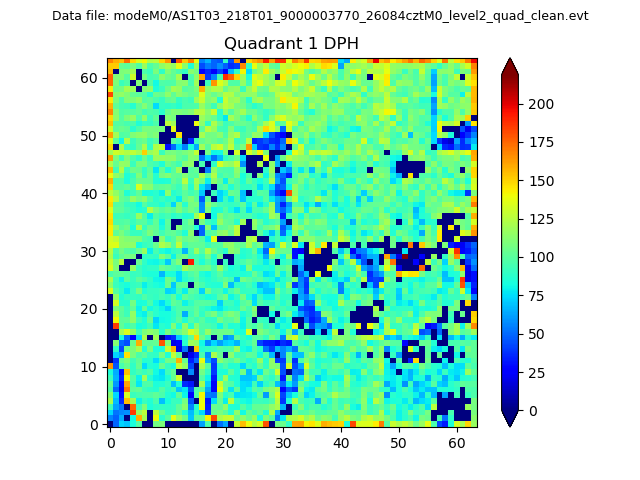 |
Quadrant B |
|---|---|---|---|
| Quadrant D | 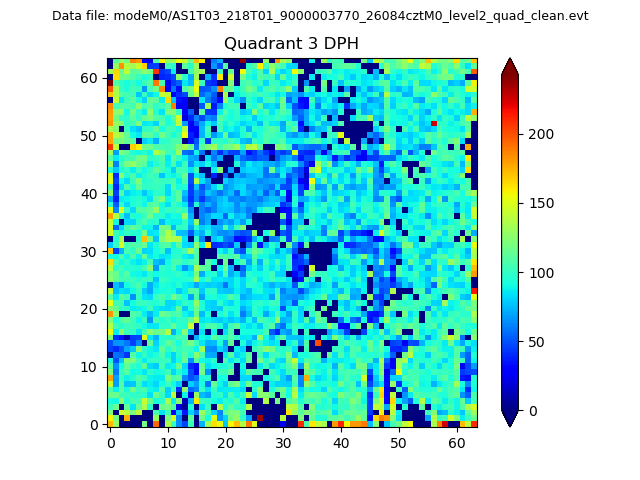 |
 |
Quadrant C |
| Plot type | Count rate plots | Images |
|---|---|---|
| Comparison with Poisson distribution Blue bars denote a histogram of data divided into 1 sec bins. Red curve is a Poisson curve with rate = median count rate of data. |
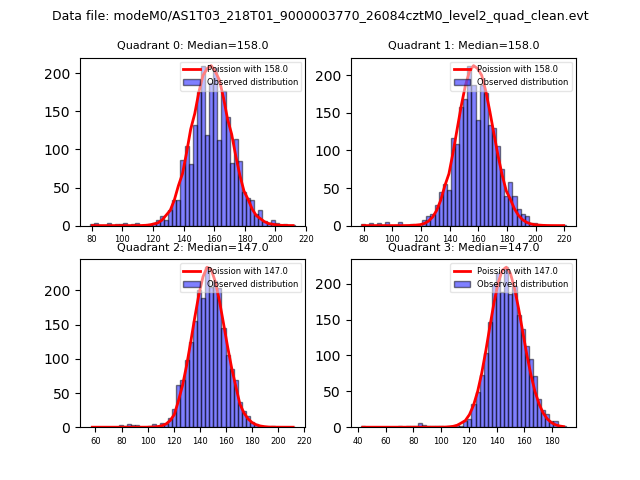 |
 |
| Quadrant-wise count rates Data is divided into 100 sec bins |
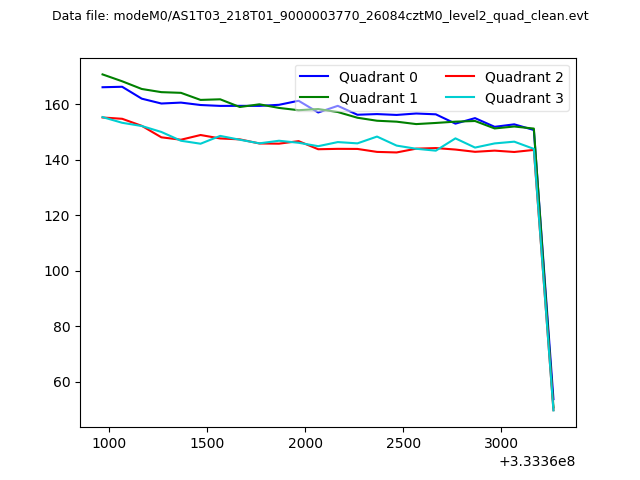 |
|
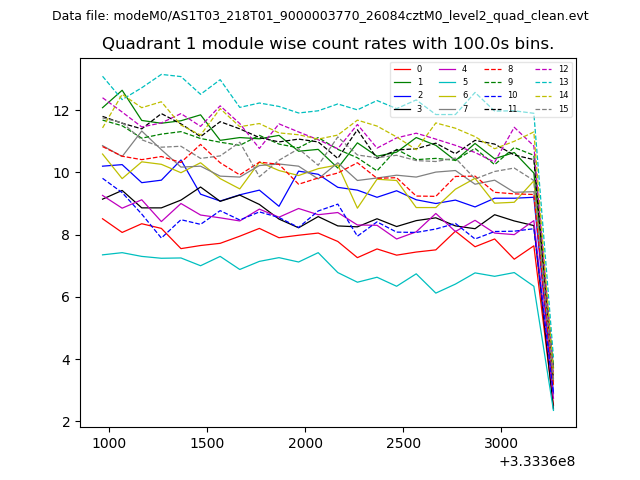
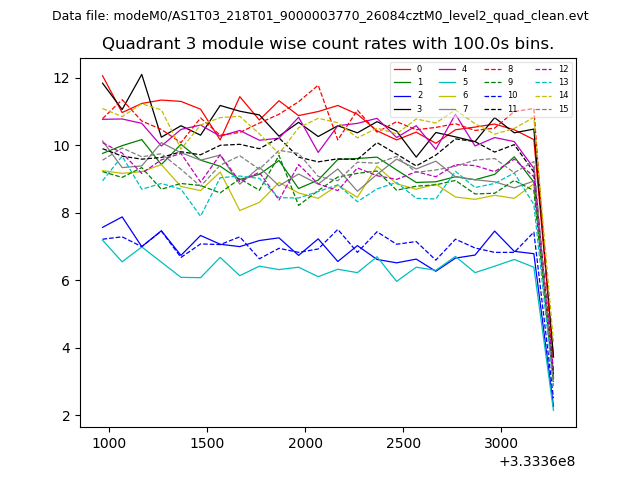
| Module-wise count rates for Quadrant A Data is divided into 100 sec bins |
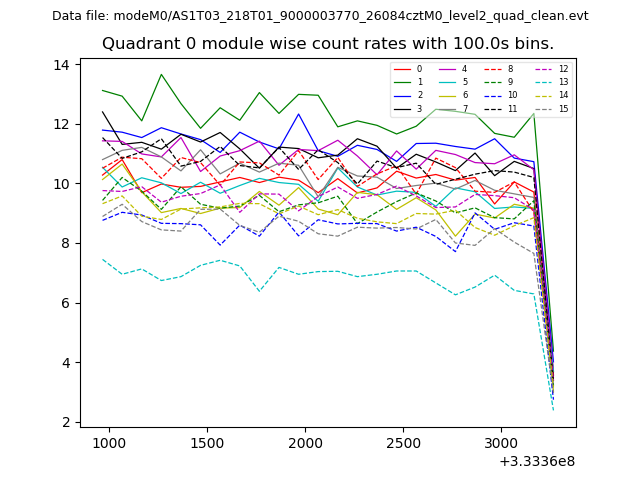 |
 |
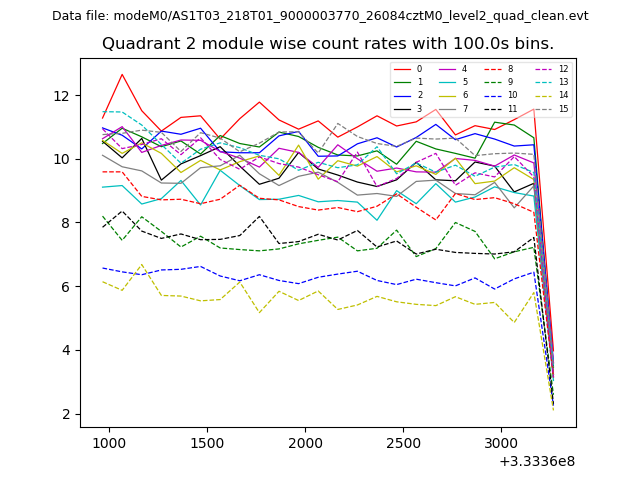
| Module-wise count rates for Quadrant B Data is divided into 100 sec bins |
 |
 |
| Module-wise count rates for Quadrant C Data is divided into 100 sec bins |
 |
 |
| Module-wise count rates for Quadrant D Data is divided into 100 sec bins |
 |
 |
| Parameter | Plot |
|---|---|
| CZT HV Monitor | 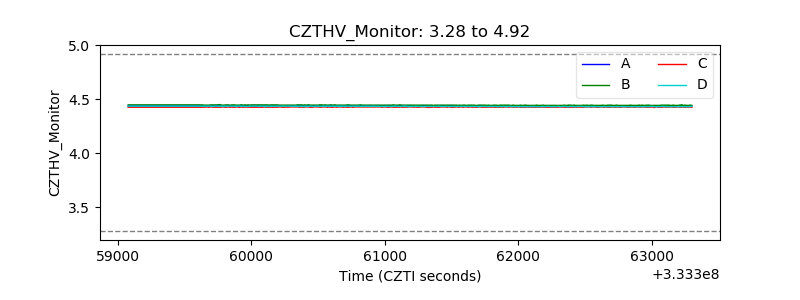 |
| D_VDD | 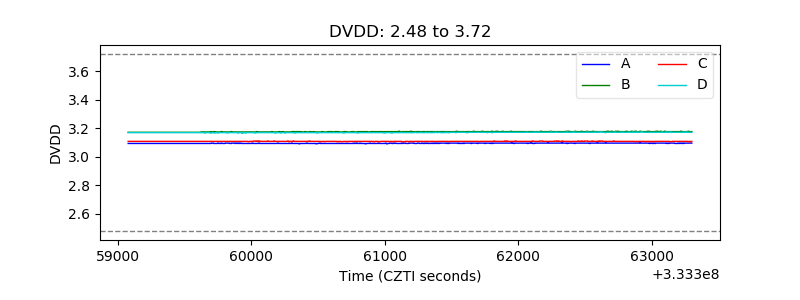 |
| Temperature 1 | 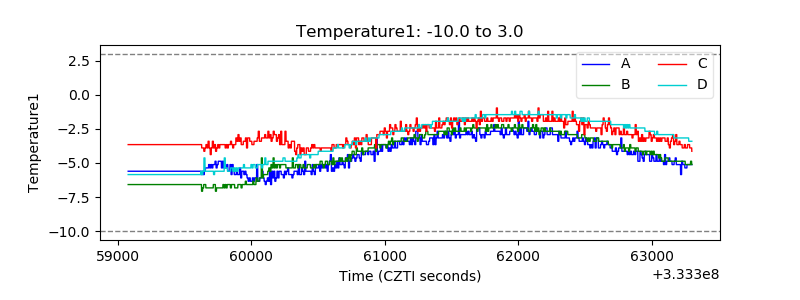 |
| Veto HV Monitor | 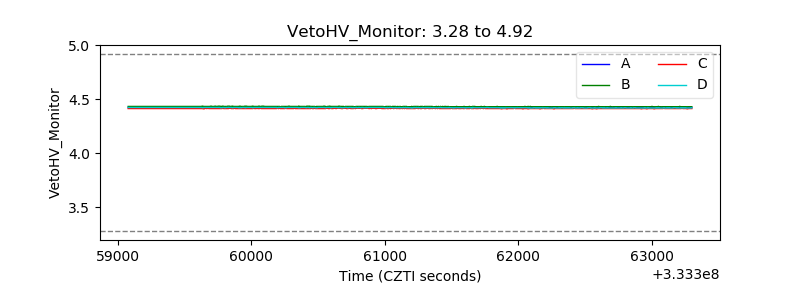 |
| Veto LLD | 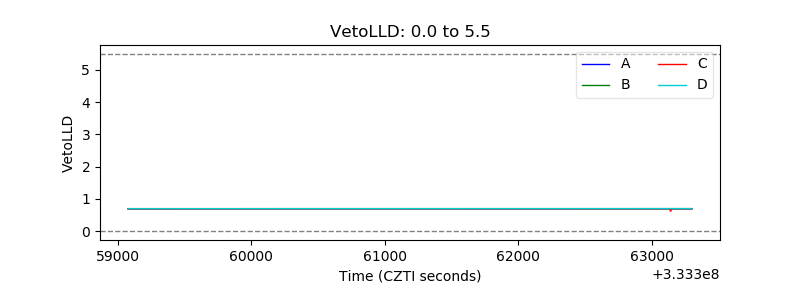 |
| Alpha Counter | 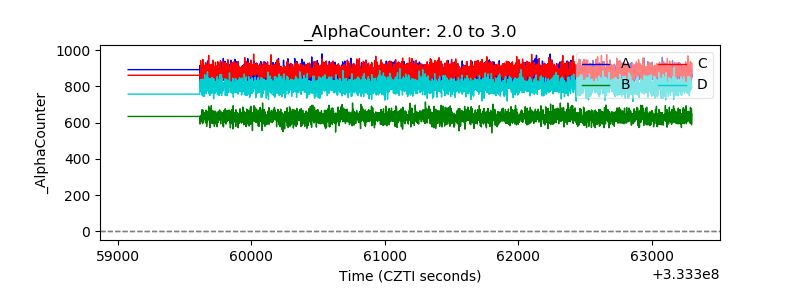 |
| _CPM_Rate | 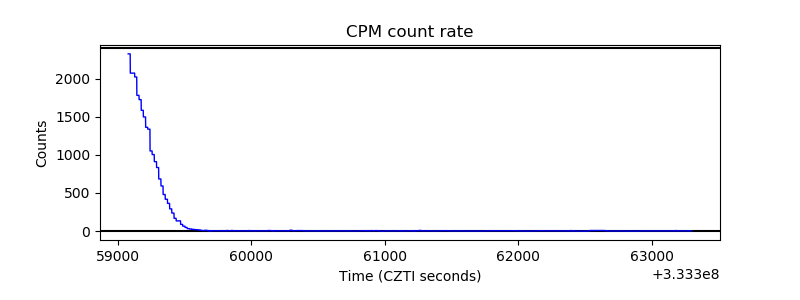 |
| CZT Counter | 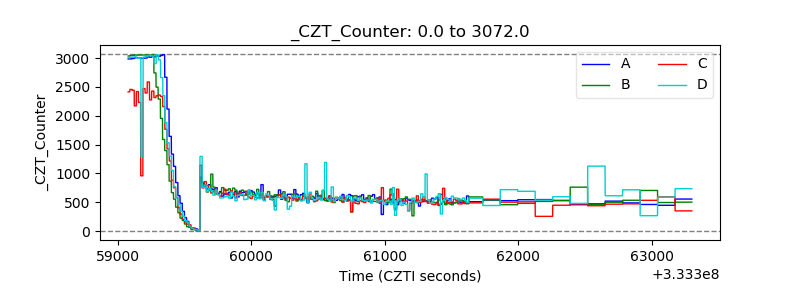 |
| +2.5 Volts monitor | 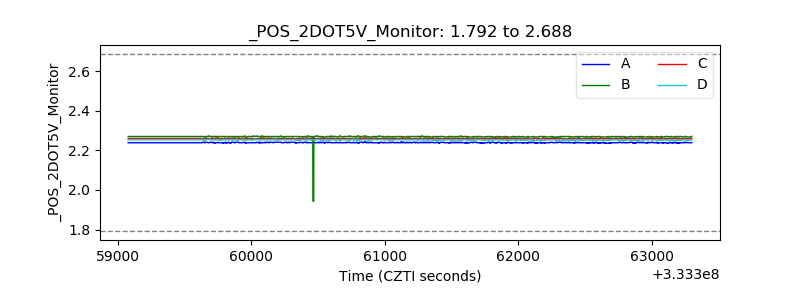 |
| +5 Volts monitor |  |
| _ROLL_ROT | 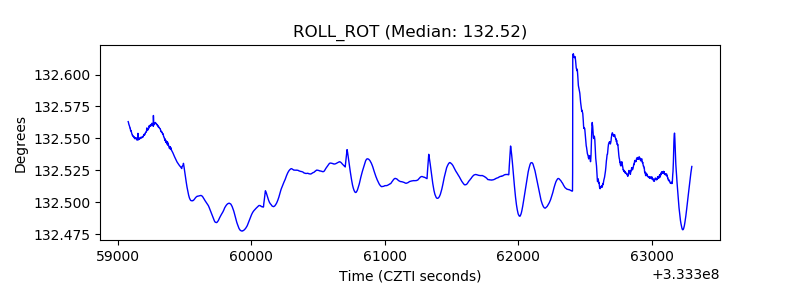 |
| _Roll_DEC | 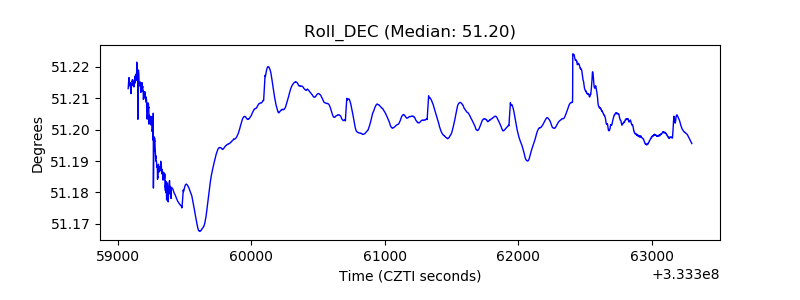 |
| _Roll_RA | 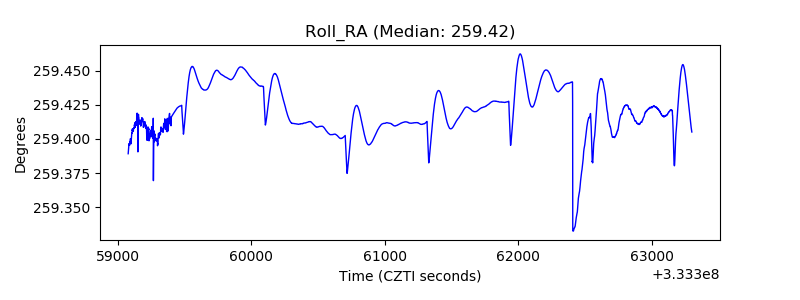 |
| Veto Counter | 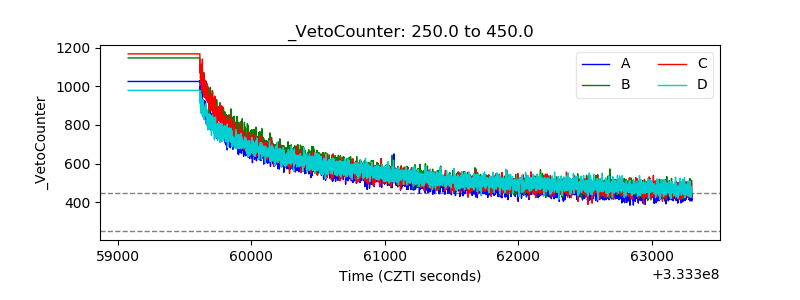 |