| Param | Original file | Final file |
|---|---|---|
| Filename | modeM0/AS1A09_138T04_9000003776cztM0_level2.fits | modeM0/AS1A09_138T04_9000003776cztM0_level2_quad_clean.evt |
| Size (bytes) | 3,249,829,440 | 2,585,188,800 |
| Size | 3.0 GB | 2.4 GB |
| Events in quadrant A | 20,009,638 | 14,581,142 |
| Events in quadrant B | 19,316,448 | 14,984,520 |
| Events in quadrant C | 19,689,402 | 13,958,767 |
| Events in quadrant D | 17,274,942 | 12,640,429 |
| Mode M9 | |||
|---|---|---|---|
| Quadrant | BADHDUFLAG | Total packets | Discarded packets |
| A | 0 | 518 | 0 |
| B | 0 | 518 | 0 |
| C | 0 | 518 | 0 |
| D | 0 | 518 | 0 |
| Mode SS | |||
|---|---|---|---|
| Quadrant | BADHDUFLAG | Total packets | Discarded packets |
| A | 0 | 6580 | 0 |
| B | 0 | 6578 | 0 |
| C | 0 | 6576 | 0 |
| D | 0 | 6580 | 0 |
| Mode M0 | |||
|---|---|---|---|
| Quadrant | BADHDUFLAG | Total packets | Discarded packets |
| A | 0 | 757263 | 0 |
| B | 0 | 681389 | 0 |
| C | 0 | 711809 | 0 |
| D | 0 | 843319 | 0 |
| Quadrant | Total seconds | Saturated seconds | Saturation percentage |
|---|---|---|---|
| A | 322905 | 9499 | 2.941732% |
| B | 323165 | 5154 | 1.594851% |
| C | 323114 | 8019 | 2.481787% |
| D | 323072 | 14725 | 4.557808% |
Noise dominated data is calculated using 1-second bins in cleaned event files. If a bin has >2000 counts, and if more than 50% of those come from <1% of pixels, then it is considered to be noise-dominated and hence unusable.
| Quadrant | # 1 sec bins | Bins with >0 counts | Bins with >2000 counts | High rate bins dominated by noise | Noise dominated (total time) | Noise dominated (detector-on time) | Marked lightcurve |
|---|---|---|---|---|---|---|---|
| A | 378517 | 322904 | 0 | 0 | 0.00% | 0.00% |  |
| B | 378516 | 323211 | 0 | 0 | 0.00% | 0.00% |  |
| C | 378516 | 323157 | 0 | 0 | 0.00% | 0.00% |  |
| D | 378516 | 322887 | 0 | 0 | 0.00% | 0.00% | 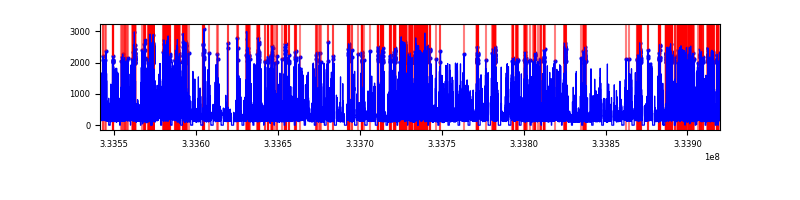 |
Top three noisy pixels from each quadrant. If the there are fewer than three noisy pixels in the level2.evt file, extra rows are filled as -1
| Pixel properties | Quadrant properties | ||||||
|---|---|---|---|---|---|---|---|
| Quadrant | DetID | PixID | Counts | Sigma | Mean | Median | Sigma |
| A | 0 | 29 | 16476 | 9.18 | 5212 | 4899 | 1260.9 |
| A | 7 | 110 | 15790 | 8.64 | 5212 | 4899 | 1260.9 |
| A | 9 | 19 | 15050 | 8.05 | 5212 | 4899 | 1260.9 |
| B | 2 | 9 | 15591 | 10.81 | 5105 | 4871 | 992.0 |
| B | 2 | 8 | 12979 | 8.17 | 5105 | 4871 | 992.0 |
| B | 5 | 128 | 12731 | 7.92 | 5105 | 4871 | 992.0 |
| C | 12 | 241 | 13728 | 6.78 | 5207 | 4892 | 1303.7 |
| C | 3 | 126 | 13507 | 6.61 | 5207 | 4892 | 1303.7 |
| C | 2 | 191 | 13021 | 6.24 | 5207 | 4892 | 1303.7 |
| D | 3 | 14 | 12181 | 5.99 | 4929 | 4503 | 1282.7 |
| D | 10 | 189 | 12103 | 5.92 | 4929 | 4503 | 1282.7 |
| D | 15 | 46 | 12100 | 5.92 | 4929 | 4503 | 1282.7 |
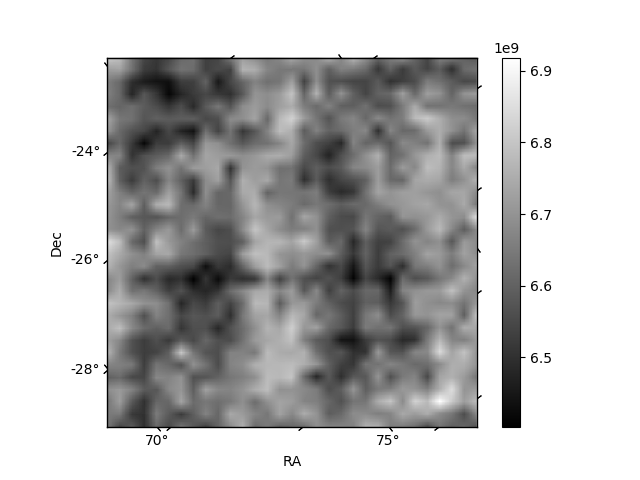
Histogram calculated using DETX and DETY for each event in the final _common_clean file
| Quadrant A | 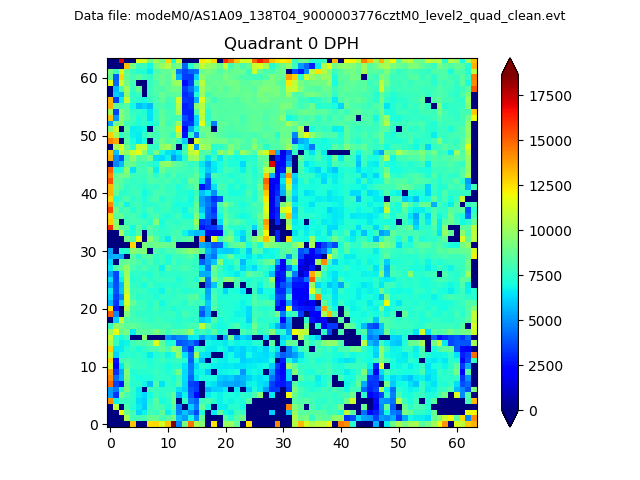 |
 |
Quadrant B |
|---|---|---|---|
| Quadrant D |  |
 |
Quadrant C |
| Plot type | Count rate plots | Images |
|---|---|---|
| Comparison with Poisson distribution Blue bars denote a histogram of data divided into 1 sec bins. Red curve is a Poisson curve with rate = median count rate of data. |
 |
 |
| Quadrant-wise count rates Data is divided into 100 sec bins |
 |
|
| Module-wise count rates for Quadrant A Data is divided into 100 sec bins |
 |
 |
| Module-wise count rates for Quadrant B Data is divided into 100 sec bins |
 |
 |
| Module-wise count rates for Quadrant C Data is divided into 100 sec bins |
 |
 |
| Module-wise count rates for Quadrant D Data is divided into 100 sec bins |
 |
 |
| Parameter | Plot |
|---|---|
| CZT HV Monitor |  |
| D_VDD |  |
| Temperature 1 |  |
| Veto HV Monitor |  |
| Veto LLD |  |
| Alpha Counter |  |
| _CPM_Rate |  |
| CZT Counter | 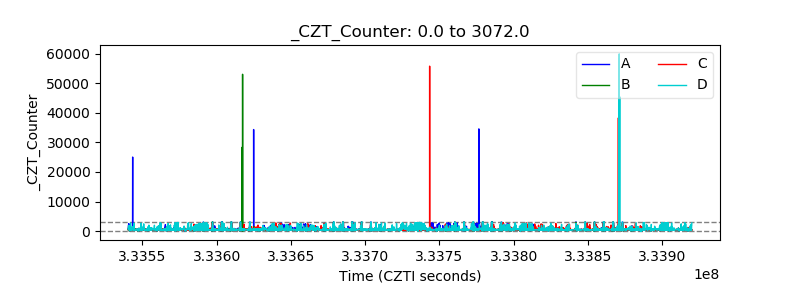 |
| +2.5 Volts monitor |  |
| +5 Volts monitor |  |
| _ROLL_ROT |  |
| _Roll_DEC |  |
| _Roll_RA |  |
| Veto Counter |  |