| Param | Original file | Final file |
|---|---|---|
| Filename | modeM0/AS1A09_138T04_9000003776_26114cztM0_level2.evt | modeM0/AS1A09_138T04_9000003776_26114cztM0_level2_quad_clean.evt |
| Size (bytes) | 124,994,880 | 37,330,560 |
| Size | 119.2 MB | 35.6 MB |
| Events in quadrant A | 871,960 | 256,070 |
| Events in quadrant B | 868,167 | 262,633 |
| Events in quadrant C | 907,416 | 243,592 |
| Events in quadrant D | 1,020,363 | 243,646 |
| Mode M9 | |||
|---|---|---|---|
| Quadrant | BADHDUFLAG | Total packets | Discarded packets |
| A | 0 | 10 | 0 |
| B | 0 | 10 | 0 |
| C | 0 | 10 | 0 |
| D | 0 | 10 | 0 |
| Mode M0 | |||
|---|---|---|---|
| Quadrant | BADHDUFLAG | Total packets | Discarded packets |
| A | 0 | 3535 | 0 |
| B | 0 | 3521 | 0 |
| C | 0 | 3664 | 0 |
| D | 0 | 4116 | 0 |
| Quadrant | Total seconds | Saturated seconds | Saturation percentage |
|---|---|---|---|
| A | 1697 | 10 | 0.589275% |
| B | 1697 | 17 | 1.001768% |
| C | 1697 | 28 | 1.649971% |
| D | 1696 | 17 | 1.002358% |
Noise dominated data is calculated using 1-second bins in cleaned event files. If a bin has >2000 counts, and if more than 50% of those come from <1% of pixels, then it is considered to be noise-dominated and hence unusable.
| Quadrant | # 1 sec bins | Bins with >0 counts | Bins with >2000 counts | High rate bins dominated by noise | Noise dominated (total time) | Noise dominated (detector-on time) | Marked lightcurve |
|---|---|---|---|---|---|---|---|
| A | 1697 | 1697 | 0 | 0 | 0.00% | 0.00% | 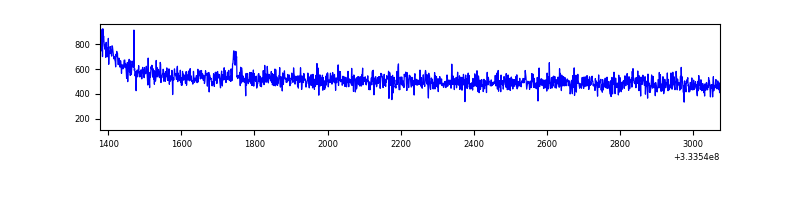 |
| B | 1697 | 1697 | 0 | 0 | 0.00% | 0.00% | 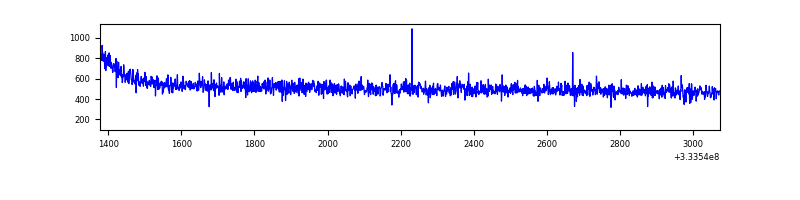 |
| C | 1697 | 1697 | 0 | 0 | 0.00% | 0.00% | 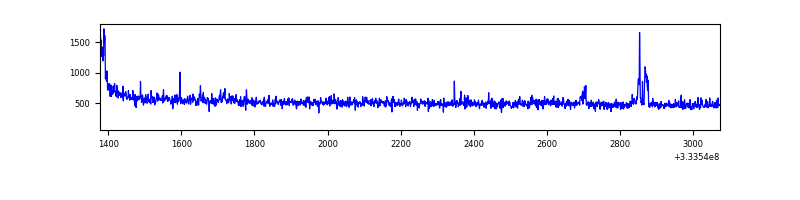 |
| D | 1696 | 1696 | 8 | 8 | 0.47% | 0.47% | 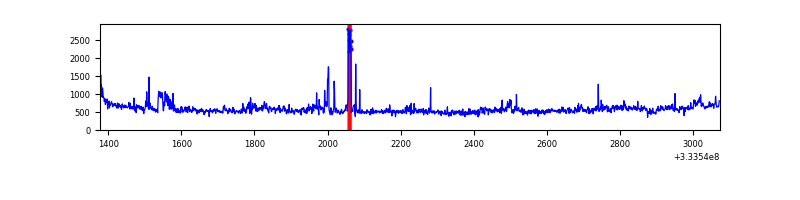 |
Top three noisy pixels from each quadrant. If the there are fewer than three noisy pixels in the level2.evt file, extra rows are filled as -1
| Pixel properties | Quadrant properties | ||||||
|---|---|---|---|---|---|---|---|
| Quadrant | DetID | PixID | Counts | Sigma | Mean | Median | Sigma |
| A | 13 | 254 | 2093 | 40.55 | 225 | 221 | 46.2 |
| A | 0 | 13 | 2086 | 40.4 | 225 | 221 | 46.2 |
| A | 0 | 226 | 1967 | 37.82 | 225 | 221 | 46.2 |
| B | 12 | 111 | 4972 | 109.07 | 222 | 217 | 43.6 |
| B | 11 | 111 | 4476 | 97.69 | 222 | 217 | 43.6 |
| B | 14 | 111 | 4115 | 89.41 | 222 | 217 | 43.6 |
| C | 14 | 238 | 34413 | 671.38 | 213 | 215 | 50.9 |
| C | 3 | 233 | 33443 | 652.34 | 213 | 215 | 50.9 |
| C | 2 | 16 | 7037 | 133.93 | 213 | 215 | 50.9 |
| D | 1 | 52 | 144132 | 2697.74 | 219 | 213 | 53.3 |
| D | 1 | 3 | 40964 | 763.87 | 219 | 213 | 53.3 |
| D | 2 | 234 | 5212 | 93.71 | 219 | 213 | 53.3 |
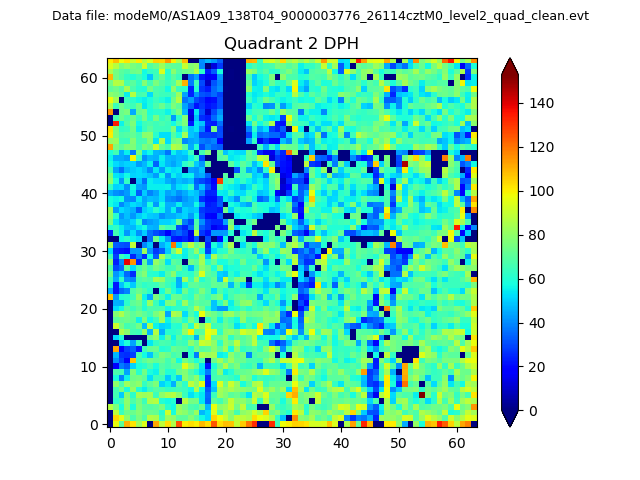
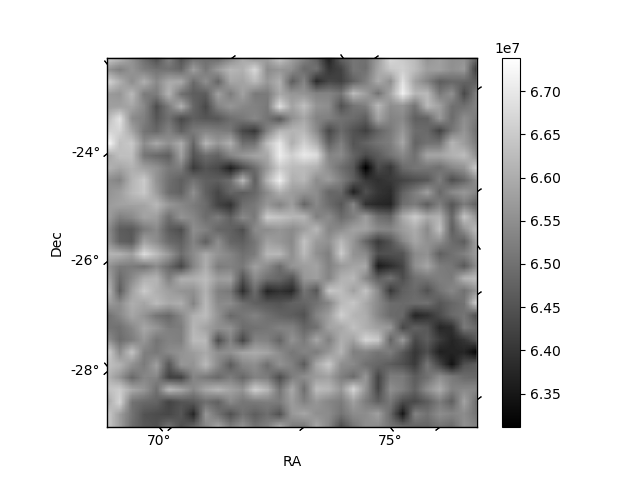
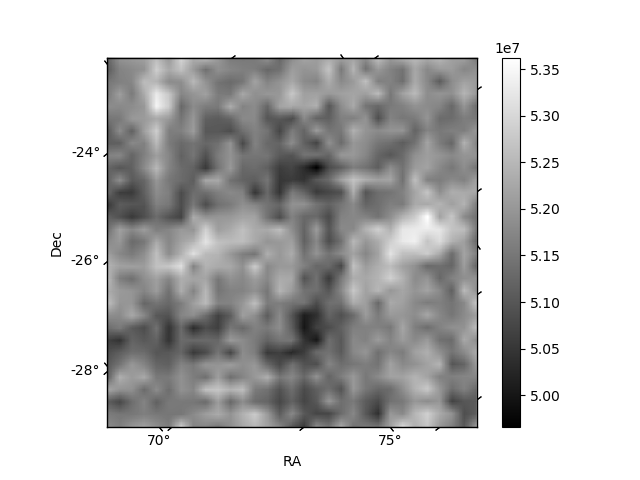
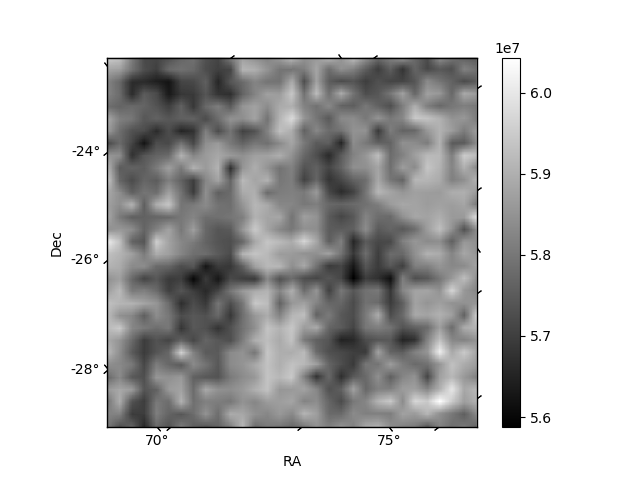
Histogram calculated using DETX and DETY for each event in the final _common_clean file
| Quadrant A | 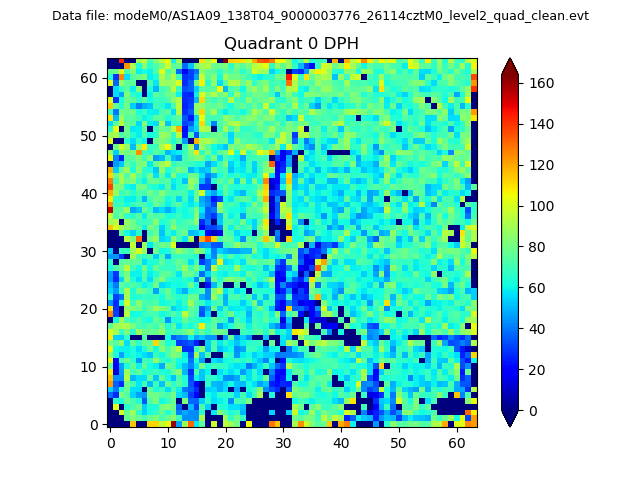 |
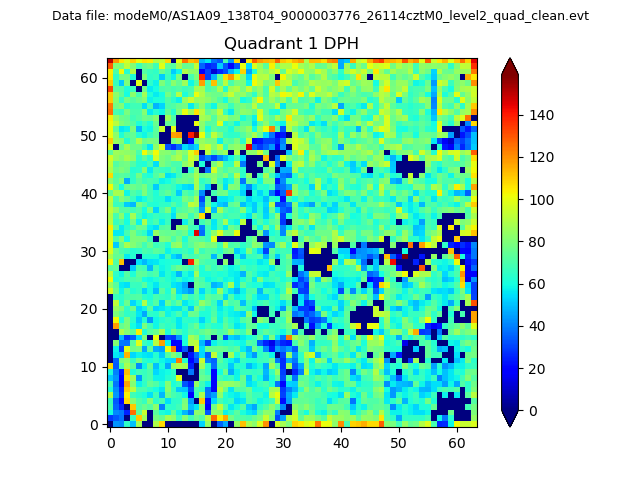 |
Quadrant B |
|---|---|---|---|
| Quadrant D | 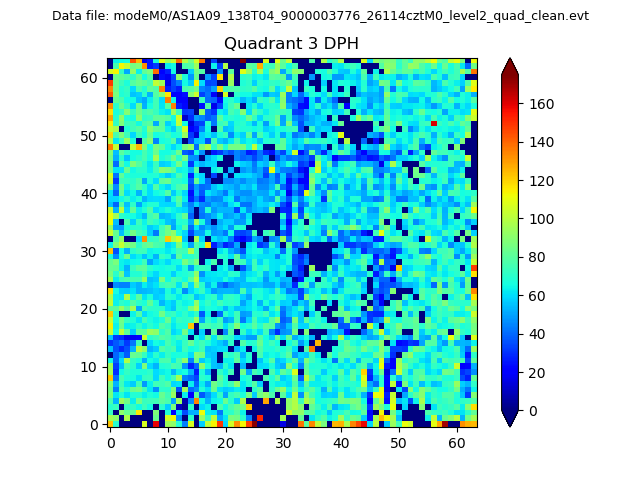 |
 |
Quadrant C |
| Plot type | Count rate plots | Images |
|---|---|---|
| Comparison with Poisson distribution Blue bars denote a histogram of data divided into 1 sec bins. Red curve is a Poisson curve with rate = median count rate of data. |
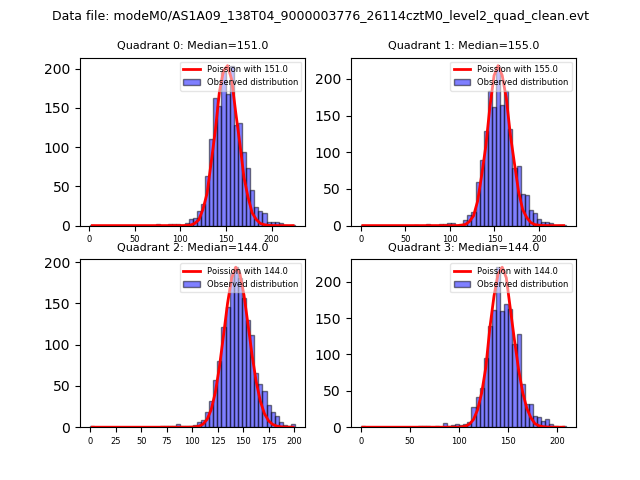 |
 |
| Quadrant-wise count rates Data is divided into 100 sec bins |
 |
|
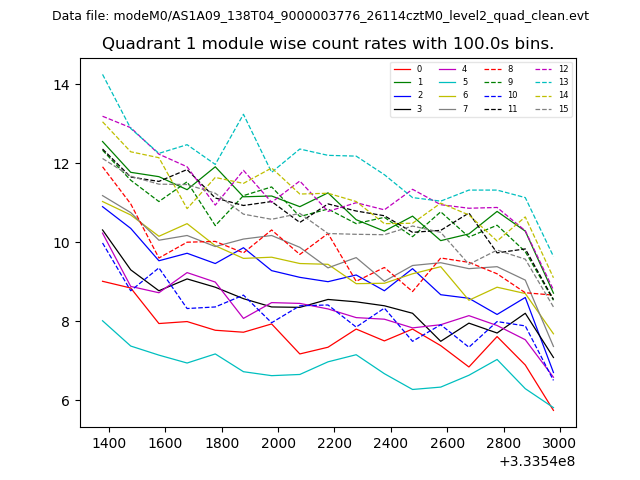
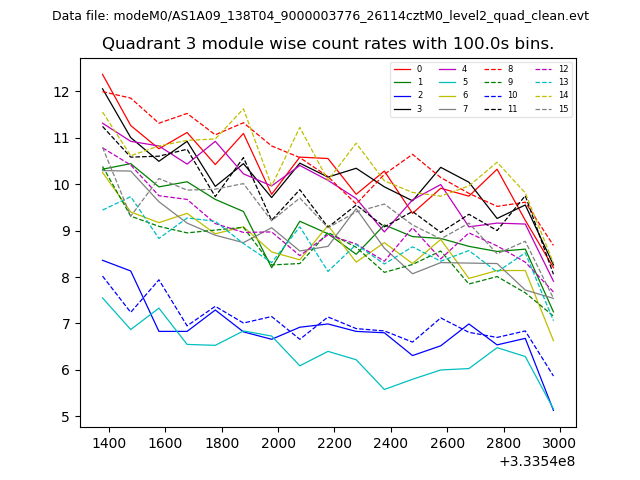
| Module-wise count rates for Quadrant A Data is divided into 100 sec bins |
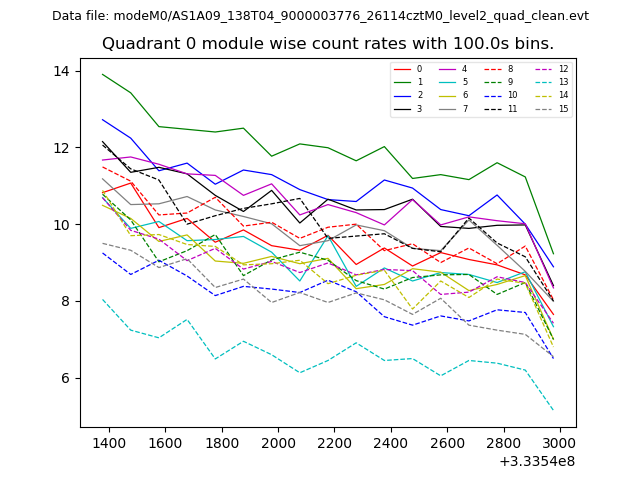 |
 |
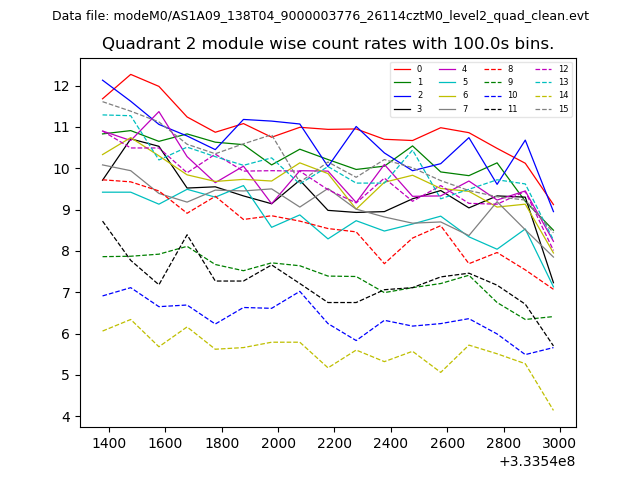
| Module-wise count rates for Quadrant B Data is divided into 100 sec bins |
 |
 |
| Module-wise count rates for Quadrant C Data is divided into 100 sec bins |
 |
 |
| Module-wise count rates for Quadrant D Data is divided into 100 sec bins |
 |
 |
| Parameter | Plot |
|---|---|
| CZT HV Monitor | 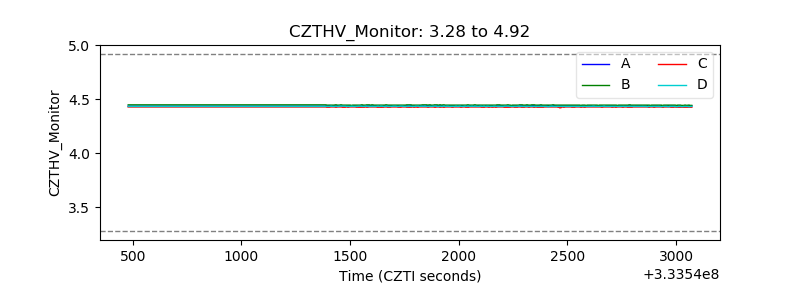 |
| D_VDD | 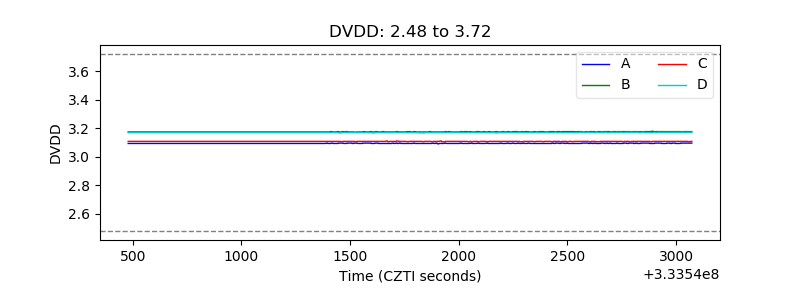 |
| Temperature 1 |  |
| Veto HV Monitor | 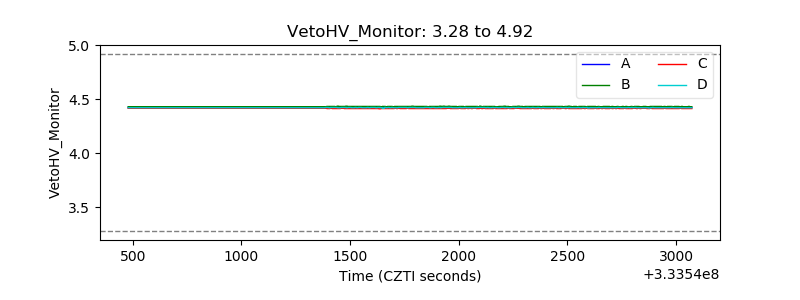 |
| Veto LLD | 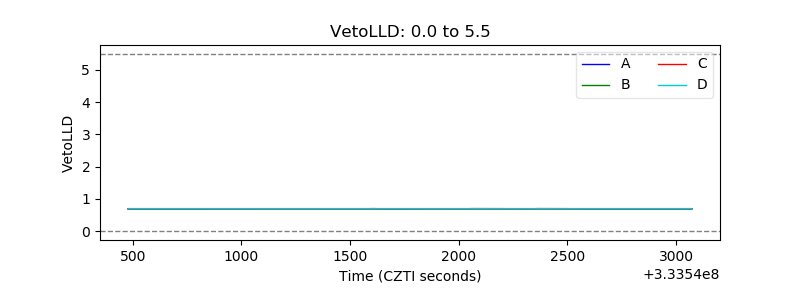 |
| Alpha Counter | 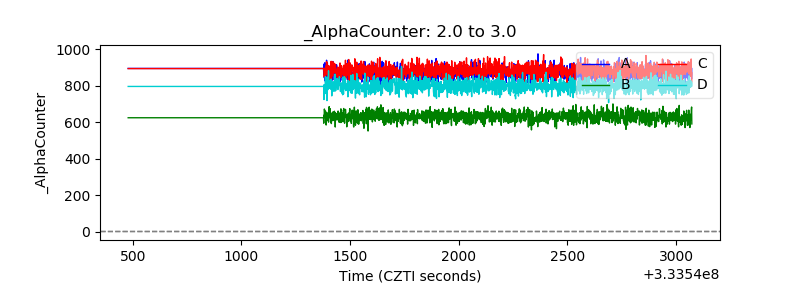 |
| _CPM_Rate | 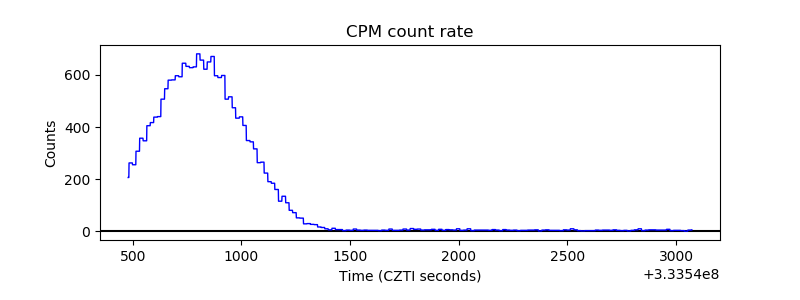 |
| CZT Counter | 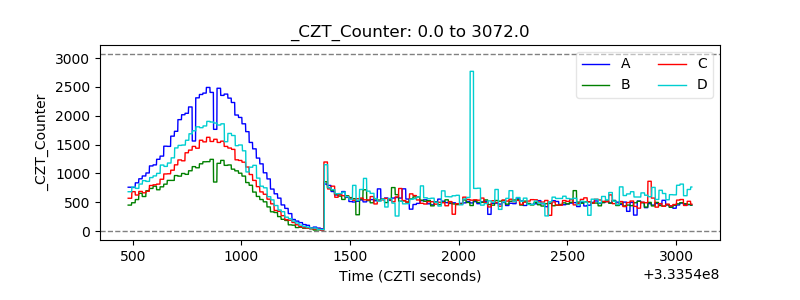 |
| +2.5 Volts monitor |  |
| +5 Volts monitor |  |
| _ROLL_ROT | 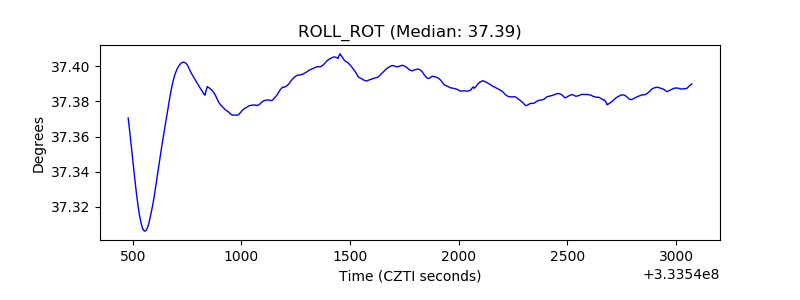 |
| _Roll_DEC | 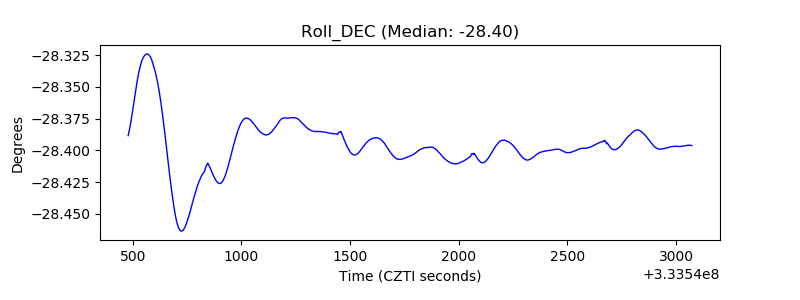 |
| _Roll_RA | 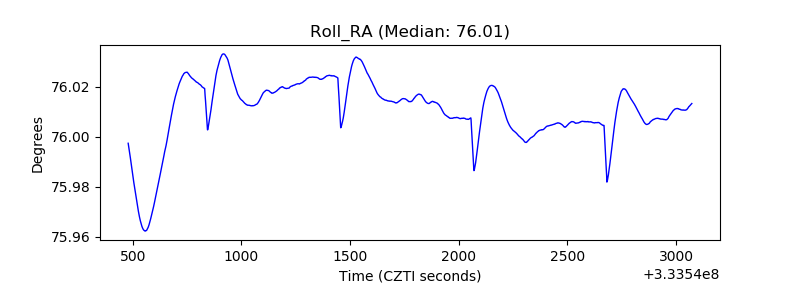 |
| Veto Counter | 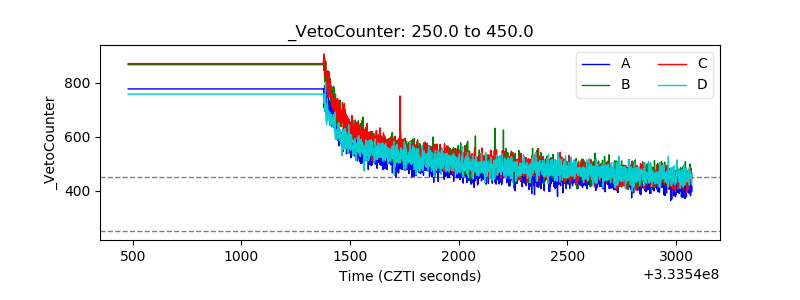 |