| Param | Original file | Final file |
|---|---|---|
| Filename | modeM0/AS1A09_138T04_9000003776_26116cztM0_level2.evt | modeM0/AS1A09_138T04_9000003776_26116cztM0_level2_quad_clean.evt |
| Size (bytes) | 522,815,040 | 95,371,200 |
| Size | 498.6 MB | 91.0 MB |
| Events in quadrant A | 3,520,855 | 604,547 |
| Events in quadrant B | 3,568,445 | 619,608 |
| Events in quadrant C | 3,569,637 | 581,939 |
| Events in quadrant D | 4,683,642 | 578,611 |
| Mode M9 | |||
|---|---|---|---|
| Quadrant | BADHDUFLAG | Total packets | Discarded packets |
| A | 0 | 4 | 0 |
| B | 0 | 4 | 0 |
| C | 0 | 4 | 0 |
| D | 0 | 4 | 0 |
| Mode M0 | |||
|---|---|---|---|
| Quadrant | BADHDUFLAG | Total packets | Discarded packets |
| A | 0 | 14858 | 0 |
| B | 0 | 14852 | 0 |
| C | 0 | 14946 | 0 |
| D | 0 | 18422 | 0 |
| Quadrant | Total seconds | Saturated seconds | Saturation percentage |
|---|---|---|---|
| A | 7222 | 139 | 1.924675% |
| B | 7223 | 159 | 2.201301% |
| C | 7223 | 178 | 2.464350% |
| D | 7223 | 308 | 4.264156% |
Noise dominated data is calculated using 1-second bins in cleaned event files. If a bin has >2000 counts, and if more than 50% of those come from <1% of pixels, then it is considered to be noise-dominated and hence unusable.
| Quadrant | # 1 sec bins | Bins with >0 counts | Bins with >2000 counts | High rate bins dominated by noise | Noise dominated (total time) | Noise dominated (detector-on time) | Marked lightcurve |
|---|---|---|---|---|---|---|---|
| A | 7652 | 7222 | 0 | 0 | 0.00% | 0.00% | 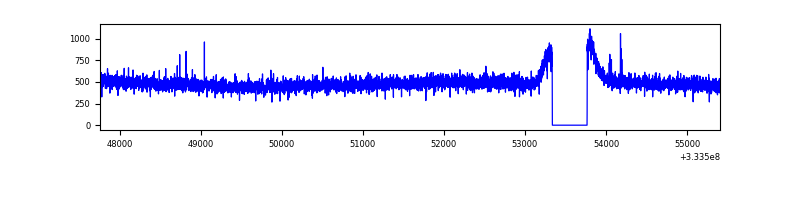 |
| B | 7653 | 7223 | 0 | 0 | 0.00% | 0.00% | 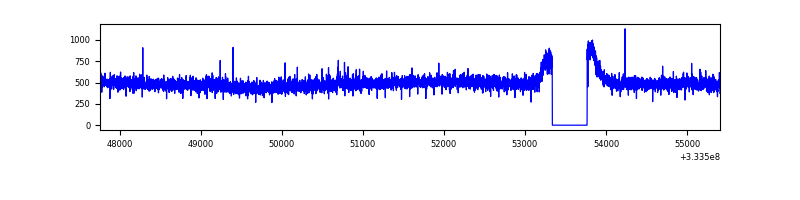 |
| C | 7653 | 7223 | 1 | 1 | 0.01% | 0.01% | 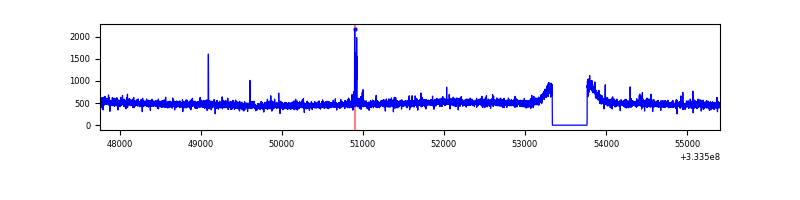 |
| D | 7653 | 7223 | 217 | 217 | 2.84% | 3.00% | 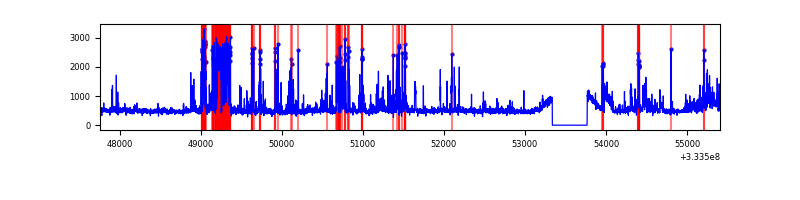 |
Top three noisy pixels from each quadrant. If the there are fewer than three noisy pixels in the level2.evt file, extra rows are filled as -1
| Pixel properties | Quadrant properties | ||||||
|---|---|---|---|---|---|---|---|
| Quadrant | DetID | PixID | Counts | Sigma | Mean | Median | Sigma |
| A | 13 | 254 | 10306 | 51.69 | 910 | 892 | 182.1 |
| A | 3 | 137 | 8449 | 41.49 | 910 | 892 | 182.1 |
| A | 0 | 13 | 8060 | 39.36 | 910 | 892 | 182.1 |
| B | 12 | 111 | 20966 | 114.67 | 901 | 878 | 175.2 |
| B | 0 | 229 | 19404 | 105.75 | 901 | 878 | 175.2 |
| B | 11 | 111 | 19087 | 103.94 | 901 | 878 | 175.2 |
| C | 14 | 238 | 139865 | 683.04 | 867 | 873 | 203.5 |
| C | 3 | 233 | 26442 | 125.65 | 867 | 873 | 203.5 |
| C | 2 | 16 | 23540 | 111.39 | 867 | 873 | 203.5 |
| D | 12 | 233 | 783941 | 3756.54 | 876 | 855 | 208.5 |
| D | 1 | 52 | 409844 | 1961.96 | 876 | 855 | 208.5 |
| D | 7 | 80 | 88032 | 418.2 | 876 | 855 | 208.5 |
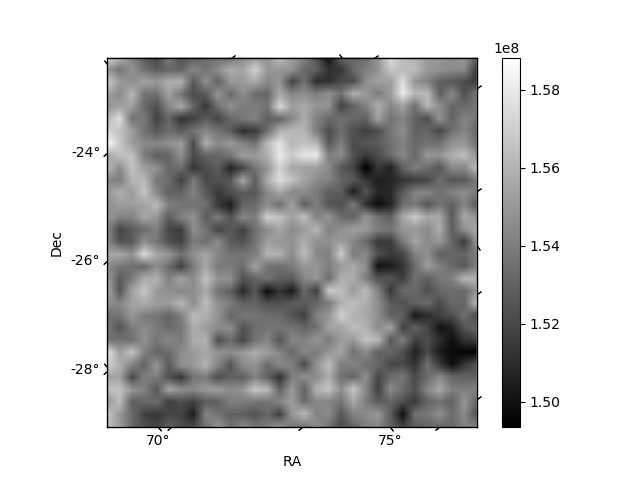
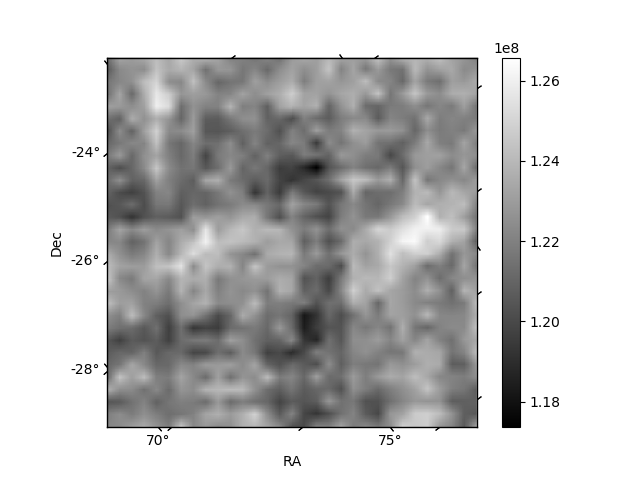
Histogram calculated using DETX and DETY for each event in the final _common_clean file
| Quadrant A | 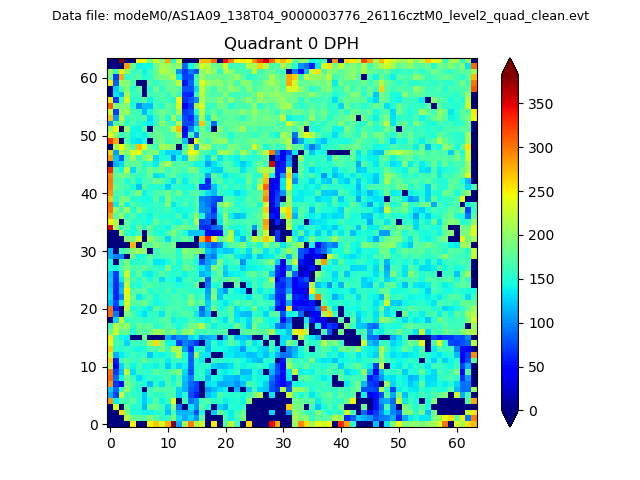 |
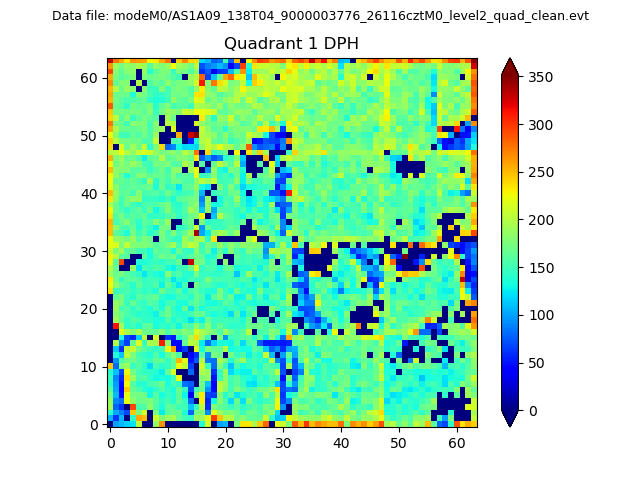 |
Quadrant B |
|---|---|---|---|
| Quadrant D |  |
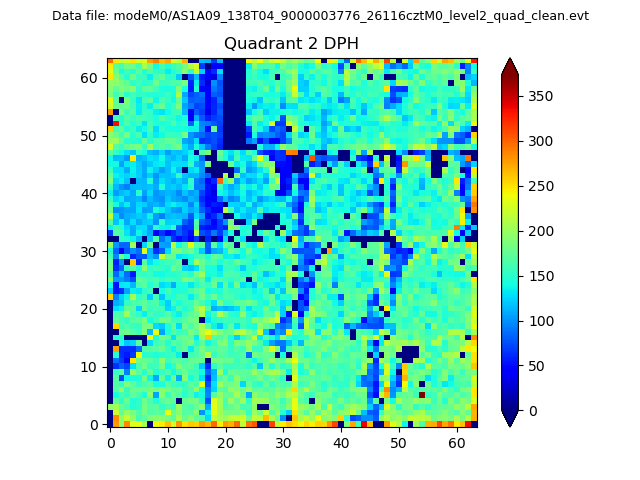 |
Quadrant C |
| Plot type | Count rate plots | Images |
|---|---|---|
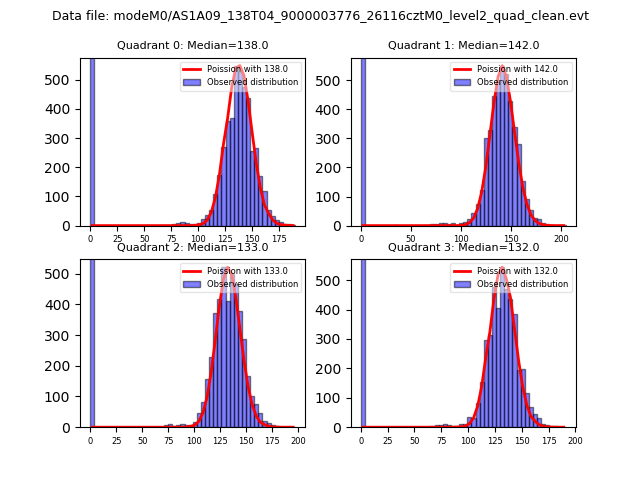
| Comparison with Poisson distribution Blue bars denote a histogram of data divided into 1 sec bins. Red curve is a Poisson curve with rate = median count rate of data. |
 |
 |
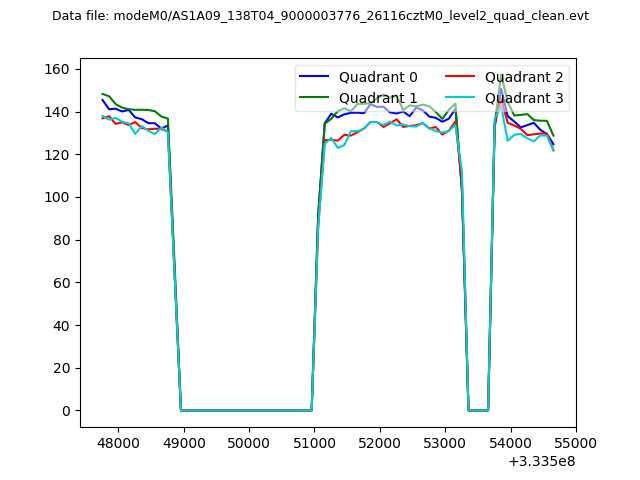
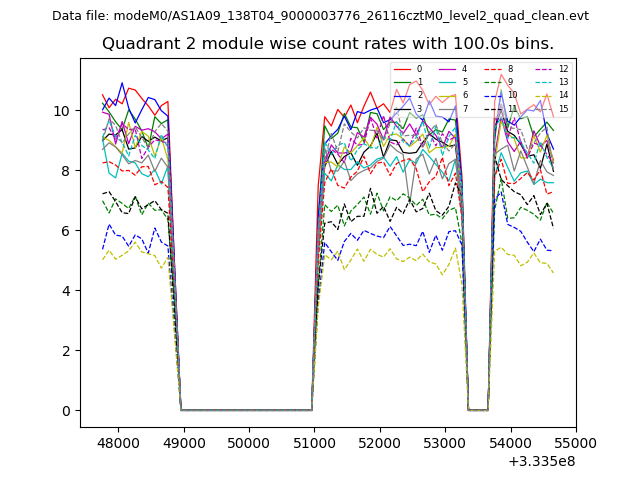
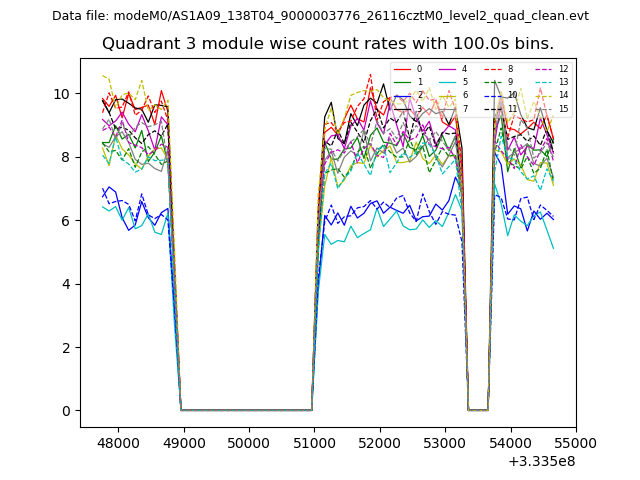
| Quadrant-wise count rates Data is divided into 100 sec bins |
 |
|
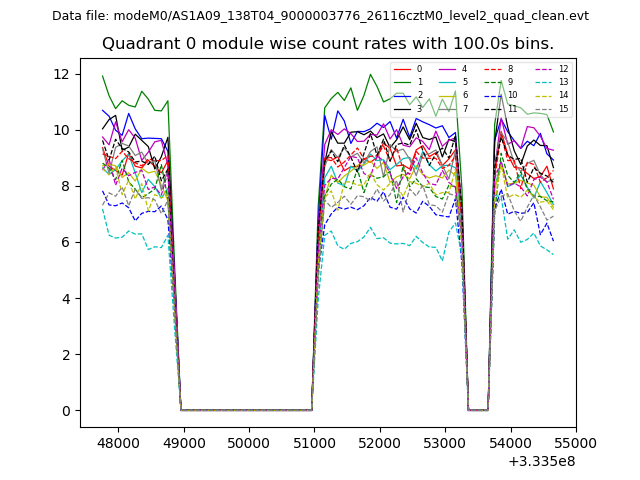
| Module-wise count rates for Quadrant A Data is divided into 100 sec bins |
 |
 |
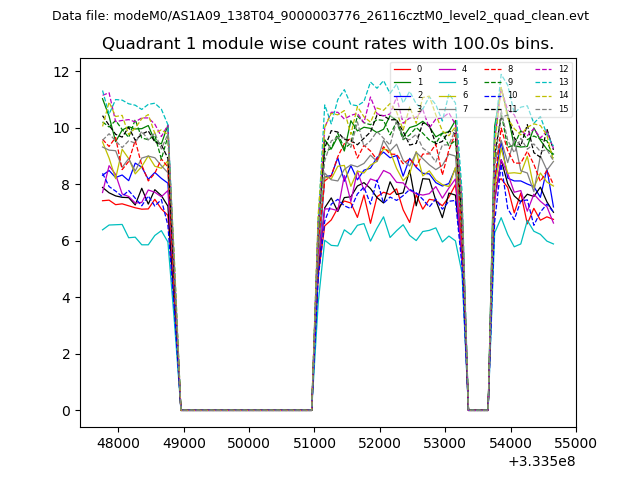
| Module-wise count rates for Quadrant B Data is divided into 100 sec bins |
 |
 |
| Module-wise count rates for Quadrant C Data is divided into 100 sec bins |
 |
 |
| Module-wise count rates for Quadrant D Data is divided into 100 sec bins |
 |
 |
| Parameter | Plot |
|---|---|
| CZT HV Monitor | 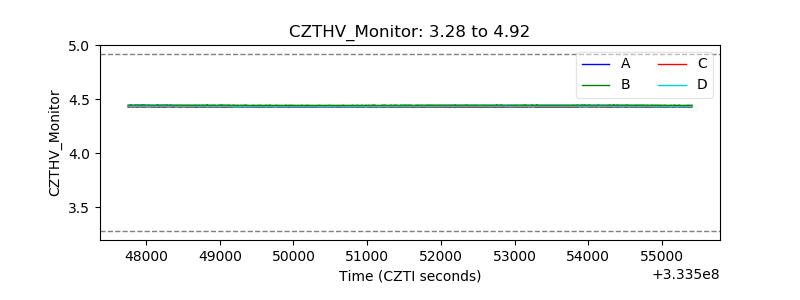 |
| D_VDD | 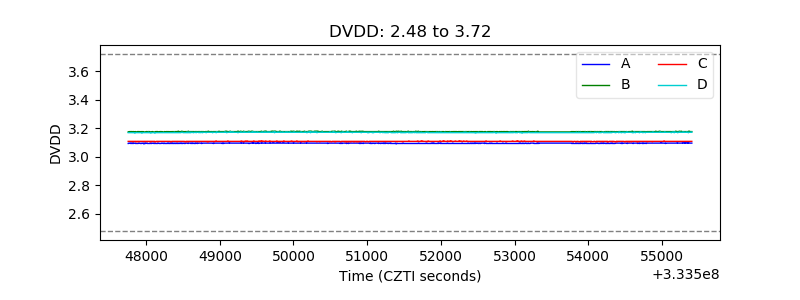 |
| Temperature 1 | 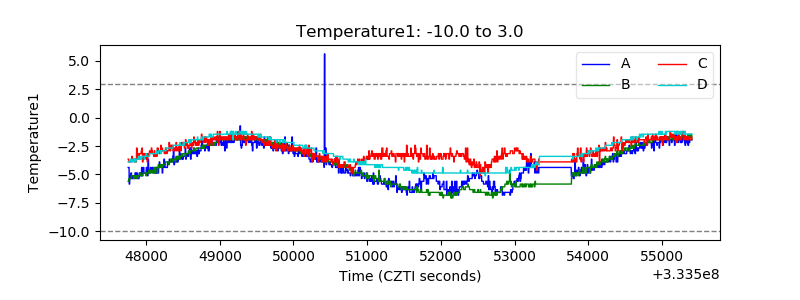 |
| Veto HV Monitor | 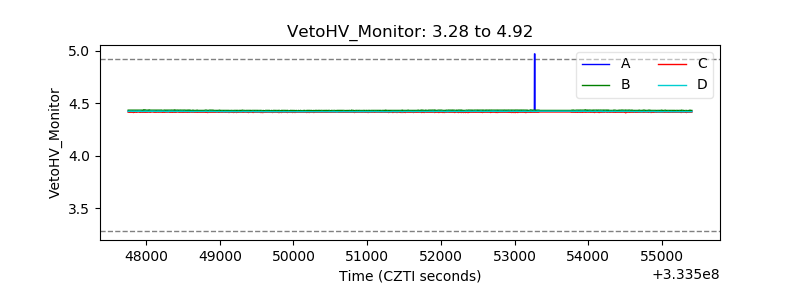 |
| Veto LLD | 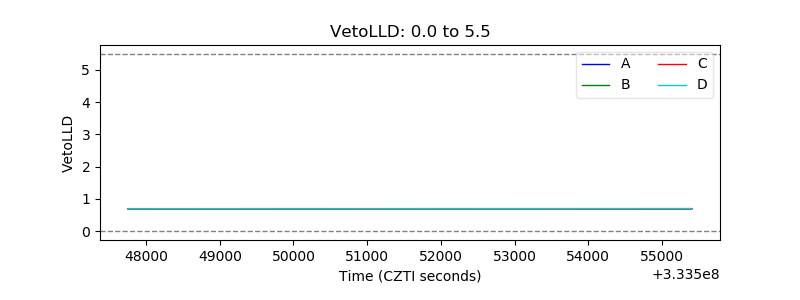 |
| Alpha Counter |  |
| _CPM_Rate | 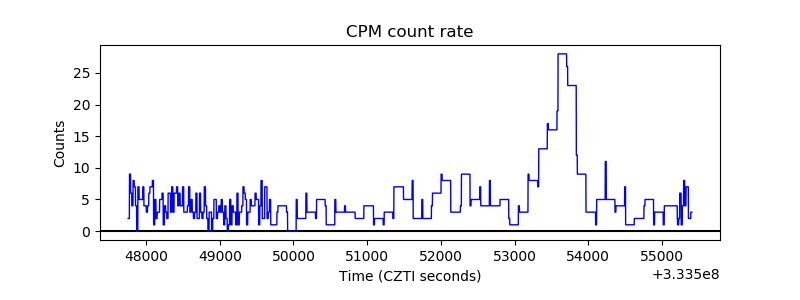 |
| CZT Counter |  |
| +2.5 Volts monitor |  |
| +5 Volts monitor |  |
| _ROLL_ROT | 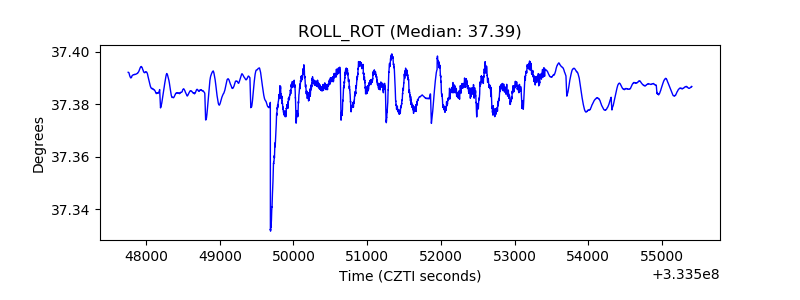 |
| _Roll_DEC | 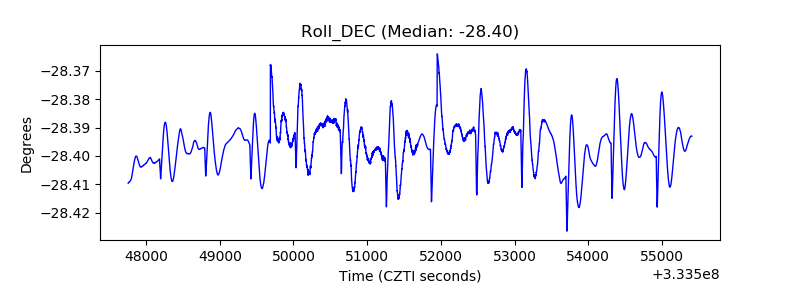 |
| _Roll_RA |  |
| Veto Counter | 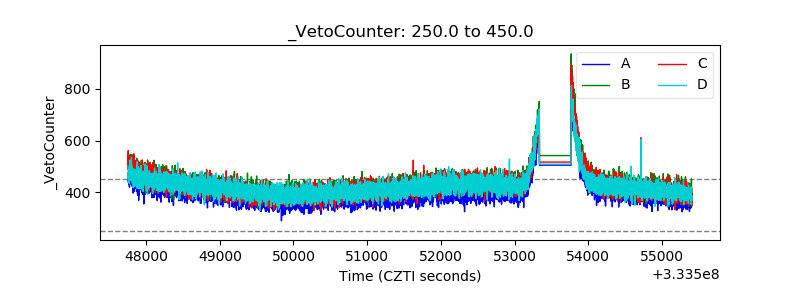 |