| Param | Original file | Final file |
|---|---|---|
| Filename | modeM0/AS1A09_138T04_9000003776_26117cztM0_level2.evt | modeM0/AS1A09_138T04_9000003776_26117cztM0_level2_quad_clean.evt |
| Size (bytes) | 534,856,320 | 84,723,840 |
| Size | 510.1 MB | 80.8 MB |
| Events in quadrant A | 3,540,242 | 523,021 |
| Events in quadrant B | 3,586,564 | 534,251 |
| Events in quadrant C | 3,579,183 | 507,415 |
| Events in quadrant D | 5,006,501 | 502,352 |
| Mode M9 | |||
|---|---|---|---|
| Quadrant | BADHDUFLAG | Total packets | Discarded packets |
| A | 0 | 1 | 0 |
| B | 0 | 1 | 0 |
| C | 0 | 1 | 0 |
| D | 0 | 1 | 0 |
| Mode M0 | |||
|---|---|---|---|
| Quadrant | BADHDUFLAG | Total packets | Discarded packets |
| A | 0 | 15005 | 0 |
| B | 0 | 15007 | 0 |
| C | 0 | 15112 | 0 |
| D | 0 | 19693 | 0 |
| Quadrant | Total seconds | Saturated seconds | Saturation percentage |
|---|---|---|---|
| A | 7158 | 238 | 3.324951% |
| B | 7159 | 292 | 4.078782% |
| C | 7159 | 266 | 3.715603% |
| D | 7159 | 275 | 3.841319% |
Noise dominated data is calculated using 1-second bins in cleaned event files. If a bin has >2000 counts, and if more than 50% of those come from <1% of pixels, then it is considered to be noise-dominated and hence unusable.
| Quadrant | # 1 sec bins | Bins with >0 counts | Bins with >2000 counts | High rate bins dominated by noise | Noise dominated (total time) | Noise dominated (detector-on time) | Marked lightcurve |
|---|---|---|---|---|---|---|---|
| A | 7228 | 7158 | 0 | 0 | 0.00% | 0.00% | 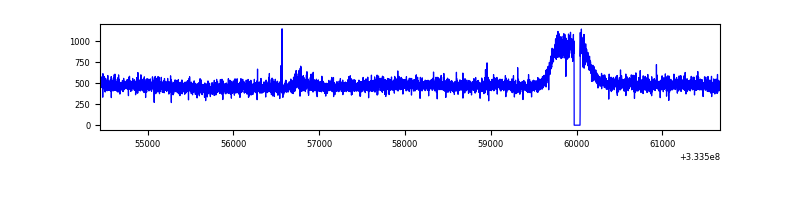 |
| B | 7229 | 7159 | 0 | 0 | 0.00% | 0.00% | 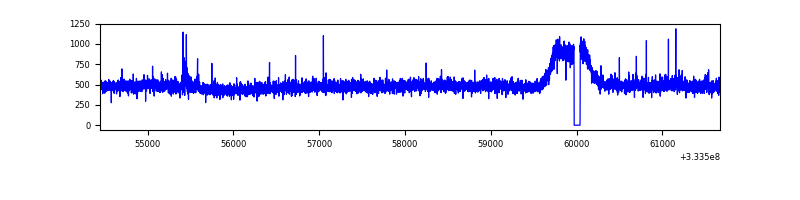 |
| C | 7229 | 7159 | 0 | 0 | 0.00% | 0.00% | 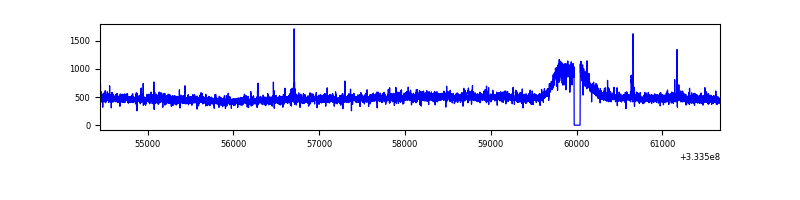 |
| D | 7229 | 7159 | 47 | 47 | 0.65% | 0.66% | 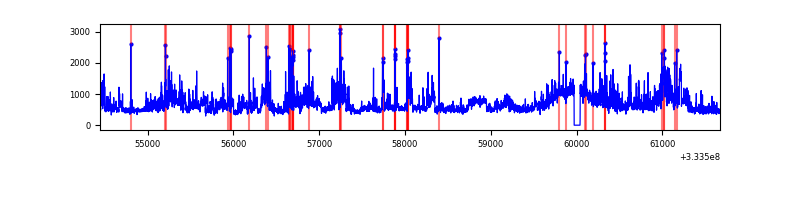 |
Top three noisy pixels from each quadrant. If the there are fewer than three noisy pixels in the level2.evt file, extra rows are filled as -1
| Pixel properties | Quadrant properties | ||||||
|---|---|---|---|---|---|---|---|
| Quadrant | DetID | PixID | Counts | Sigma | Mean | Median | Sigma |
| A | 0 | 13 | 37676 | 199.87 | 909 | 888 | 184.1 |
| A | 13 | 254 | 9051 | 44.35 | 909 | 888 | 184.1 |
| A | 3 | 137 | 8755 | 42.74 | 909 | 888 | 184.1 |
| B | 12 | 111 | 21793 | 118.1 | 900 | 877 | 177.1 |
| B | 11 | 111 | 19514 | 105.23 | 900 | 877 | 177.1 |
| B | 14 | 111 | 17640 | 94.65 | 900 | 877 | 177.1 |
| C | 14 | 238 | 136856 | 659.73 | 868 | 874 | 206.1 |
| C | 2 | 16 | 29798 | 140.33 | 868 | 874 | 206.1 |
| C | 3 | 233 | 26413 | 123.9 | 868 | 874 | 206.1 |
| D | 7 | 80 | 1104727 | 5209.34 | 884 | 864 | 211.9 |
| D | 1 | 52 | 368836 | 1736.53 | 884 | 864 | 211.9 |
| D | 13 | 168 | 109203 | 511.27 | 884 | 864 | 211.9 |
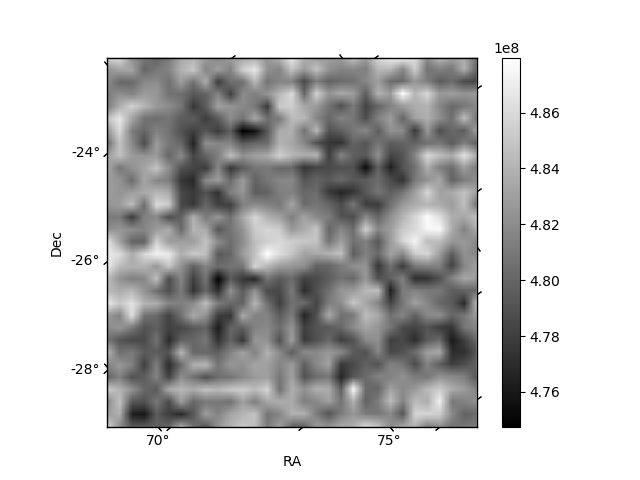
Histogram calculated using DETX and DETY for each event in the final _common_clean file
| Quadrant A | 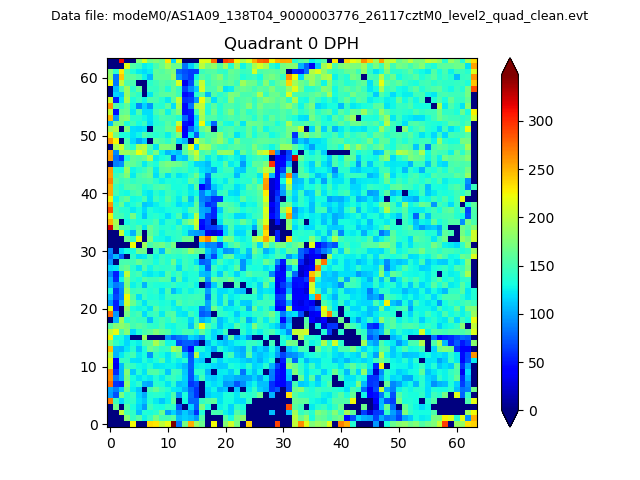 |
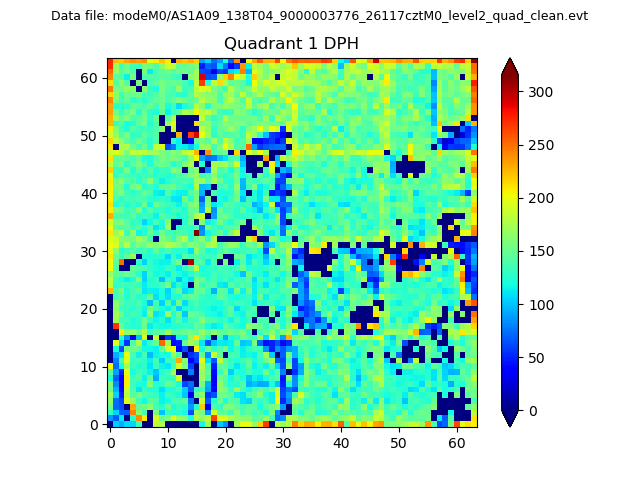 |
Quadrant B |
|---|---|---|---|
| Quadrant D | 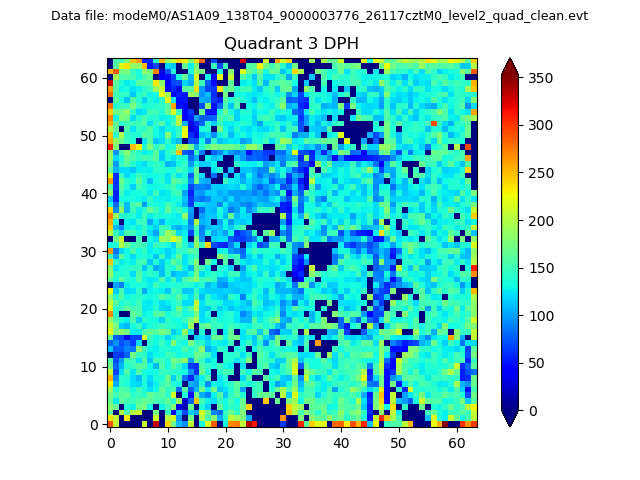 |
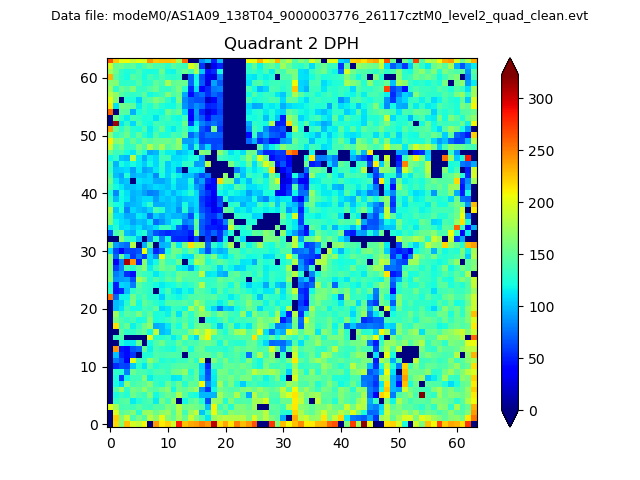 |
Quadrant C |
| Plot type | Count rate plots | Images |
|---|---|---|
| Comparison with Poisson distribution Blue bars denote a histogram of data divided into 1 sec bins. Red curve is a Poisson curve with rate = median count rate of data. |
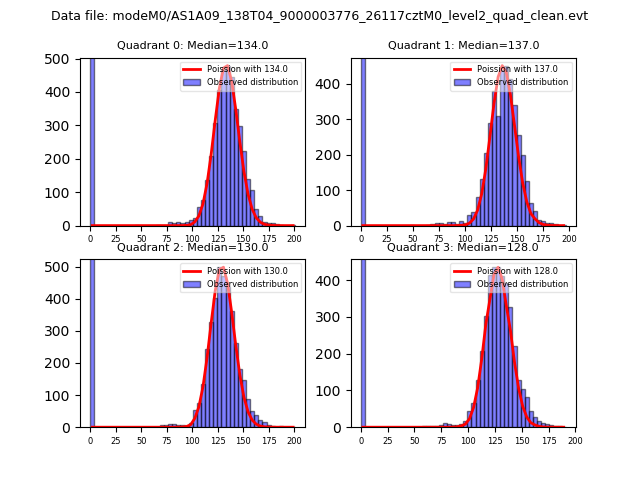 |
 |
| Quadrant-wise count rates Data is divided into 100 sec bins |
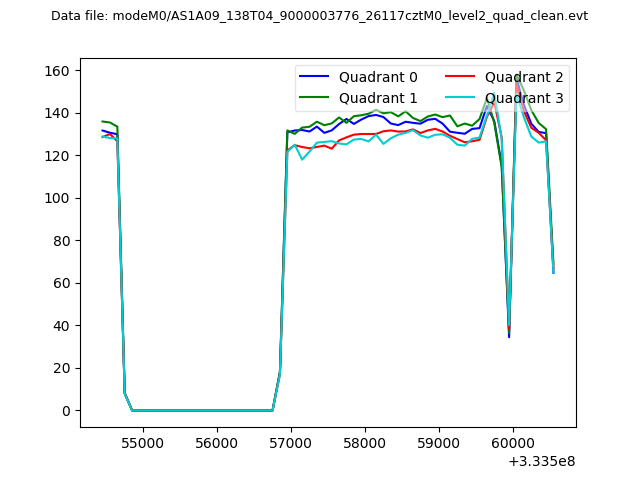 |
|
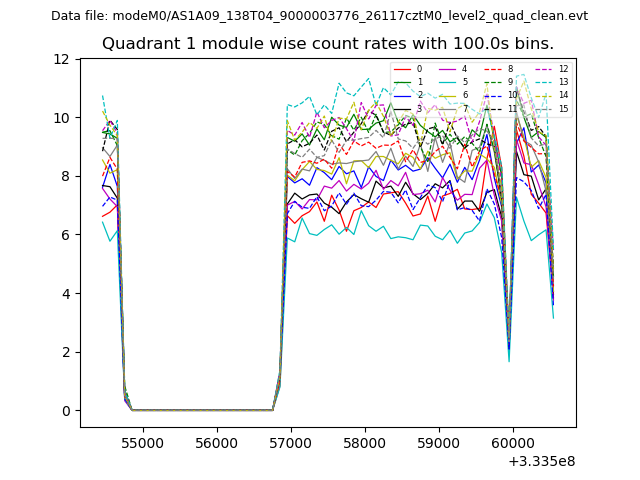
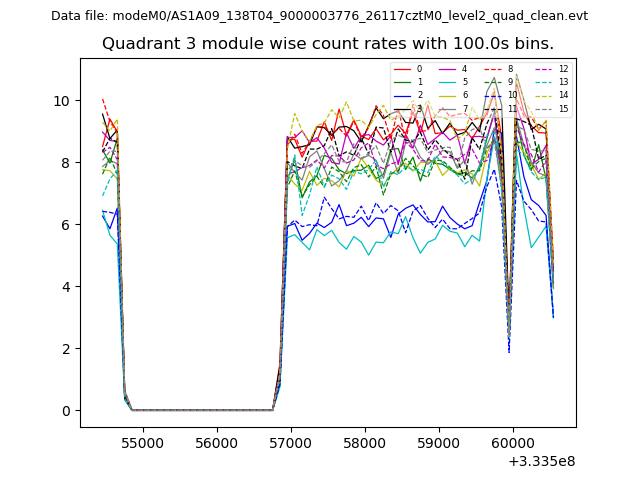
| Module-wise count rates for Quadrant A Data is divided into 100 sec bins |
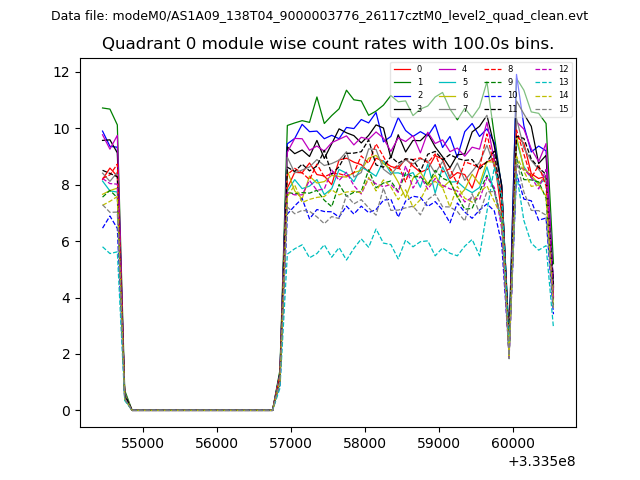 |
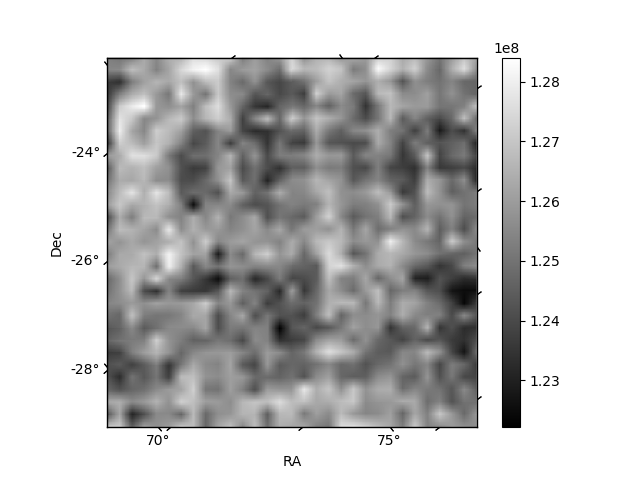 |
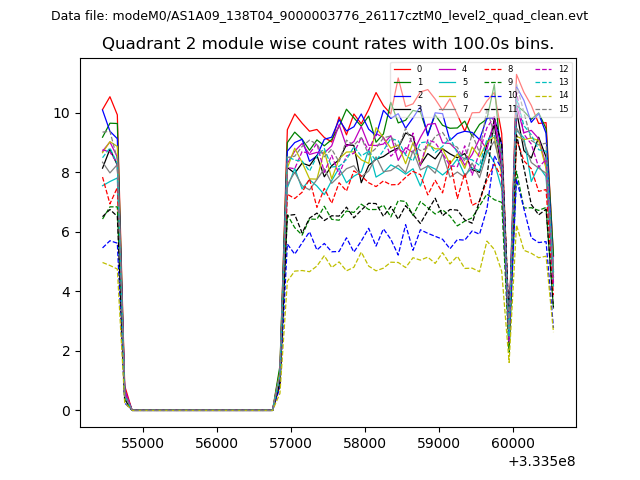
| Module-wise count rates for Quadrant B Data is divided into 100 sec bins |
 |
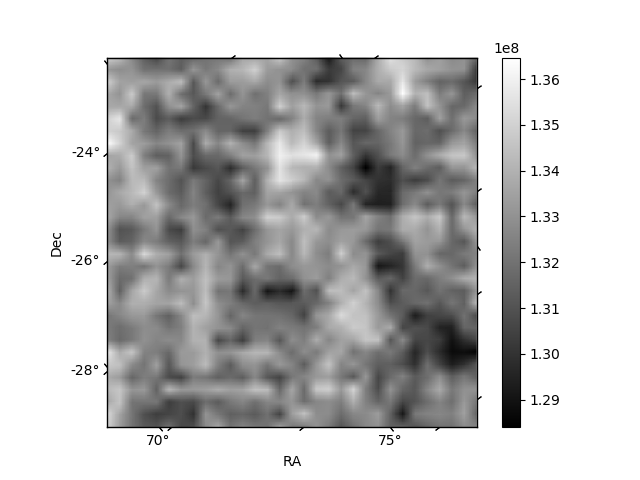 |
| Module-wise count rates for Quadrant C Data is divided into 100 sec bins |
 |
 |
| Module-wise count rates for Quadrant D Data is divided into 100 sec bins |
 |
 |
| Parameter | Plot |
|---|---|
| CZT HV Monitor | 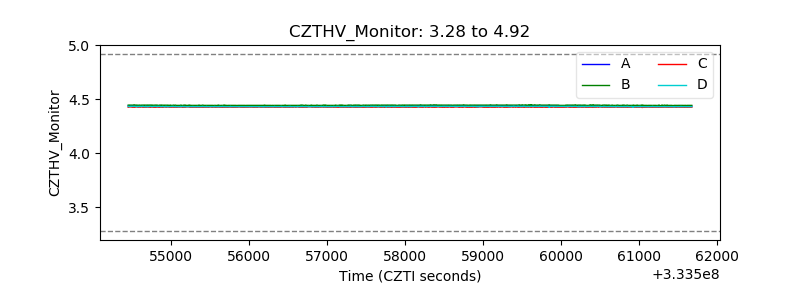 |
| D_VDD | 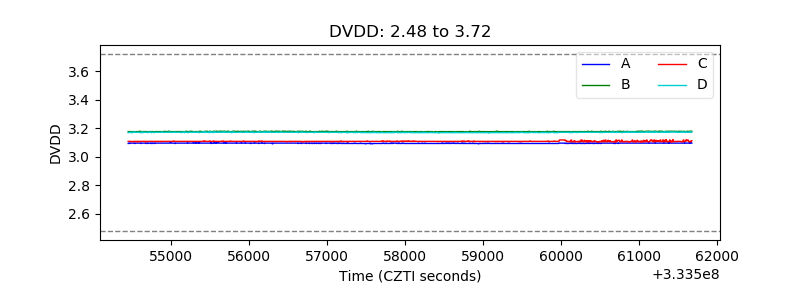 |
| Temperature 1 | 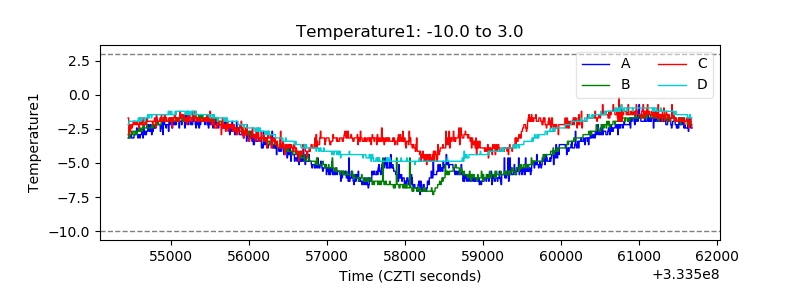 |
| Veto HV Monitor | 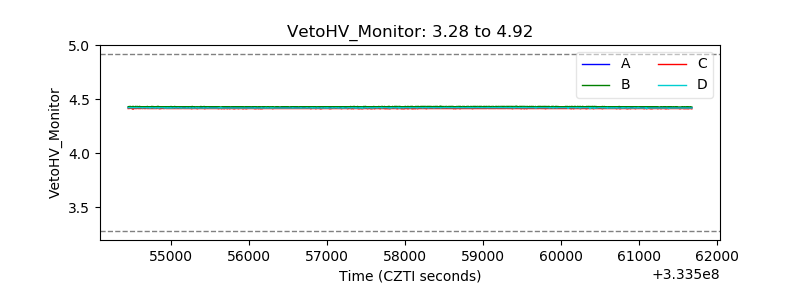 |
| Veto LLD | 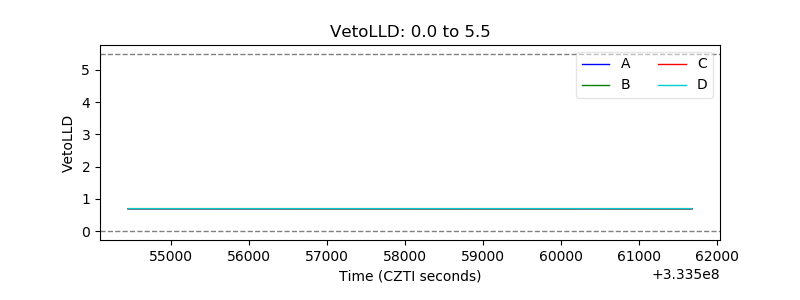 |
| Alpha Counter | 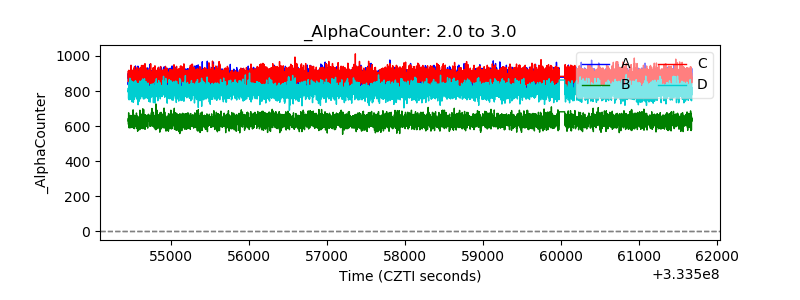 |
| _CPM_Rate | 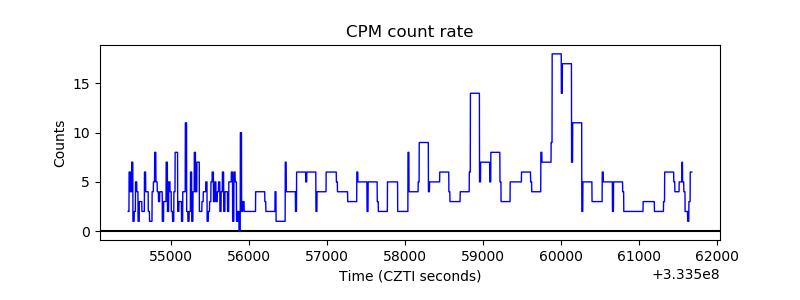 |
| CZT Counter | 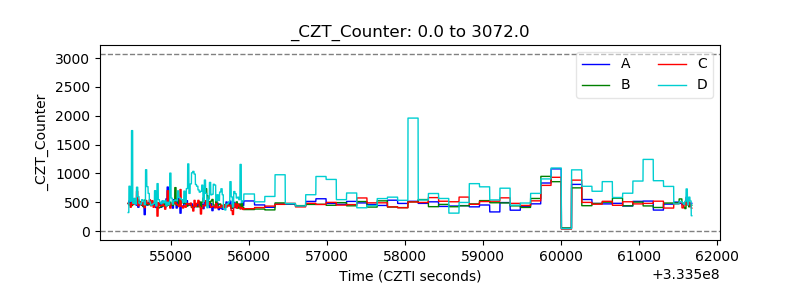 |
| +2.5 Volts monitor | 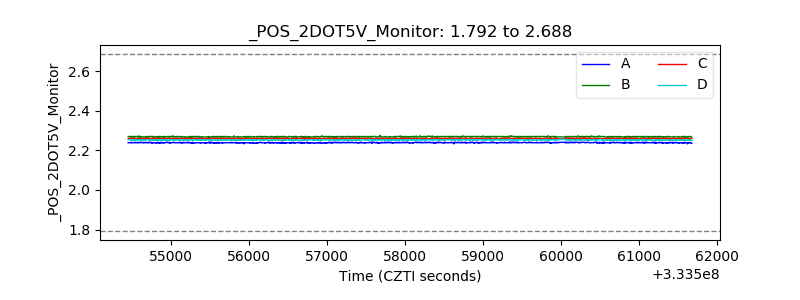 |
| +5 Volts monitor |  |
| _ROLL_ROT | 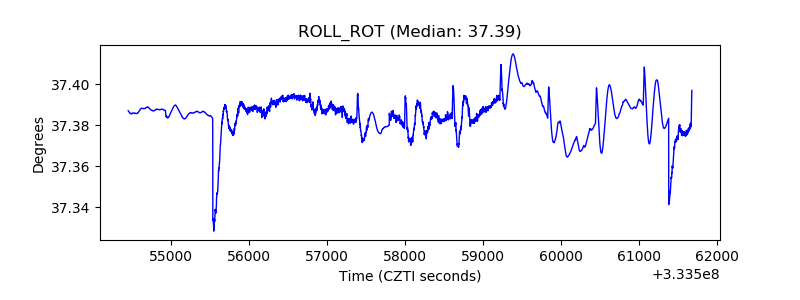 |
| _Roll_DEC | 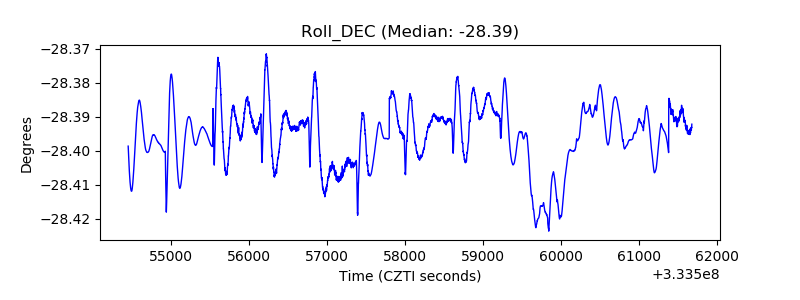 |
| _Roll_RA | 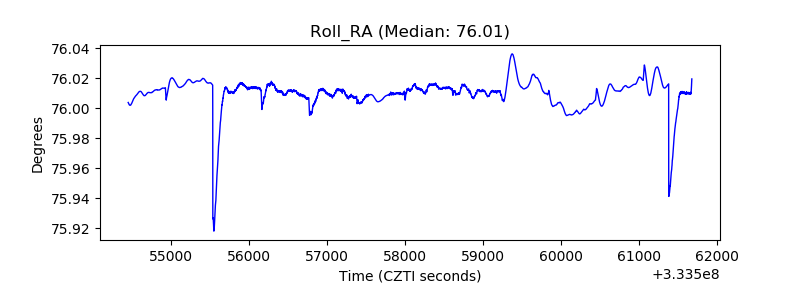 |
| Veto Counter | 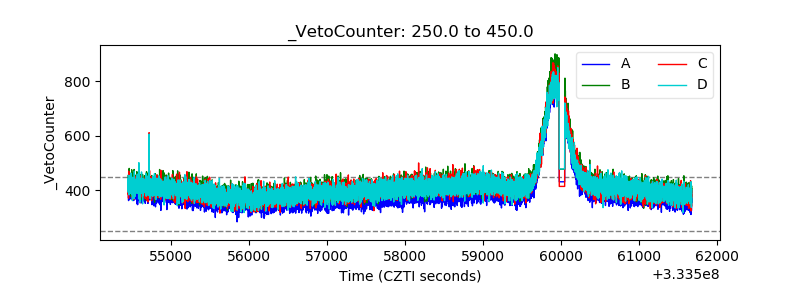 |