| Param | Original file | Final file |
|---|---|---|
| Filename | modeM0/AS1A09_138T04_9000003776_26118cztM0_level2.evt | modeM0/AS1A09_138T04_9000003776_26118cztM0_level2_quad_clean.evt |
| Size (bytes) | 565,073,280 | 84,107,520 |
| Size | 538.9 MB | 80.2 MB |
| Events in quadrant A | 3,814,785 | 510,715 |
| Events in quadrant B | 3,751,697 | 523,564 |
| Events in quadrant C | 3,809,844 | 493,800 |
| Events in quadrant D | 5,225,314 | 494,224 |
| Mode M9 | |||
|---|---|---|---|
| Quadrant | BADHDUFLAG | Total packets | Discarded packets |
| A | 0 | 3 | 0 |
| B | 0 | 3 | 0 |
| C | 0 | 3 | 0 |
| D | 0 | 3 | 0 |
| Mode M0 | |||
|---|---|---|---|
| Quadrant | BADHDUFLAG | Total packets | Discarded packets |
| A | 0 | 16064 | 0 |
| B | 0 | 15771 | 0 |
| C | 0 | 15992 | 0 |
| D | 0 | 20512 | 0 |
| Quadrant | Total seconds | Saturated seconds | Saturation percentage |
|---|---|---|---|
| A | 7542 | 126 | 1.670644% |
| B | 7543 | 142 | 1.882540% |
| C | 7542 | 154 | 2.041899% |
| D | 7542 | 419 | 5.555556% |
Noise dominated data is calculated using 1-second bins in cleaned event files. If a bin has >2000 counts, and if more than 50% of those come from <1% of pixels, then it is considered to be noise-dominated and hence unusable.
| Quadrant | # 1 sec bins | Bins with >0 counts | Bins with >2000 counts | High rate bins dominated by noise | Noise dominated (total time) | Noise dominated (detector-on time) | Marked lightcurve |
|---|---|---|---|---|---|---|---|
| A | 7822 | 7542 | 6 | 6 | 0.08% | 0.08% | 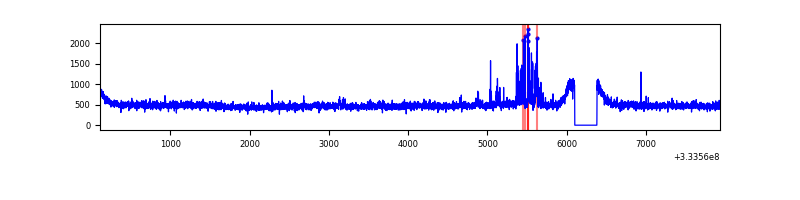 |
| B | 7823 | 7543 | 0 | 0 | 0.00% | 0.00% | 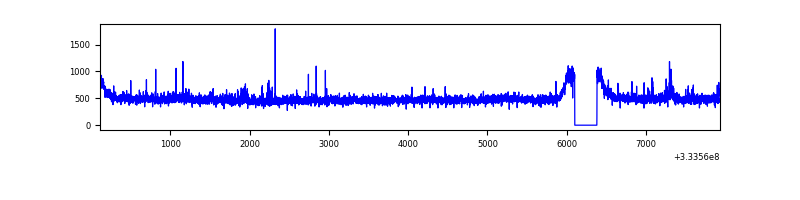 |
| C | 7822 | 7542 | 2 | 2 | 0.03% | 0.03% | 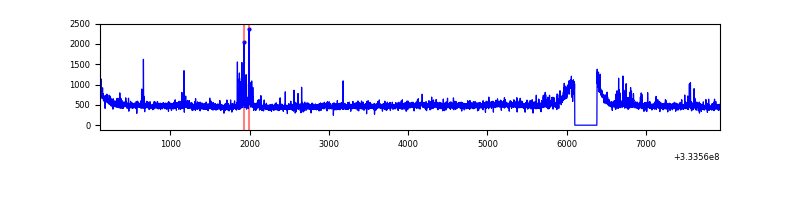 |
| D | 7822 | 7542 | 308 | 308 | 3.94% | 4.08% | 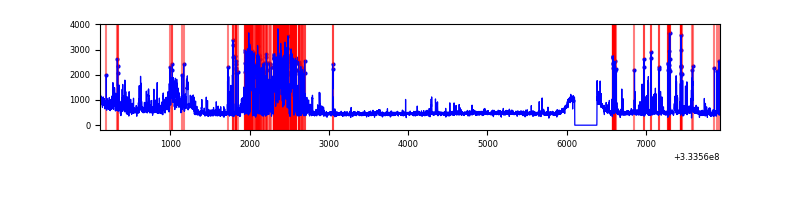 |
Top three noisy pixels from each quadrant. If the there are fewer than three noisy pixels in the level2.evt file, extra rows are filled as -1
| Pixel properties | Quadrant properties | ||||||
|---|---|---|---|---|---|---|---|
| Quadrant | DetID | PixID | Counts | Sigma | Mean | Median | Sigma |
| A | 0 | 13 | 180808 | 937.47 | 942 | 919 | 191.9 |
| A | 13 | 254 | 11186 | 53.51 | 942 | 919 | 191.9 |
| A | 3 | 137 | 8861 | 41.39 | 942 | 919 | 191.9 |
| B | 0 | 190 | 43586 | 236.8 | 931 | 907 | 180.2 |
| B | 5 | 172 | 25852 | 138.4 | 931 | 907 | 180.2 |
| B | 12 | 111 | 22000 | 117.03 | 931 | 907 | 180.2 |
| C | 14 | 238 | 140782 | 659.49 | 894 | 901 | 212.1 |
| C | 3 | 233 | 99896 | 466.73 | 894 | 901 | 212.1 |
| C | 2 | 16 | 52071 | 241.25 | 894 | 901 | 212.1 |
| D | 7 | 80 | 959684 | 4396.35 | 900 | 880 | 218.1 |
| D | 13 | 168 | 512423 | 2345.55 | 900 | 880 | 218.1 |
| D | 1 | 52 | 133769 | 609.33 | 900 | 880 | 218.1 |
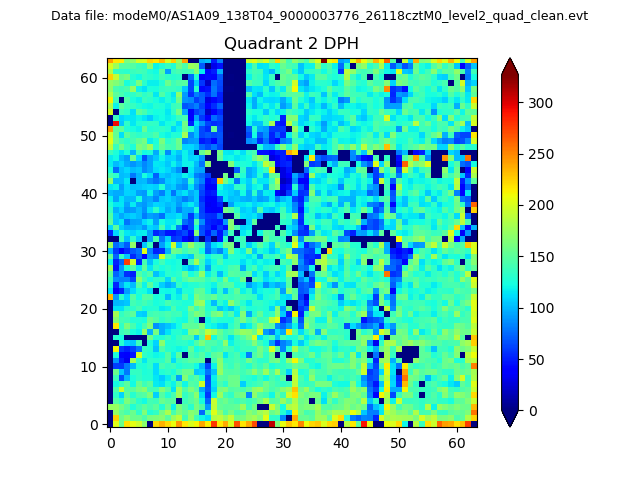
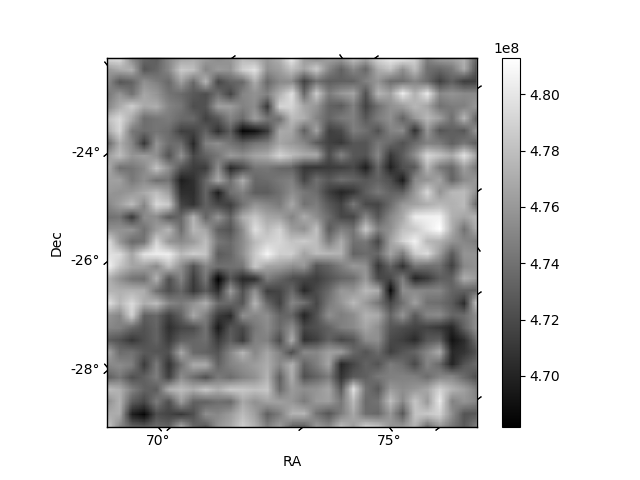
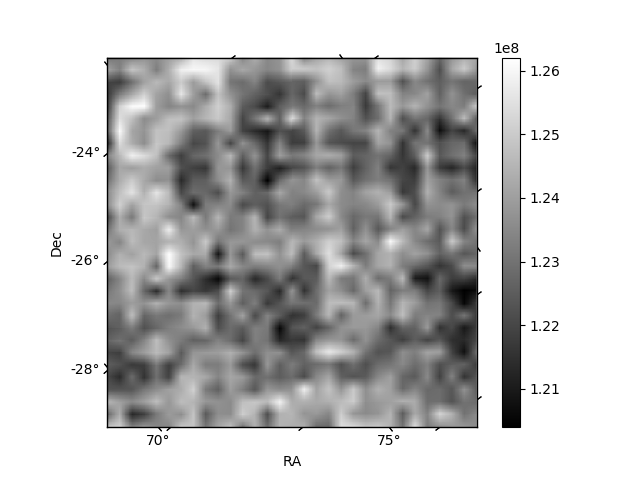
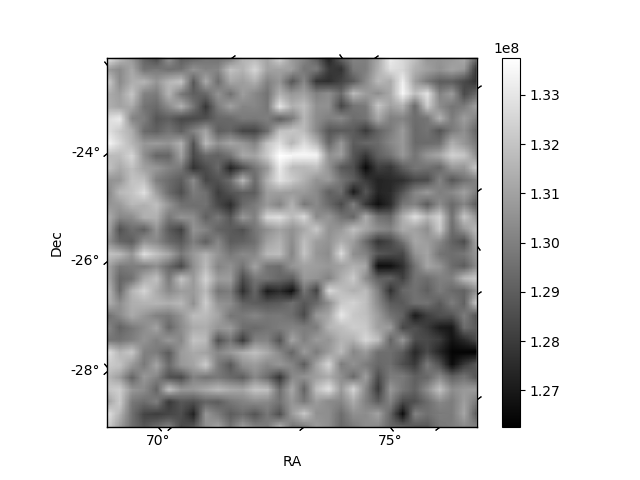
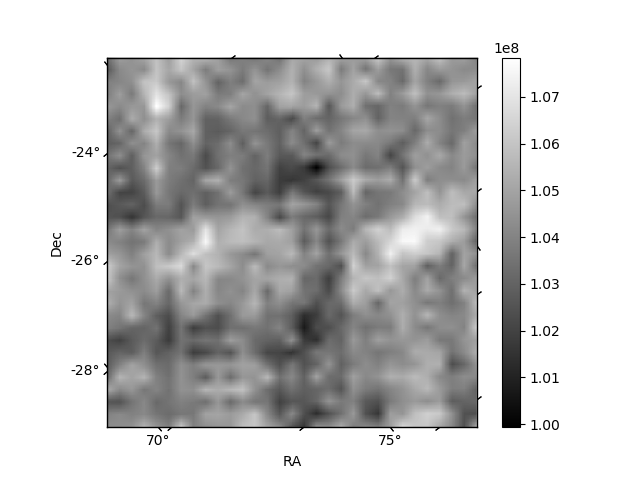
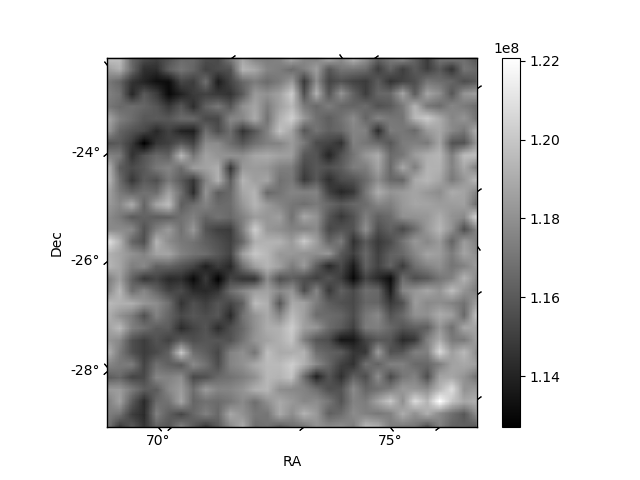
Histogram calculated using DETX and DETY for each event in the final _common_clean file
| Quadrant A | 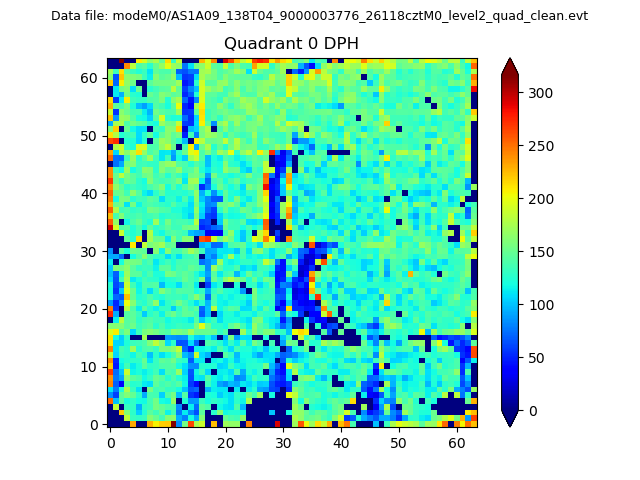 |
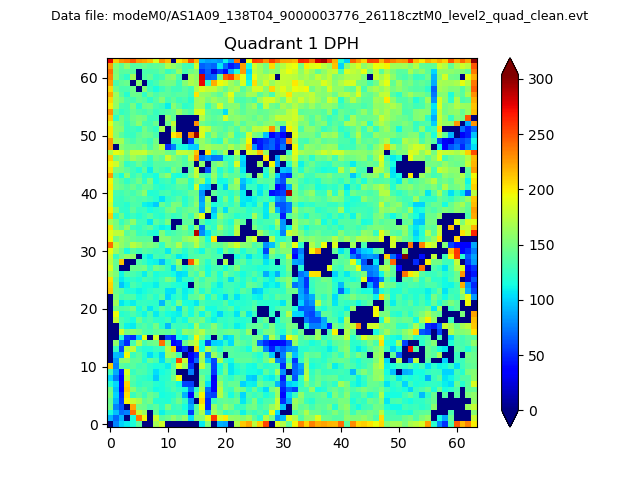 |
Quadrant B |
|---|---|---|---|
| Quadrant D | 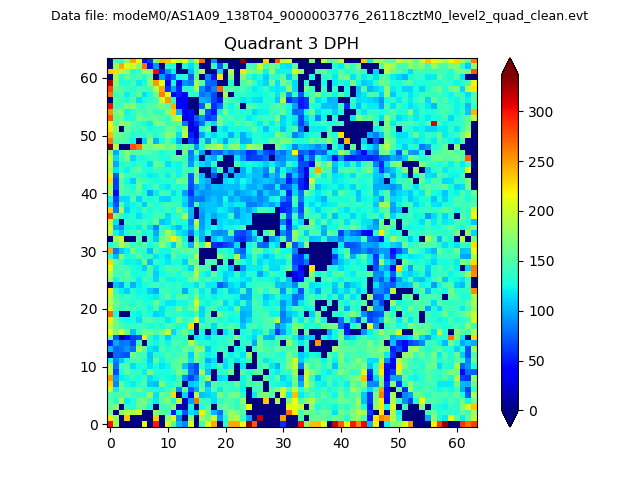 |
 |
Quadrant C |
| Plot type | Count rate plots | Images |
|---|---|---|
| Comparison with Poisson distribution Blue bars denote a histogram of data divided into 1 sec bins. Red curve is a Poisson curve with rate = median count rate of data. |
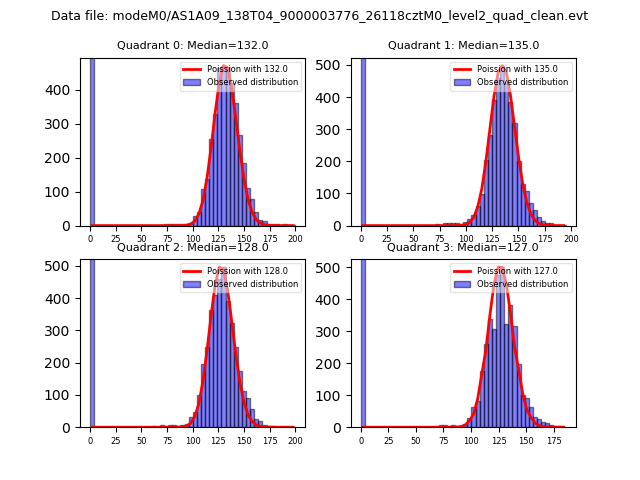 |
 |
| Quadrant-wise count rates Data is divided into 100 sec bins |
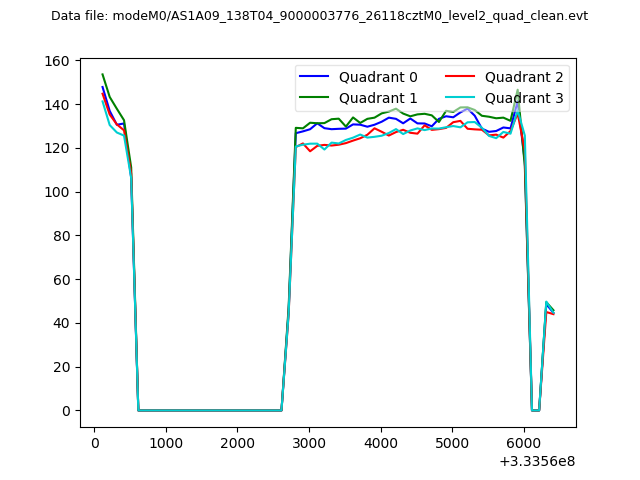 |
|
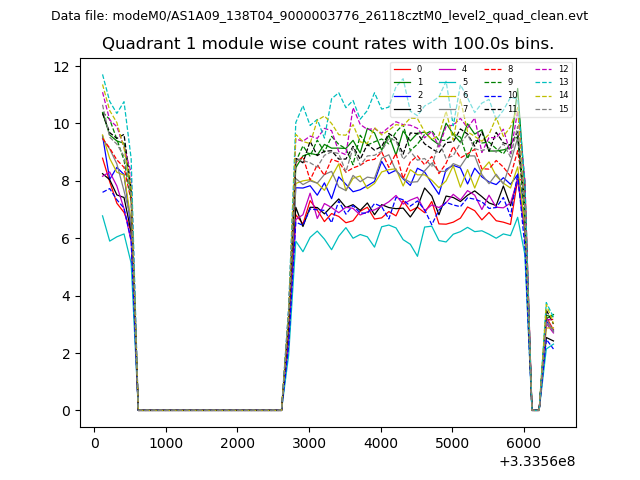
| Module-wise count rates for Quadrant A Data is divided into 100 sec bins |
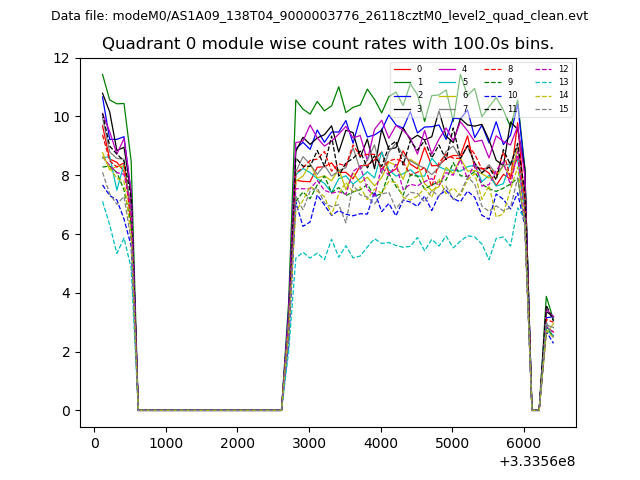 |
 |
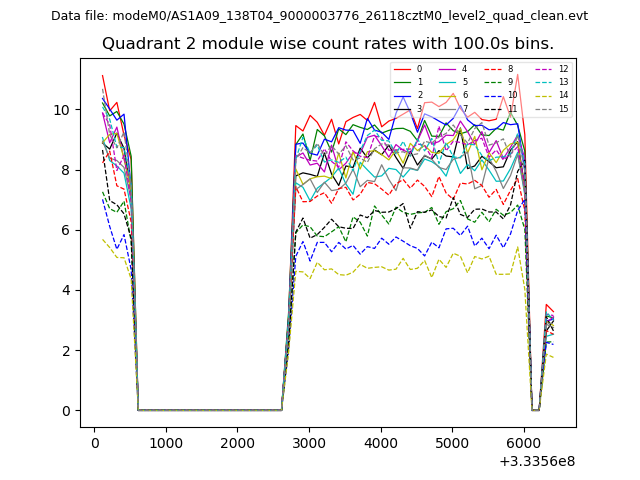
| Module-wise count rates for Quadrant B Data is divided into 100 sec bins |
 |
 |
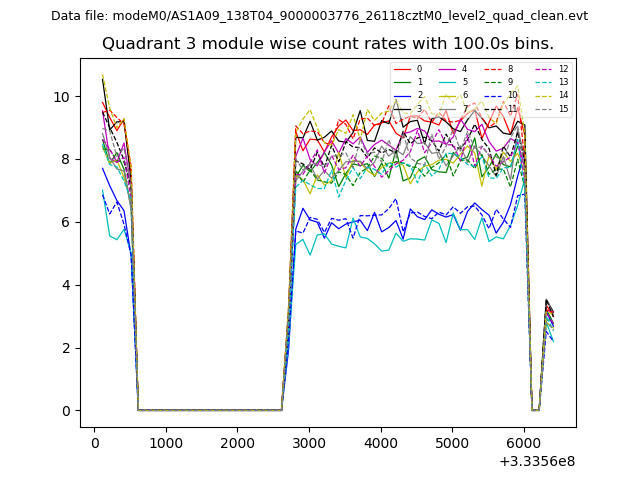
| Module-wise count rates for Quadrant C Data is divided into 100 sec bins |
 |
 |
| Module-wise count rates for Quadrant D Data is divided into 100 sec bins |
 |
 |
| Parameter | Plot |
|---|---|
| CZT HV Monitor | 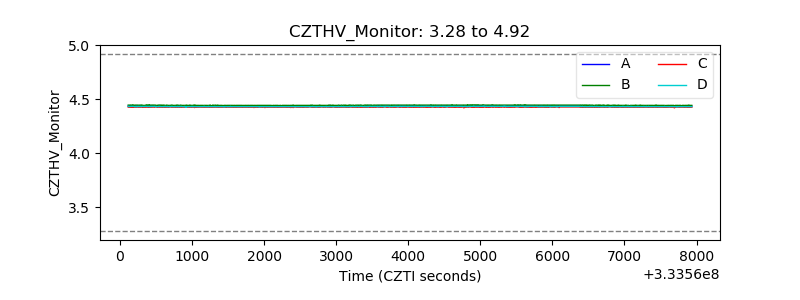 |
| D_VDD | 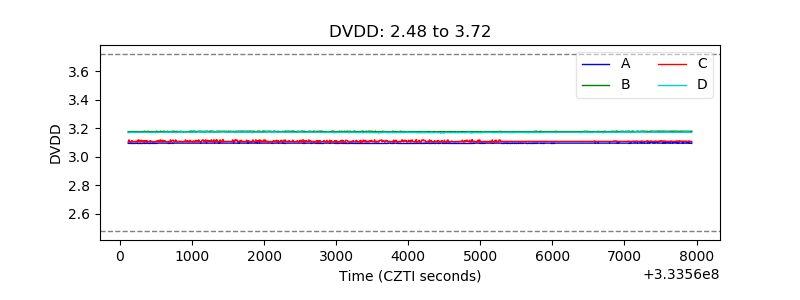 |
| Temperature 1 | 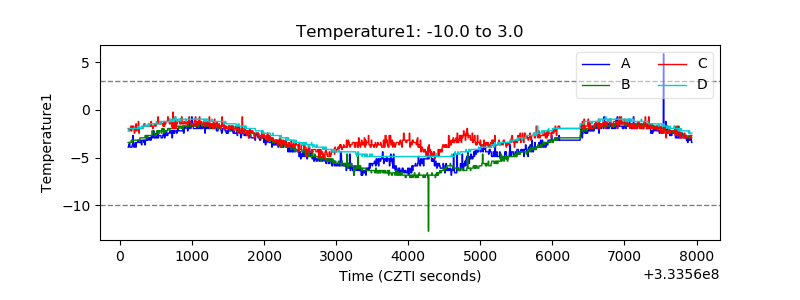 |
| Veto HV Monitor | 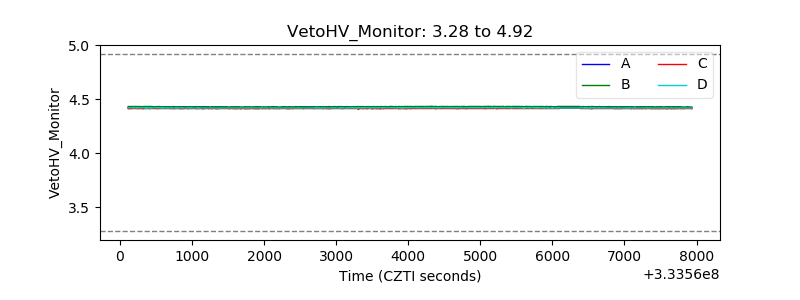 |
| Veto LLD | 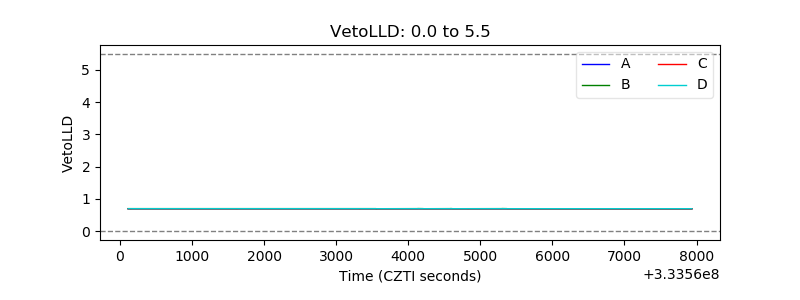 |
| Alpha Counter | 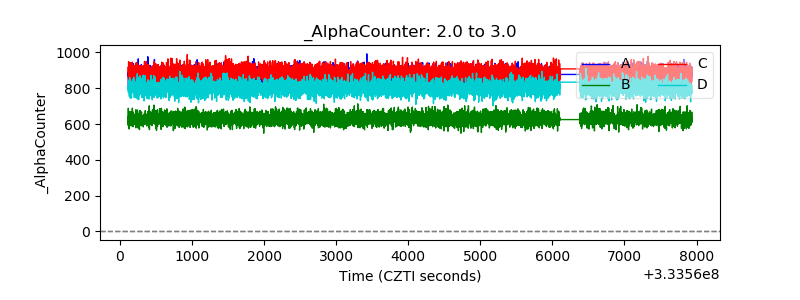 |
| _CPM_Rate | 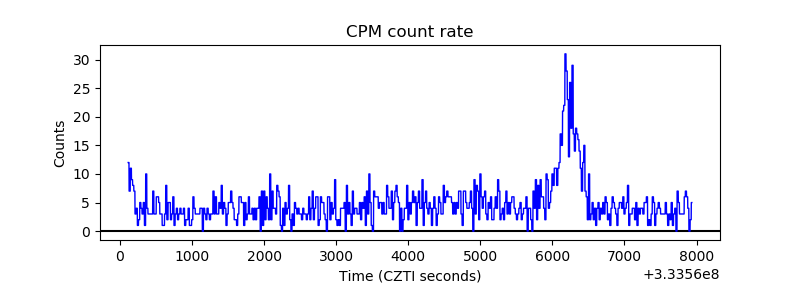 |
| CZT Counter | 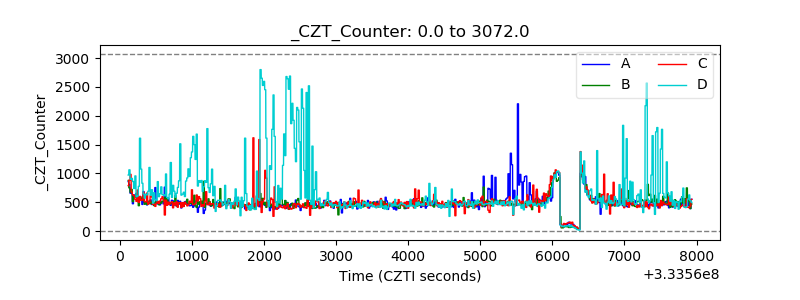 |
| +2.5 Volts monitor | 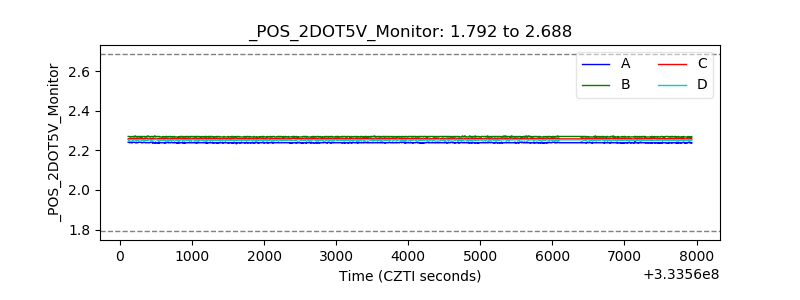 |
| +5 Volts monitor | 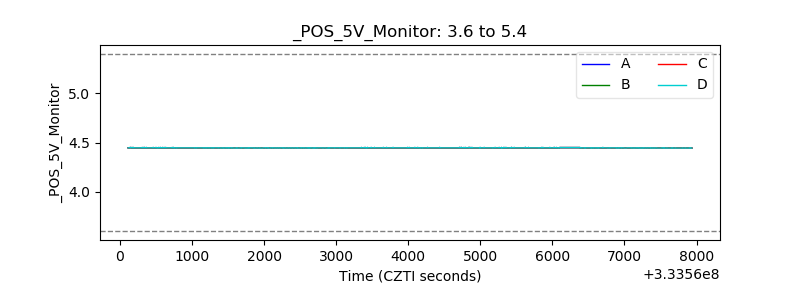 |
| _ROLL_ROT | 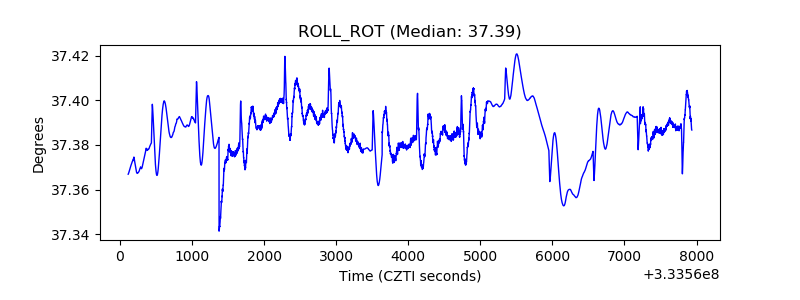 |
| _Roll_DEC |  |
| _Roll_RA | 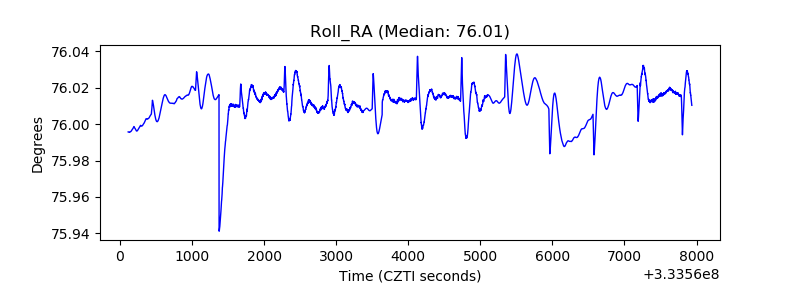 |
| Veto Counter | 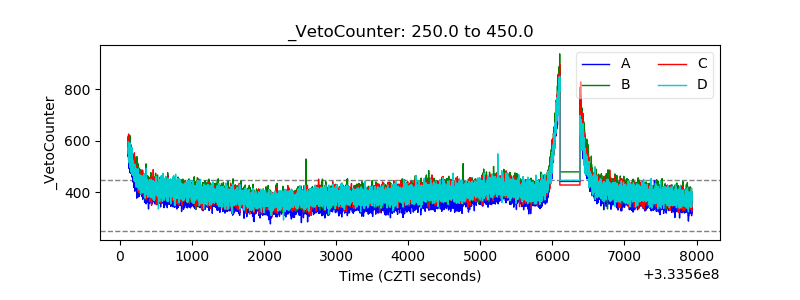 |