| Param | Original file | Final file |
|---|---|---|
| Filename | modeM0/AS1A09_138T04_9000003776_26120cztM0_level2.evt | modeM0/AS1A09_138T04_9000003776_26120cztM0_level2_quad_clean.evt |
| Size (bytes) | 659,136,960 | 101,972,160 |
| Size | 628.6 MB | 97.2 MB |
| Events in quadrant A | 3,953,587 | 638,506 |
| Events in quadrant B | 4,077,348 | 651,349 |
| Events in quadrant C | 4,075,474 | 613,715 |
| Events in quadrant D | 7,279,565 | 594,265 |
| Mode M9 | |||
|---|---|---|---|
| Quadrant | BADHDUFLAG | Total packets | Discarded packets |
| A | 0 | 5 | 0 |
| B | 0 | 5 | 0 |
| C | 0 | 5 | 0 |
| D | 0 | 5 | 0 |
| Mode M0 | |||
|---|---|---|---|
| Quadrant | BADHDUFLAG | Total packets | Discarded packets |
| A | 0 | 17228 | 0 |
| B | 0 | 17426 | 0 |
| C | 0 | 17498 | 0 |
| D | 0 | 27302 | 0 |
| Quadrant | Total seconds | Saturated seconds | Saturation percentage |
|---|---|---|---|
| A | 8495 | 55 | 0.647440% |
| B | 8495 | 63 | 0.741613% |
| C | 8495 | 103 | 1.212478% |
| D | 8496 | 1313 | 15.454331% |
Noise dominated data is calculated using 1-second bins in cleaned event files. If a bin has >2000 counts, and if more than 50% of those come from <1% of pixels, then it is considered to be noise-dominated and hence unusable.
| Quadrant | # 1 sec bins | Bins with >0 counts | Bins with >2000 counts | High rate bins dominated by noise | Noise dominated (total time) | Noise dominated (detector-on time) | Marked lightcurve |
|---|---|---|---|---|---|---|---|
| A | 9000 | 8495 | 0 | 0 | 0.00% | 0.00% | 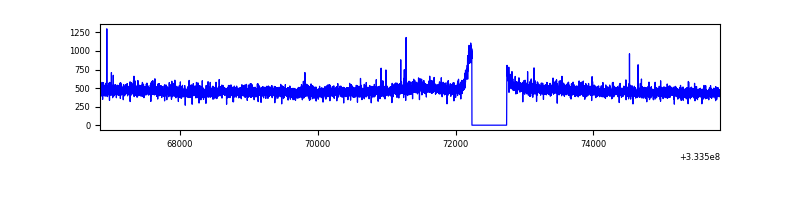 |
| B | 9000 | 8495 | 0 | 0 | 0.00% | 0.00% | 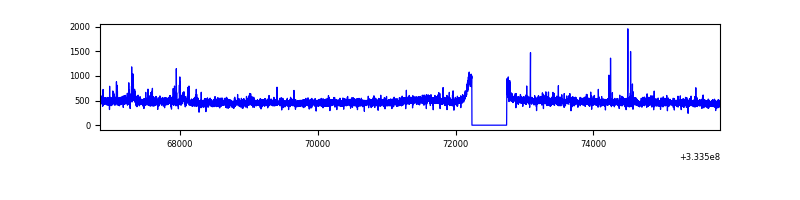 |
| C | 9000 | 8495 | 2 | 2 | 0.02% | 0.02% | 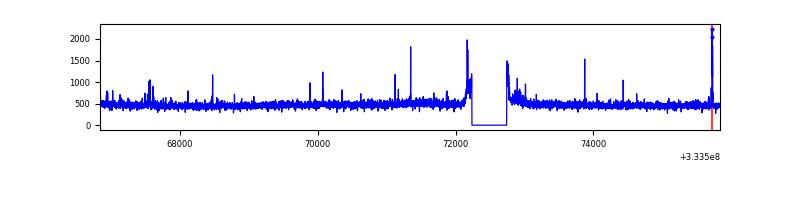 |
| D | 9001 | 8496 | 1145 | 1145 | 12.72% | 13.48% | 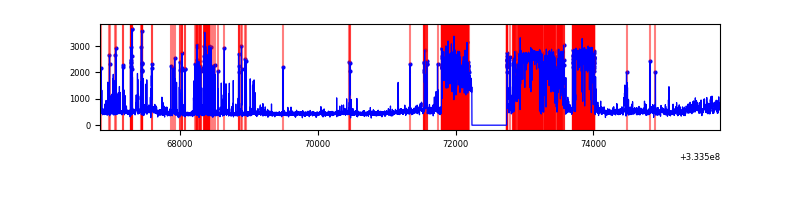 |
Top three noisy pixels from each quadrant. If the there are fewer than three noisy pixels in the level2.evt file, extra rows are filled as -1
| Pixel properties | Quadrant properties | ||||||
|---|---|---|---|---|---|---|---|
| Quadrant | DetID | PixID | Counts | Sigma | Mean | Median | Sigma |
| A | 0 | 13 | 16278 | 74.24 | 1019 | 997 | 205.8 |
| A | 13 | 254 | 13389 | 60.2 | 1019 | 997 | 205.8 |
| A | 3 | 137 | 9486 | 41.24 | 1019 | 997 | 205.8 |
| B | 5 | 172 | 39840 | 198.86 | 1013 | 986 | 195.4 |
| B | 0 | 190 | 33503 | 166.42 | 1013 | 986 | 195.4 |
| B | 0 | 229 | 29802 | 147.48 | 1013 | 986 | 195.4 |
| C | 14 | 238 | 155582 | 676.97 | 972 | 975 | 228.4 |
| C | 3 | 233 | 82778 | 358.19 | 972 | 975 | 228.4 |
| C | 2 | 16 | 38961 | 166.33 | 972 | 975 | 228.4 |
| D | 7 | 80 | 2495002 | 11264.66 | 908 | 882 | 221.4 |
| D | 12 | 233 | 1110828 | 5013.05 | 908 | 882 | 221.4 |
| D | 1 | 52 | 135417 | 607.62 | 908 | 882 | 221.4 |
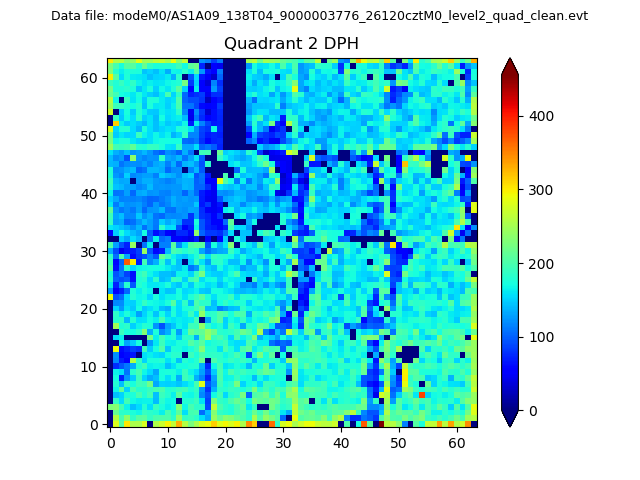
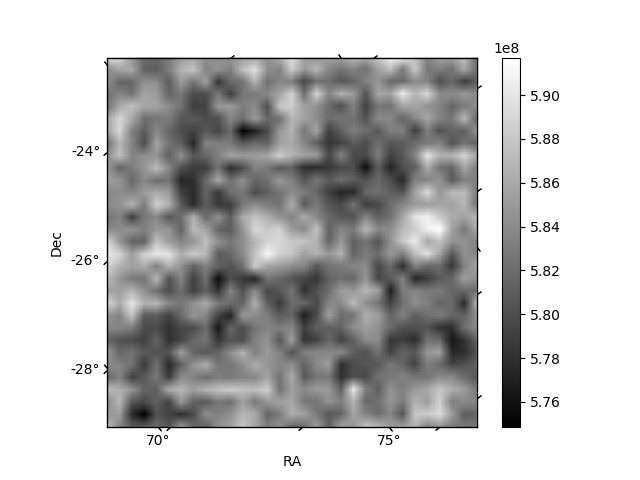
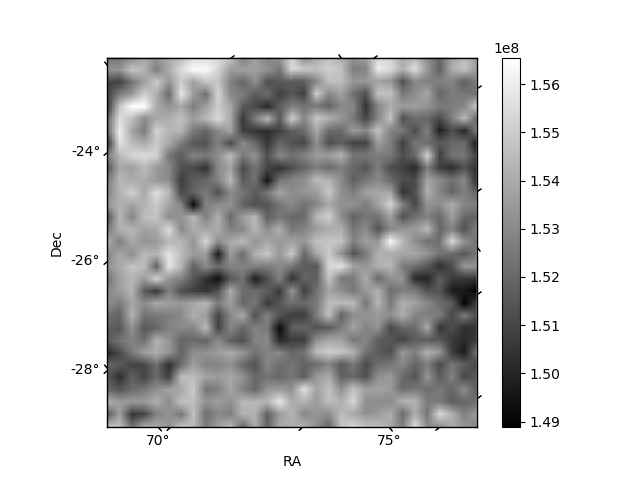
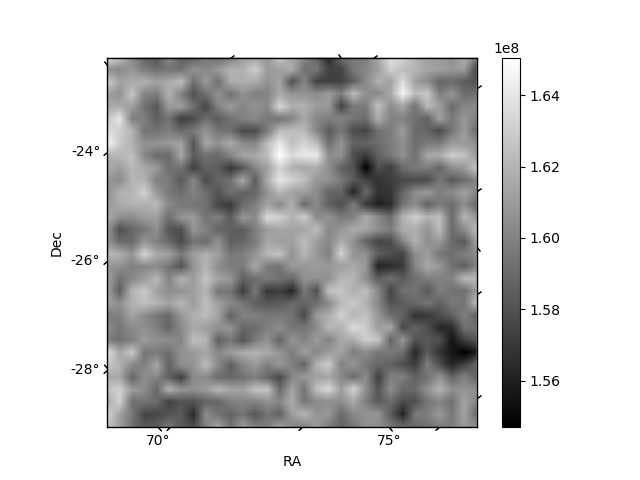
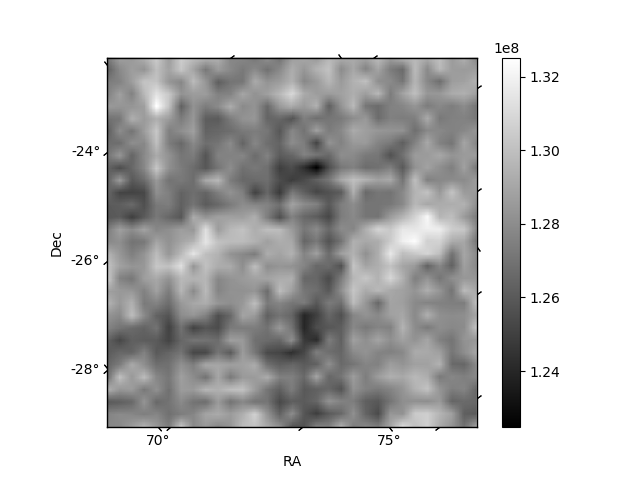
Histogram calculated using DETX and DETY for each event in the final _common_clean file
| Quadrant A | 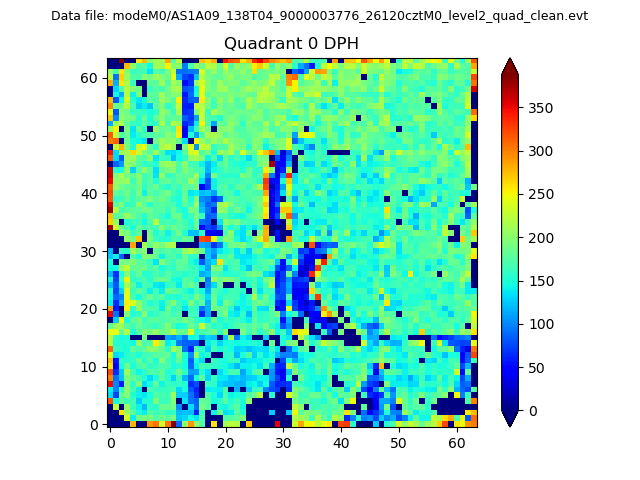 |
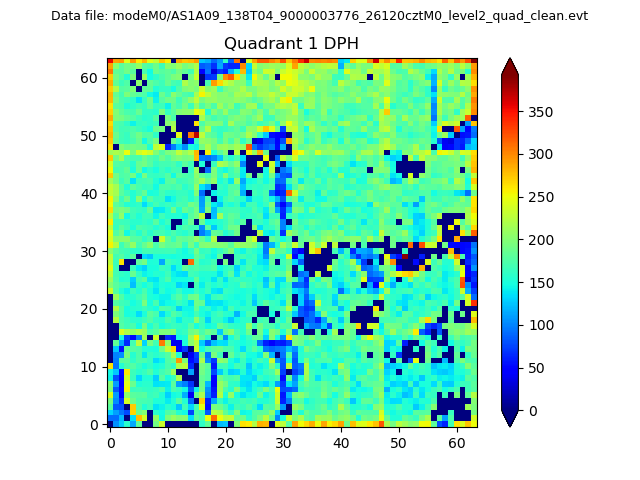 |
Quadrant B |
|---|---|---|---|
| Quadrant D | 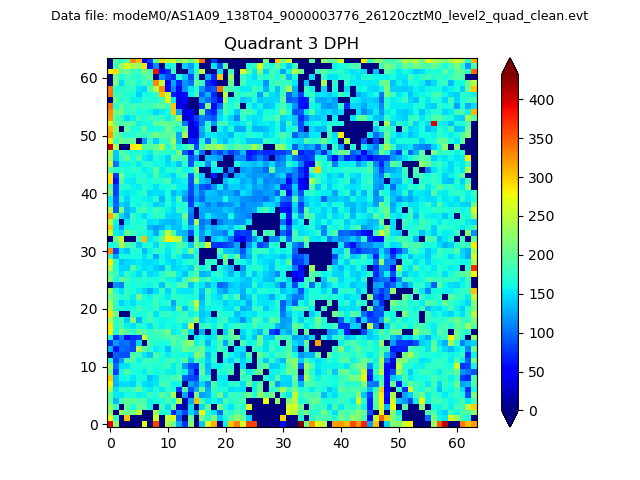 |
 |
Quadrant C |
| Plot type | Count rate plots | Images |
|---|---|---|
| Comparison with Poisson distribution Blue bars denote a histogram of data divided into 1 sec bins. Red curve is a Poisson curve with rate = median count rate of data. |
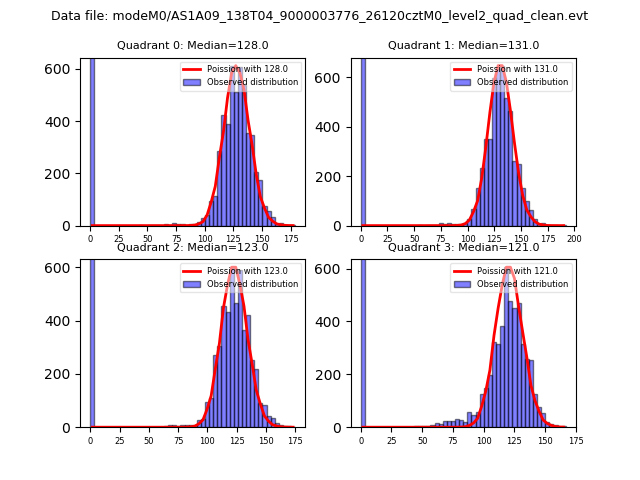 |
 |
| Quadrant-wise count rates Data is divided into 100 sec bins |
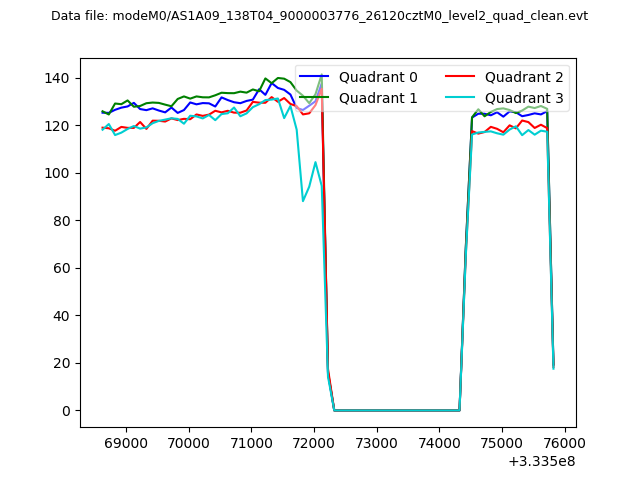 |
|
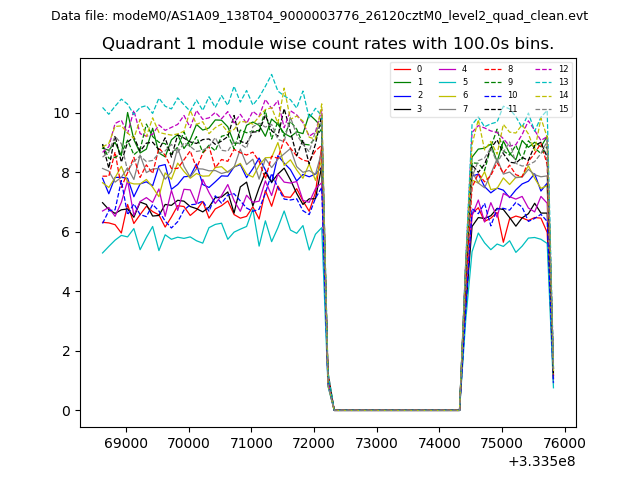
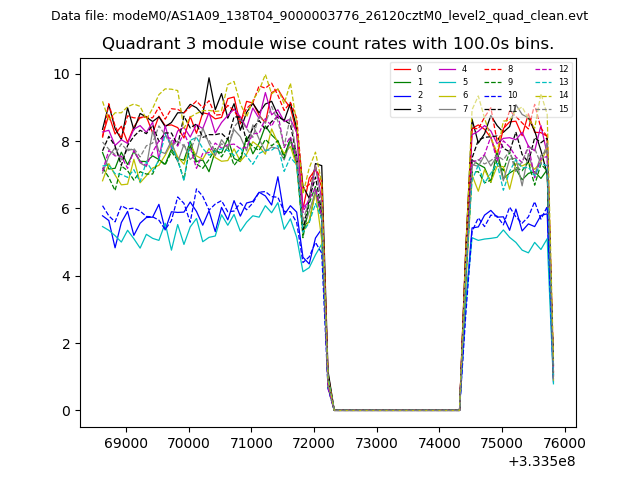
| Module-wise count rates for Quadrant A Data is divided into 100 sec bins |
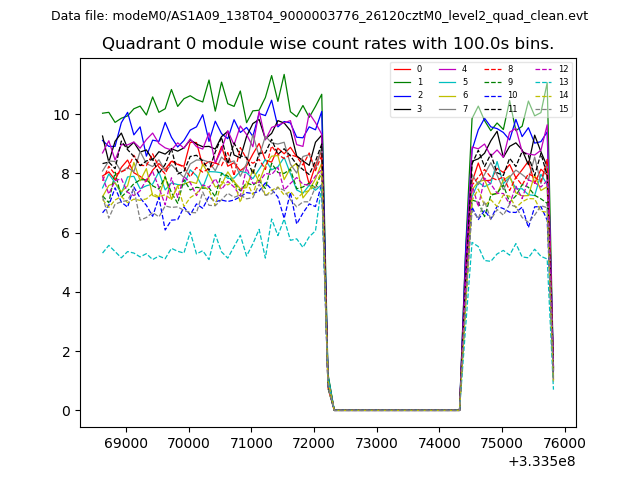 |
 |
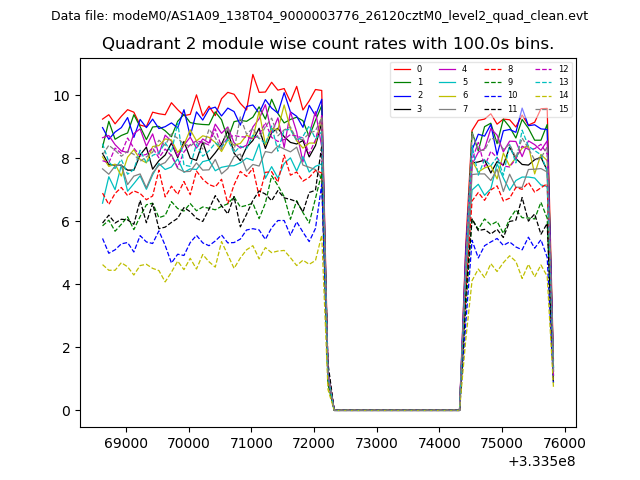
| Module-wise count rates for Quadrant B Data is divided into 100 sec bins |
 |
 |
| Module-wise count rates for Quadrant C Data is divided into 100 sec bins |
 |
 |
| Module-wise count rates for Quadrant D Data is divided into 100 sec bins |
 |
 |
| Parameter | Plot |
|---|---|
| CZT HV Monitor |  |
| D_VDD | 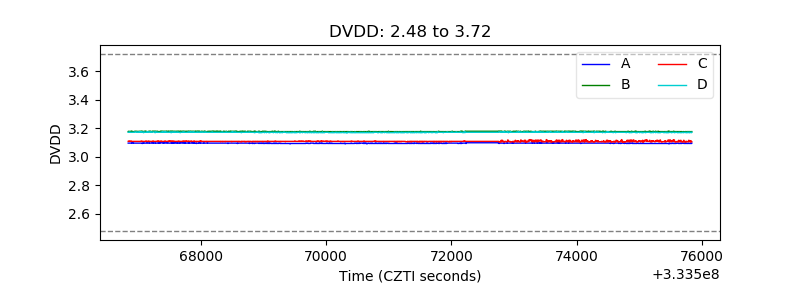 |
| Temperature 1 | 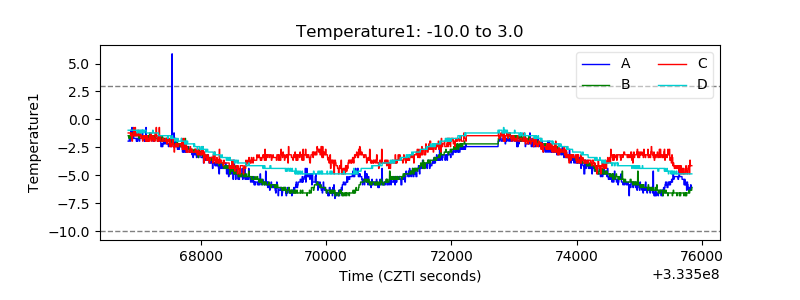 |
| Veto HV Monitor | 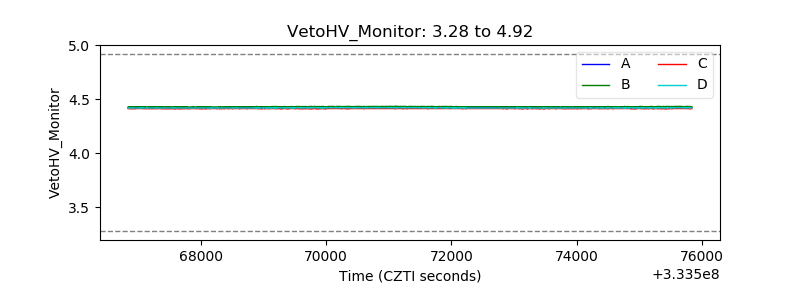 |
| Veto LLD | 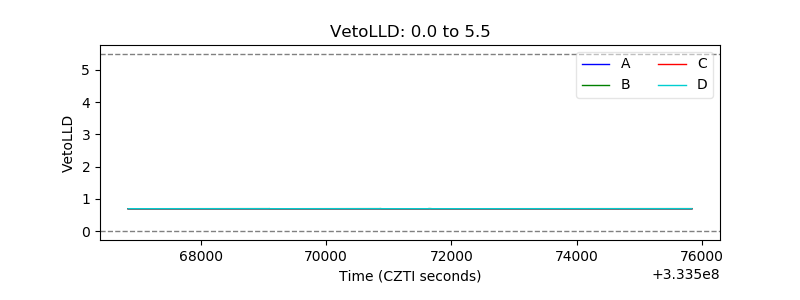 |
| Alpha Counter | 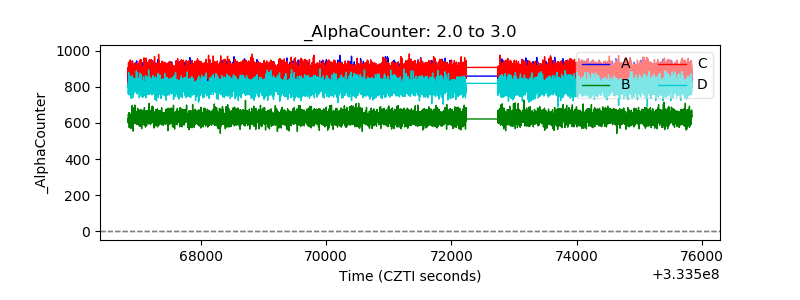 |
| _CPM_Rate | 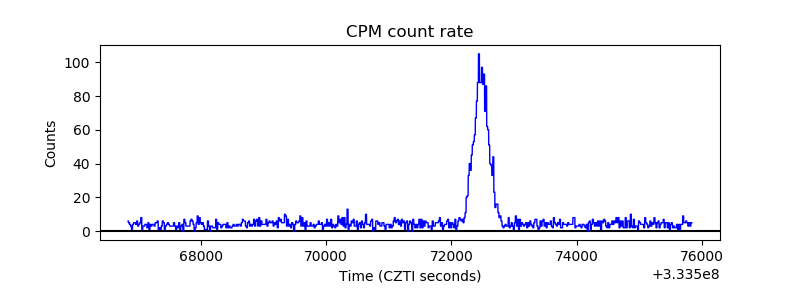 |
| CZT Counter | 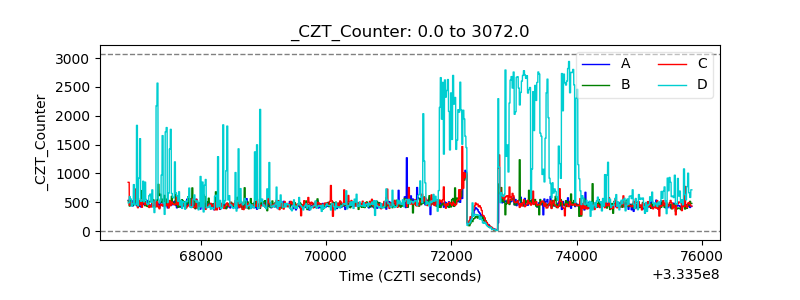 |
| +2.5 Volts monitor | 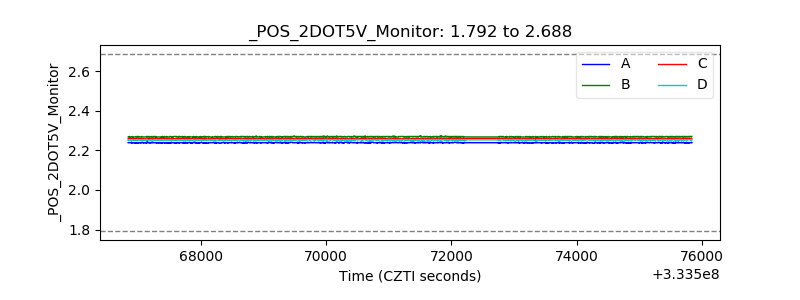 |
| +5 Volts monitor | 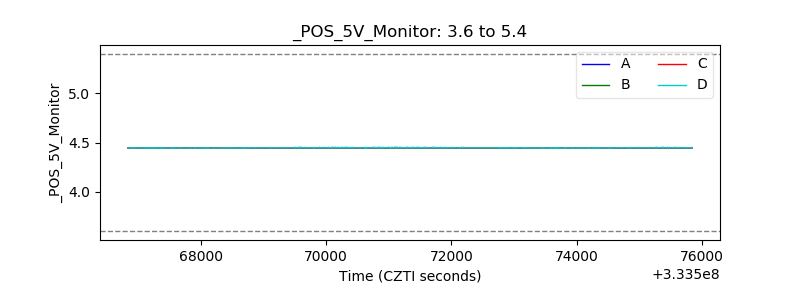 |
| _ROLL_ROT | 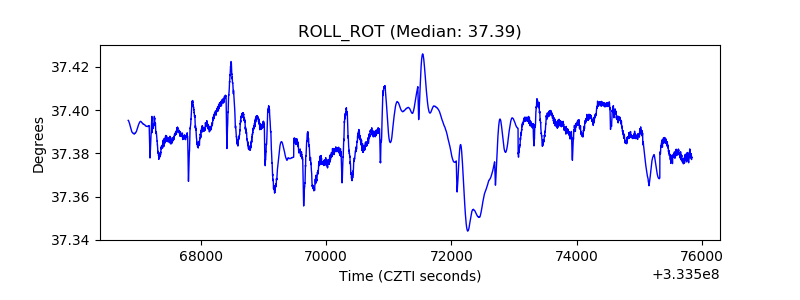 |
| _Roll_DEC | 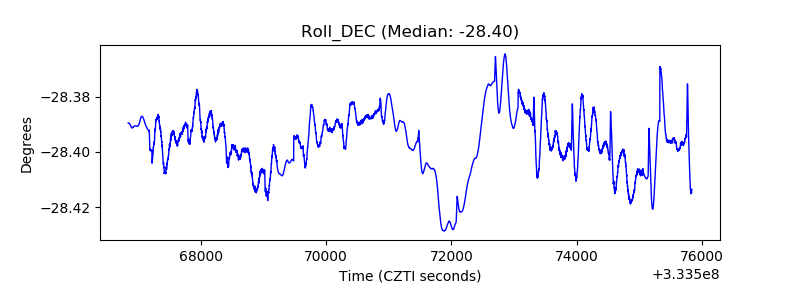 |
| _Roll_RA | 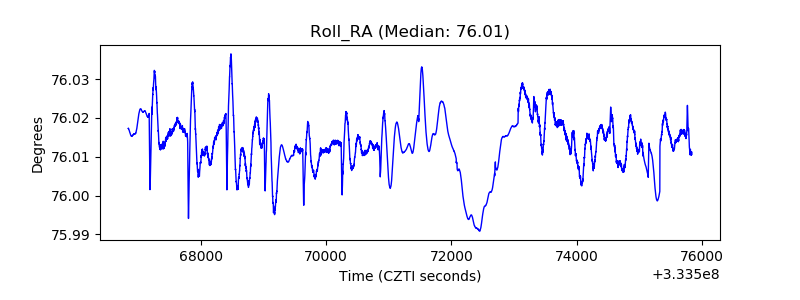 |
| Veto Counter | 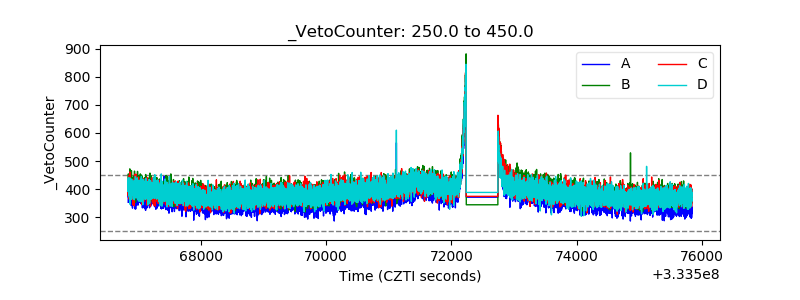 |