| Param | Original file | Final file |
|---|---|---|
| Filename | modeM0/AS1A09_138T04_9000003776_26121cztM0_level2.evt | modeM0/AS1A09_138T04_9000003776_26121cztM0_level2_quad_clean.evt |
| Size (bytes) | 838,941,120 | 148,838,400 |
| Size | 800.1 MB | 141.9 MB |
| Events in quadrant A | 5,328,084 | 968,657 |
| Events in quadrant B | 5,055,988 | 993,158 |
| Events in quadrant C | 5,219,921 | 930,110 |
| Events in quadrant D | 9,101,594 | 896,809 |
| Mode M9 | |||
|---|---|---|---|
| Quadrant | BADHDUFLAG | Total packets | Discarded packets |
| A | 0 | 15 | 0 |
| B | 0 | 15 | 0 |
| C | 0 | 15 | 0 |
| D | 0 | 15 | 0 |
| Mode M0 | |||
|---|---|---|---|
| Quadrant | BADHDUFLAG | Total packets | Discarded packets |
| A | 0 | 22402 | 0 |
| B | 0 | 21534 | 0 |
| C | 0 | 21861 | 0 |
| D | 0 | 34176 | 0 |
| Quadrant | Total seconds | Saturated seconds | Saturation percentage |
|---|---|---|---|
| A | 10381 | 85 | 0.818804% |
| B | 10382 | 81 | 0.780196% |
| C | 10381 | 154 | 1.483479% |
| D | 10381 | 593 | 5.712359% |
Noise dominated data is calculated using 1-second bins in cleaned event files. If a bin has >2000 counts, and if more than 50% of those come from <1% of pixels, then it is considered to be noise-dominated and hence unusable.
| Quadrant | # 1 sec bins | Bins with >0 counts | Bins with >2000 counts | High rate bins dominated by noise | Noise dominated (total time) | Noise dominated (detector-on time) | Marked lightcurve |
|---|---|---|---|---|---|---|---|
| A | 11921 | 10381 | 1 | 1 | 0.01% | 0.01% | 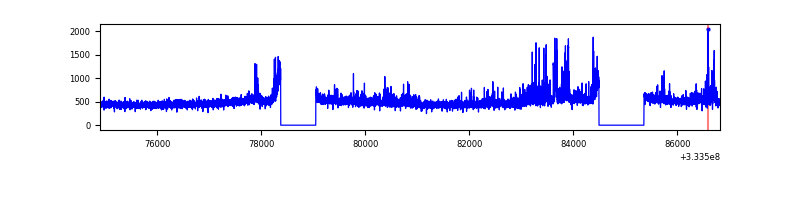 |
| B | 11922 | 10382 | 0 | 0 | 0.00% | 0.00% | 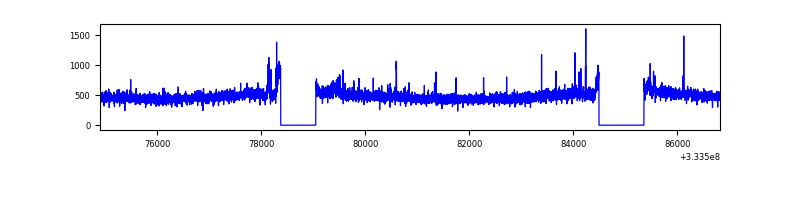 |
| C | 11921 | 10381 | 14 | 14 | 0.12% | 0.13% | 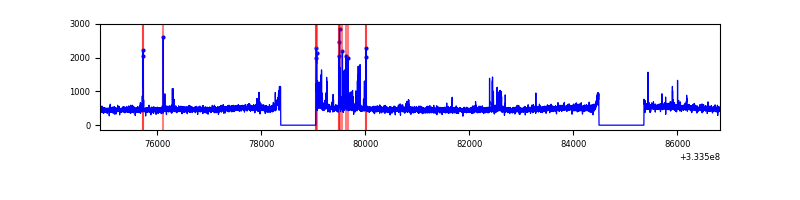 |
| D | 11921 | 10381 | 495 | 495 | 4.15% | 4.77% | 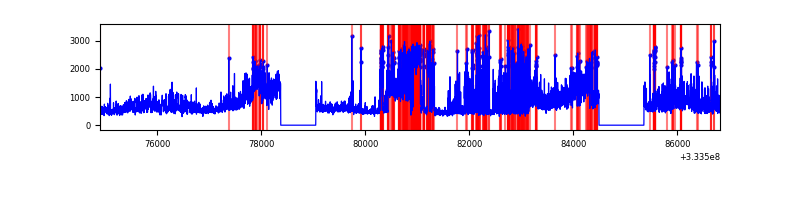 |
Top three noisy pixels from each quadrant. If the there are fewer than three noisy pixels in the level2.evt file, extra rows are filled as -1
| Pixel properties | Quadrant properties | ||||||
|---|---|---|---|---|---|---|---|
| Quadrant | DetID | PixID | Counts | Sigma | Mean | Median | Sigma |
| A | 0 | 13 | 434931 | 1705.49 | 1267 | 1242 | 254.3 |
| A | 13 | 254 | 16019 | 58.11 | 1267 | 1242 | 254.3 |
| A | 3 | 137 | 12033 | 42.44 | 1267 | 1242 | 254.3 |
| B | 0 | 190 | 76800 | 313.94 | 1262 | 1229 | 240.7 |
| B | 12 | 111 | 29775 | 118.59 | 1262 | 1229 | 240.7 |
| B | 11 | 111 | 26974 | 106.95 | 1262 | 1229 | 240.7 |
| C | 14 | 238 | 193961 | 668.86 | 1217 | 1225 | 288.2 |
| C | 2 | 16 | 179291 | 617.95 | 1217 | 1225 | 288.2 |
| C | 3 | 233 | 68267 | 232.66 | 1217 | 1225 | 288.2 |
| D | 7 | 80 | 3604527 | 12574.47 | 1210 | 1180 | 286.6 |
| D | 1 | 52 | 742248 | 2586.08 | 1210 | 1180 | 286.6 |
| D | 12 | 233 | 122248 | 422.49 | 1210 | 1180 | 286.6 |
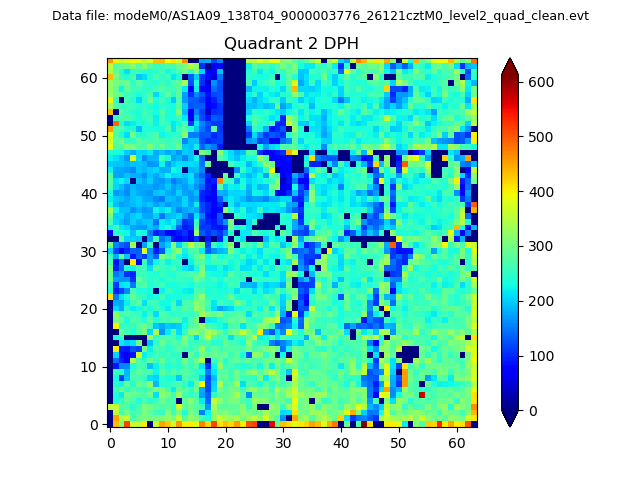
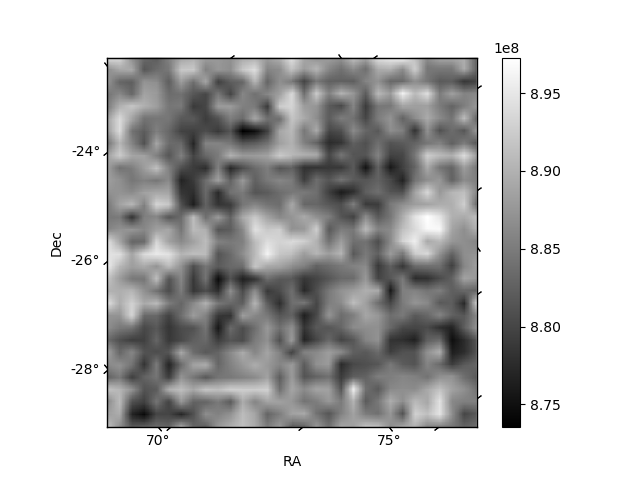
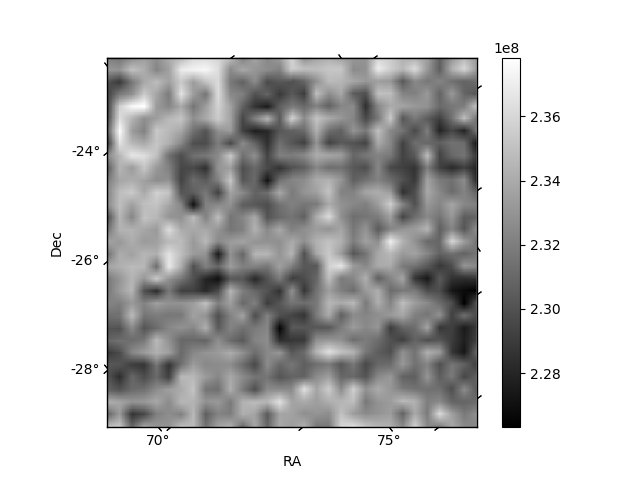
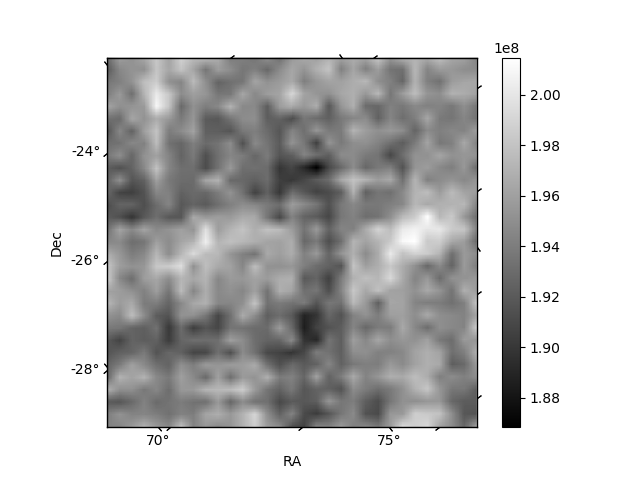
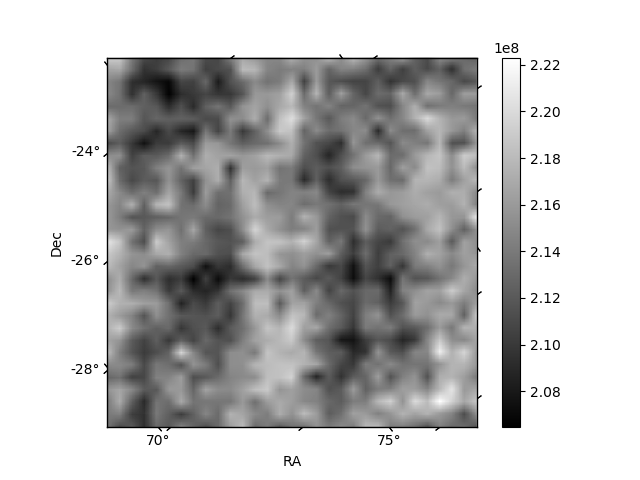
Histogram calculated using DETX and DETY for each event in the final _common_clean file
| Quadrant A | 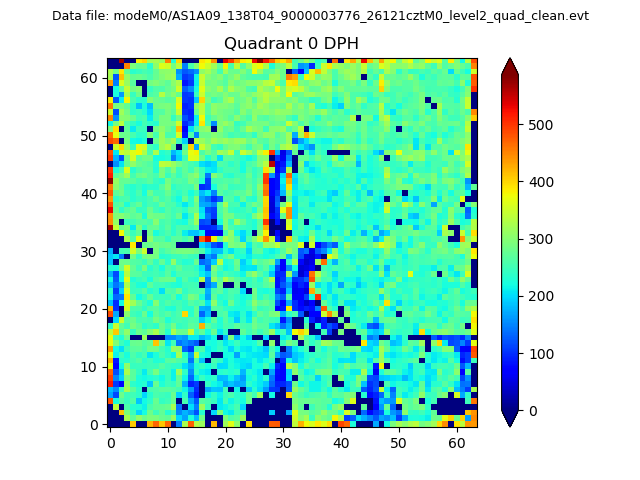 |
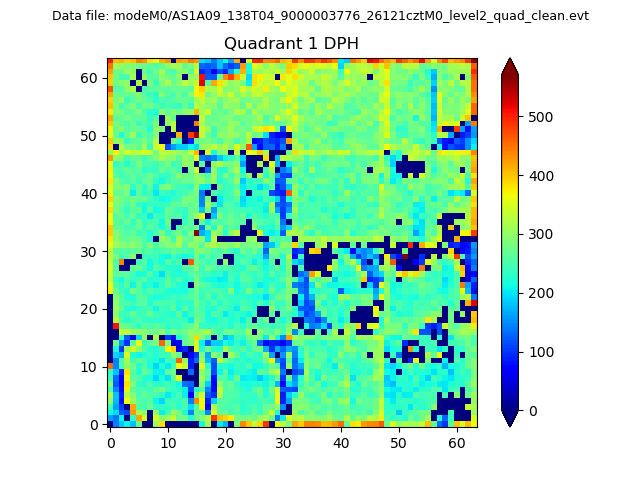 |
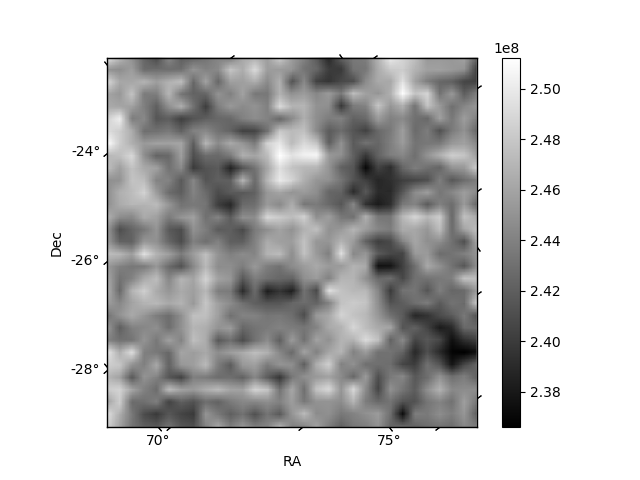
Quadrant B |
|---|---|---|---|
| Quadrant D | 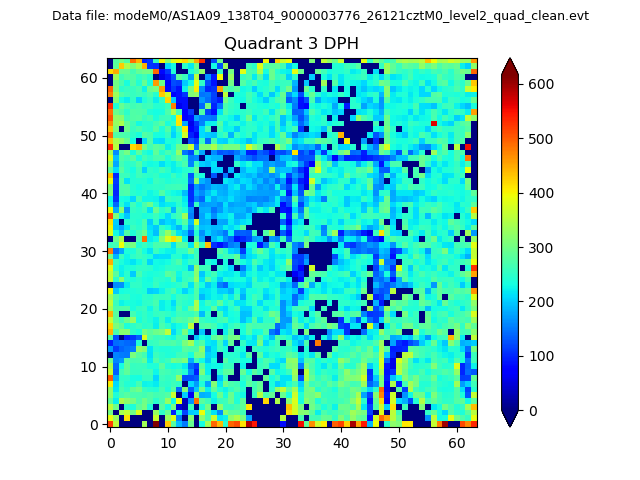 |
 |
Quadrant C |
| Plot type | Count rate plots | Images |
|---|---|---|
| Comparison with Poisson distribution Blue bars denote a histogram of data divided into 1 sec bins. Red curve is a Poisson curve with rate = median count rate of data. |
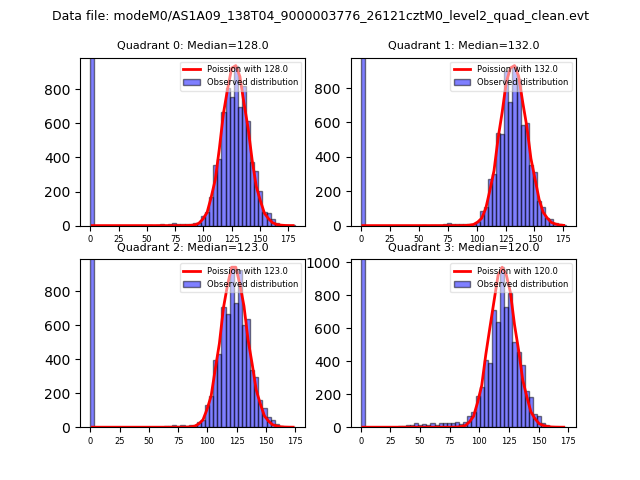 |
 |
| Quadrant-wise count rates Data is divided into 100 sec bins |
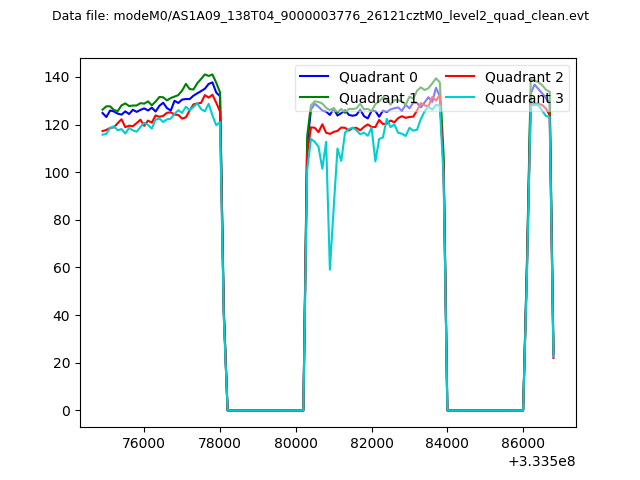 |
|
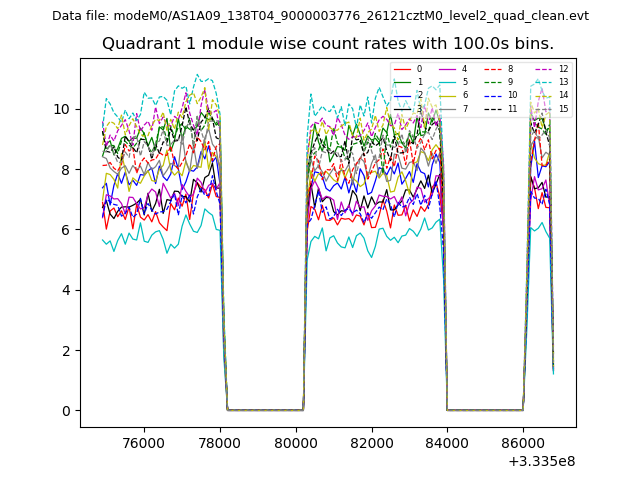
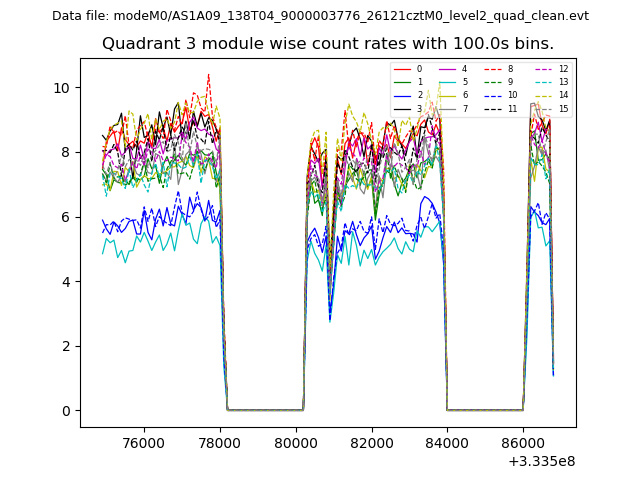
| Module-wise count rates for Quadrant A Data is divided into 100 sec bins |
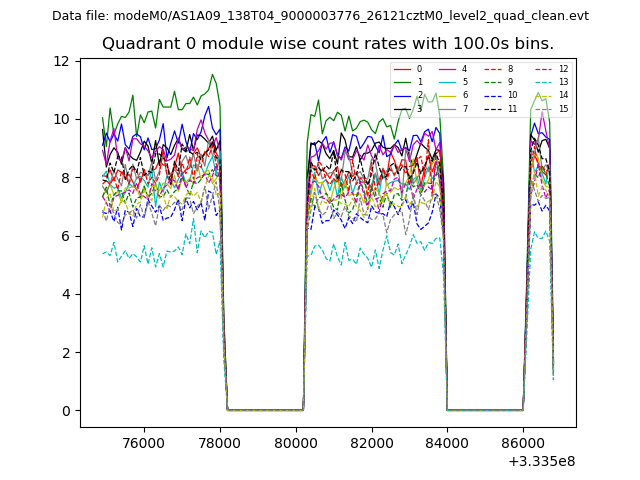 |
 |
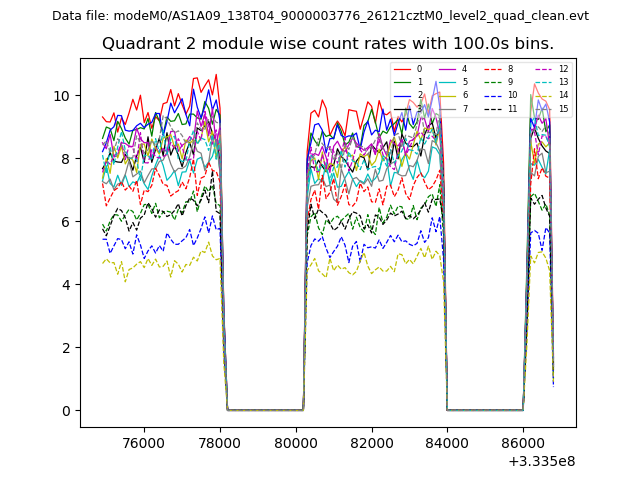
| Module-wise count rates for Quadrant B Data is divided into 100 sec bins |
 |
 |
| Module-wise count rates for Quadrant C Data is divided into 100 sec bins |
 |
 |
| Module-wise count rates for Quadrant D Data is divided into 100 sec bins |
 |
 |
| Parameter | Plot |
|---|---|
| CZT HV Monitor | 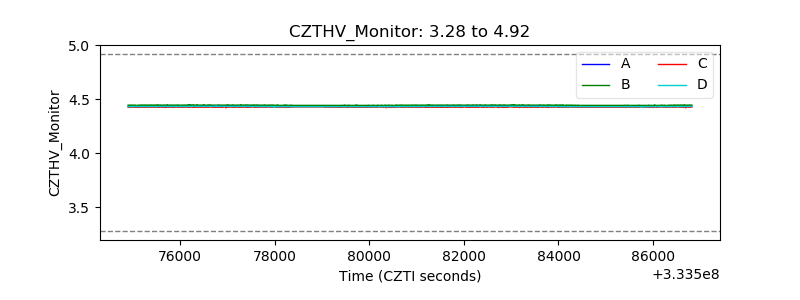 |
| D_VDD | 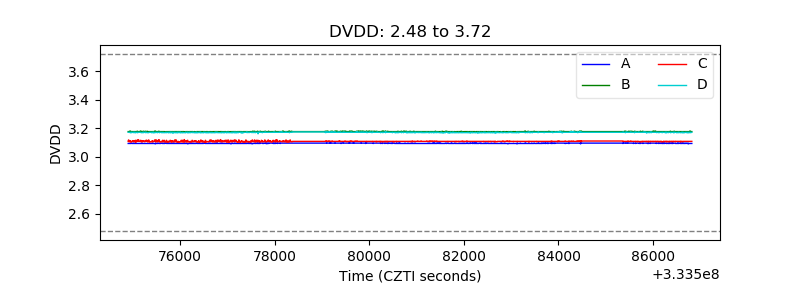 |
| Temperature 1 | 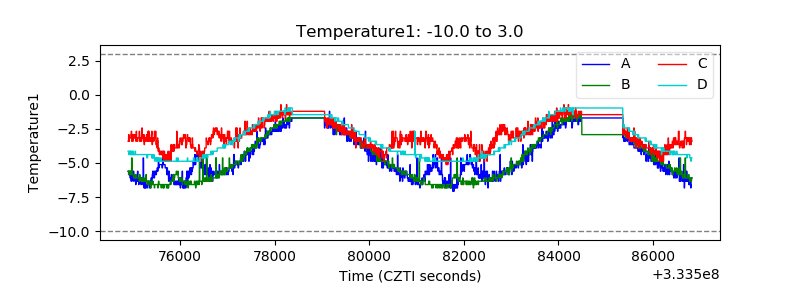 |
| Veto HV Monitor | 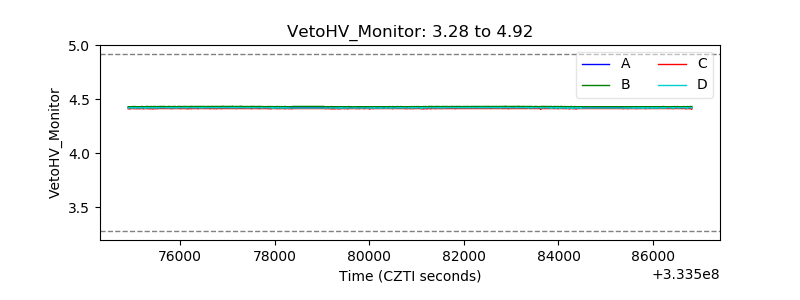 |
| Veto LLD | 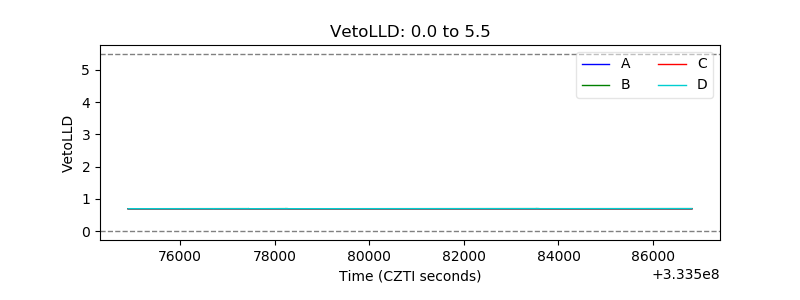 |
| Alpha Counter | 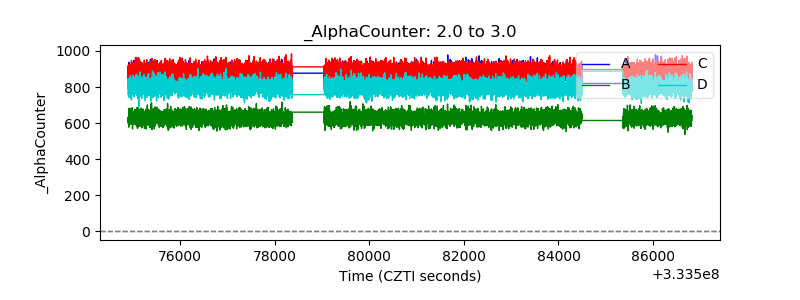 |
| _CPM_Rate | 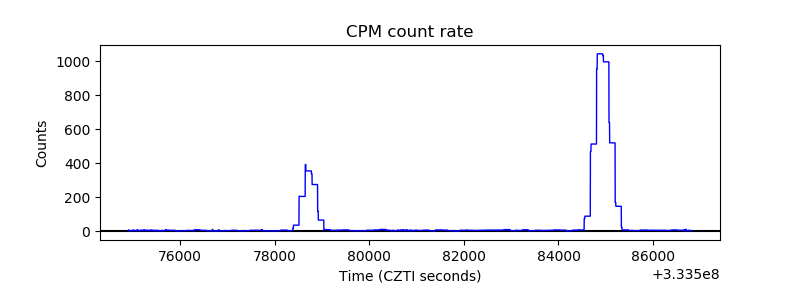 |
| CZT Counter | 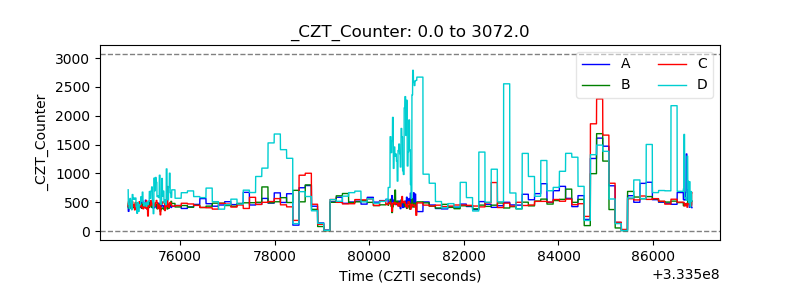 |
| +2.5 Volts monitor | 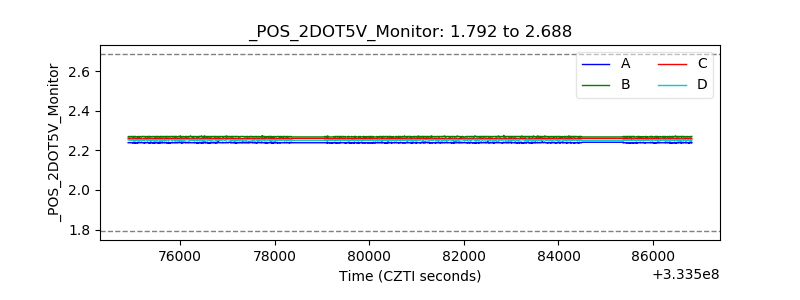 |
| +5 Volts monitor | 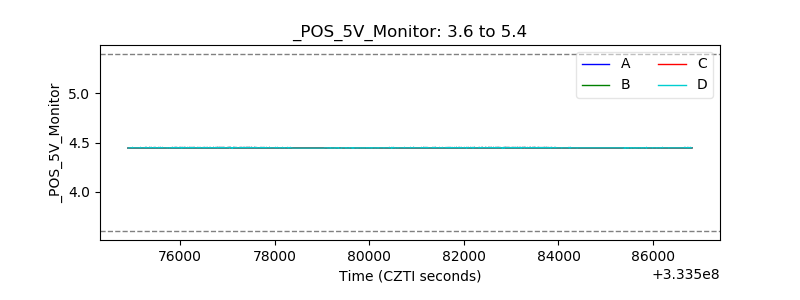 |
| _ROLL_ROT | 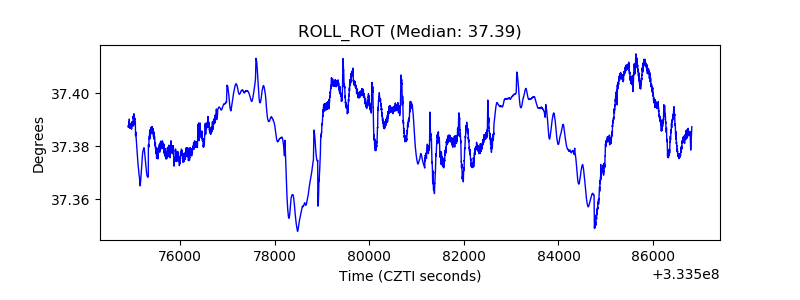 |
| _Roll_DEC | 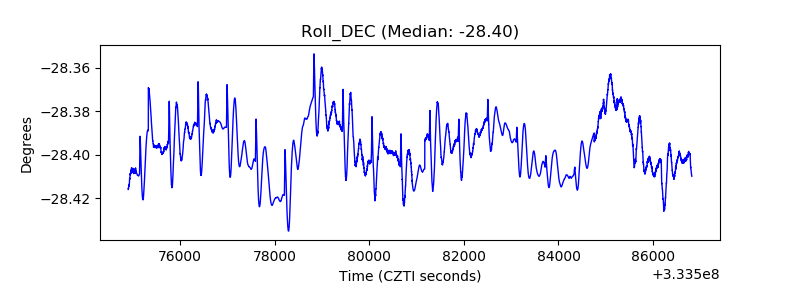 |
| _Roll_RA | 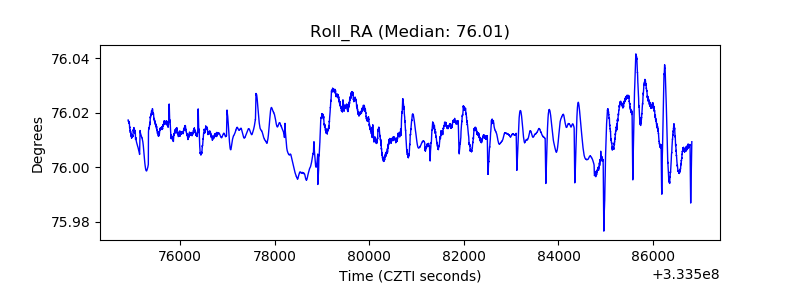 |
| Veto Counter | 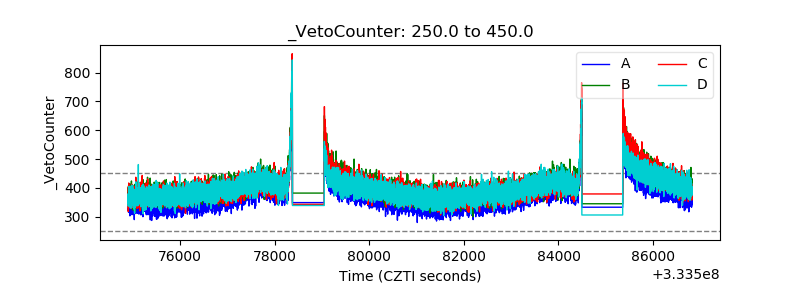 |