| Param | Original file | Final file |
|---|---|---|
| Filename | modeM0/AS1A09_138T04_9000003776_26122cztM0_level2.evt | modeM0/AS1A09_138T04_9000003776_26122cztM0_level2_quad_clean.evt |
| Size (bytes) | 560,923,200 | 95,693,760 |
| Size | 534.9 MB | 91.3 MB |
| Events in quadrant A | 3,820,581 | 620,813 |
| Events in quadrant B | 3,334,709 | 641,998 |
| Events in quadrant C | 3,352,976 | 604,513 |
| Events in quadrant D | 6,027,570 | 565,875 |
| Mode M9 | |||
|---|---|---|---|
| Quadrant | BADHDUFLAG | Total packets | Discarded packets |
| A | 0 | 13 | 0 |
| B | 0 | 14 | 0 |
| C | 0 | 14 | 0 |
| D | 0 | 14 | 0 |
| Mode M0 | |||
|---|---|---|---|
| Quadrant | BADHDUFLAG | Total packets | Discarded packets |
| A | 0 | 15604 | 0 |
| B | 0 | 13991 | 0 |
| C | 0 | 14009 | 0 |
| D | 0 | 22450 | 0 |
| Quadrant | Total seconds | Saturated seconds | Saturation percentage |
|---|---|---|---|
| A | 6663 | 67 | 1.005553% |
| B | 6663 | 20 | 0.300165% |
| C | 6663 | 76 | 1.140627% |
| D | 6662 | 745 | 11.182828% |
Noise dominated data is calculated using 1-second bins in cleaned event files. If a bin has >2000 counts, and if more than 50% of those come from <1% of pixels, then it is considered to be noise-dominated and hence unusable.
| Quadrant | # 1 sec bins | Bins with >0 counts | Bins with >2000 counts | High rate bins dominated by noise | Noise dominated (total time) | Noise dominated (detector-on time) | Marked lightcurve |
|---|---|---|---|---|---|---|---|
| A | 7693 | 6663 | 21 | 21 | 0.27% | 0.32% | 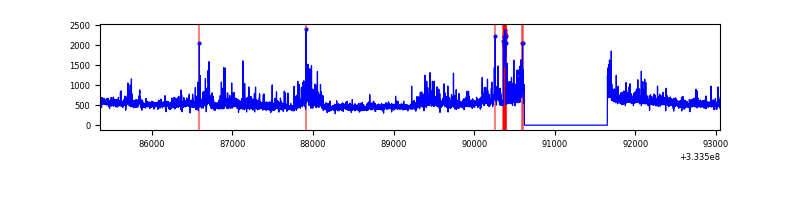 |
| B | 7693 | 6663 | 0 | 0 | 0.00% | 0.00% | 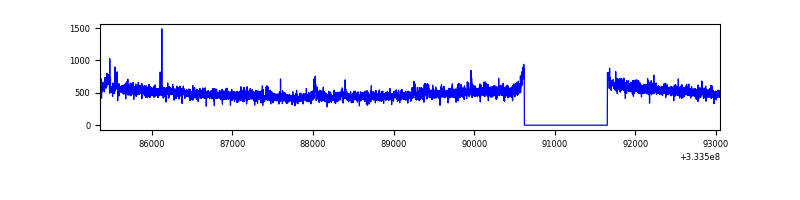 |
| C | 7693 | 6663 | 2 | 2 | 0.03% | 0.03% | 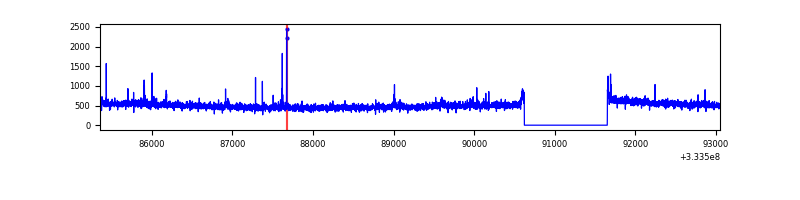 |
| D | 7691 | 6661 | 615 | 615 | 8.00% | 9.23% | 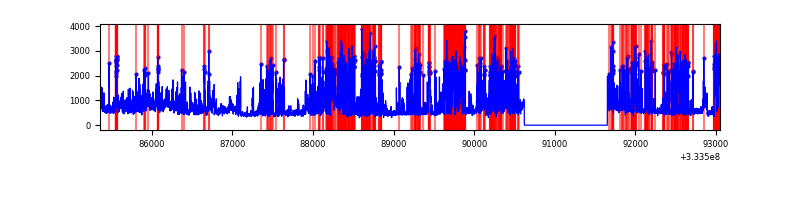 |
Top three noisy pixels from each quadrant. If the there are fewer than three noisy pixels in the level2.evt file, extra rows are filled as -1
| Pixel properties | Quadrant properties | ||||||
|---|---|---|---|---|---|---|---|
| Quadrant | DetID | PixID | Counts | Sigma | Mean | Median | Sigma |
| A | 0 | 13 | 557670 | 3337.27 | 831 | 814 | 166.9 |
| A | 6 | 16 | 54398 | 321.13 | 831 | 814 | 166.9 |
| A | 13 | 254 | 10825 | 60.0 | 831 | 814 | 166.9 |
| B | 0 | 229 | 47091 | 290.84 | 834 | 815 | 159.1 |
| B | 0 | 190 | 24866 | 151.16 | 834 | 815 | 159.1 |
| B | 12 | 111 | 19386 | 116.72 | 834 | 815 | 159.1 |
| C | 14 | 238 | 128746 | 672.88 | 808 | 813 | 190.1 |
| C | 3 | 233 | 42096 | 217.13 | 808 | 813 | 190.1 |
| C | 2 | 16 | 33422 | 171.51 | 808 | 813 | 190.1 |
| D | 7 | 80 | 2797654 | 15115.28 | 777 | 761 | 185.0 |
| D | 12 | 233 | 126150 | 677.64 | 777 | 761 | 185.0 |
| D | 1 | 52 | 101268 | 543.17 | 777 | 761 | 185.0 |
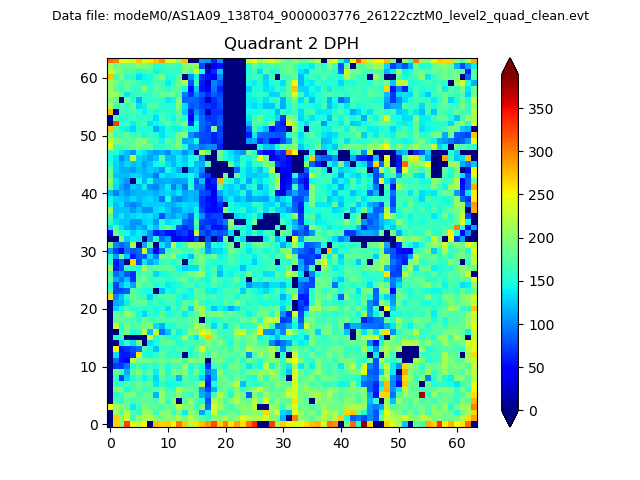
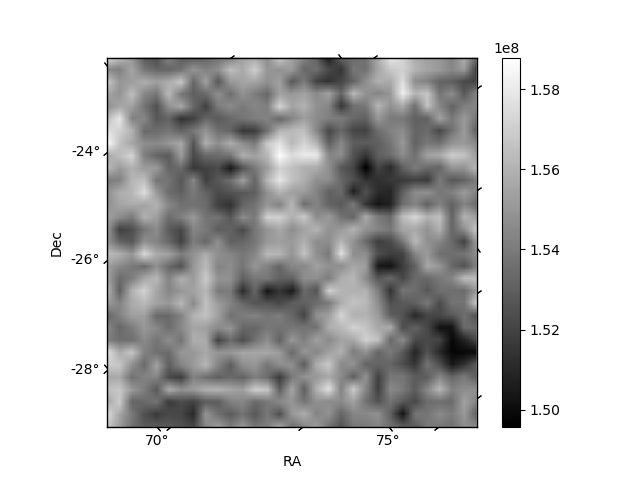
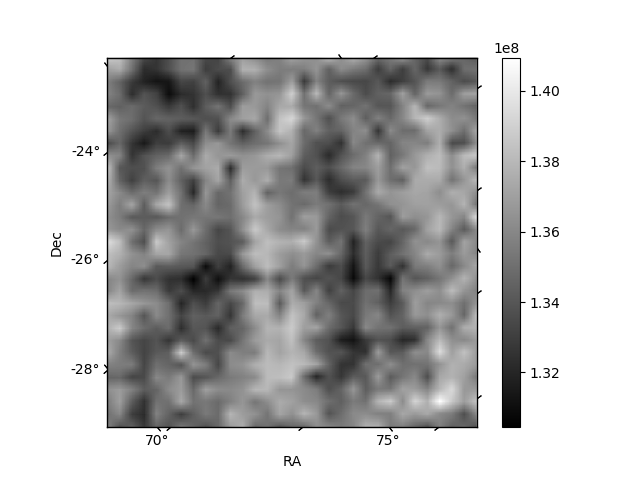
Histogram calculated using DETX and DETY for each event in the final _common_clean file
| Quadrant A | 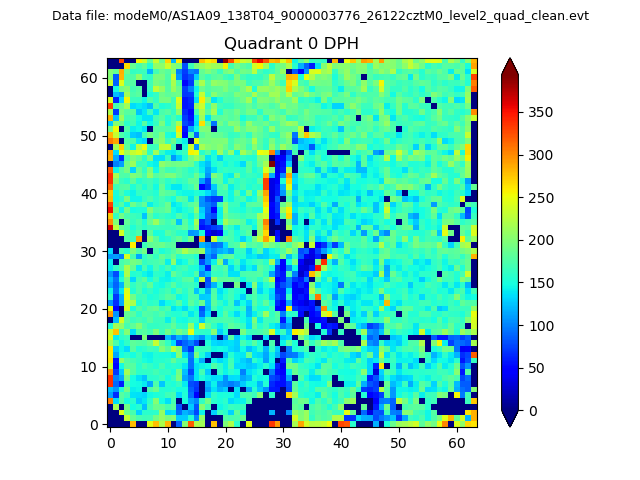 |
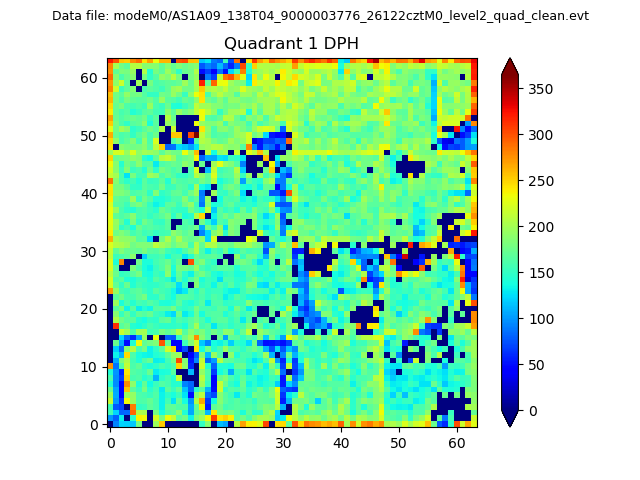 |
Quadrant B |
|---|---|---|---|
| Quadrant D | 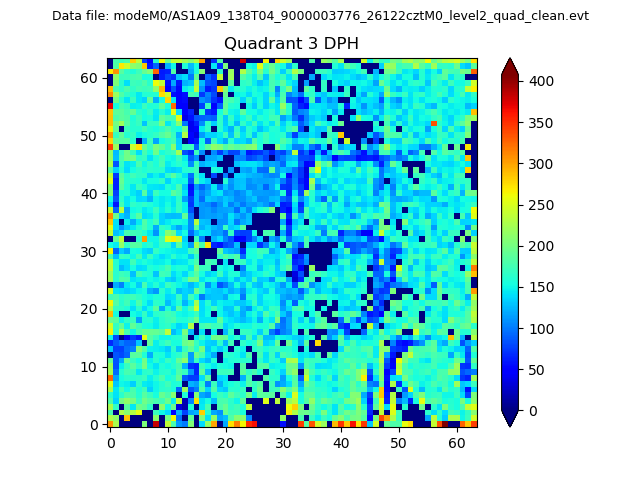 |
 |
Quadrant C |
| Plot type | Count rate plots | Images |
|---|---|---|
| Comparison with Poisson distribution Blue bars denote a histogram of data divided into 1 sec bins. Red curve is a Poisson curve with rate = median count rate of data. |
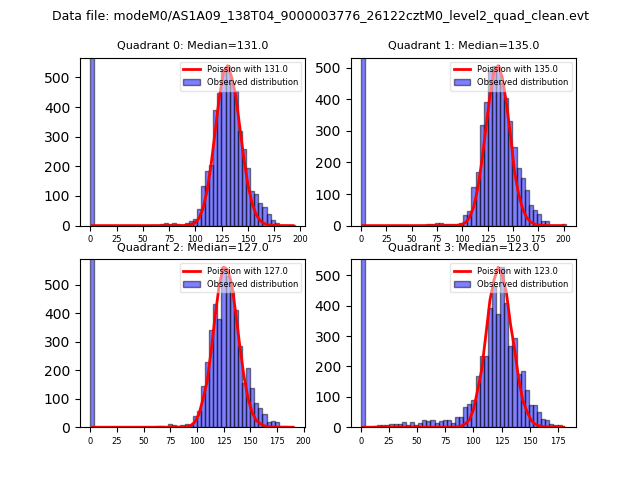 |
 |
| Quadrant-wise count rates Data is divided into 100 sec bins |
 |
|
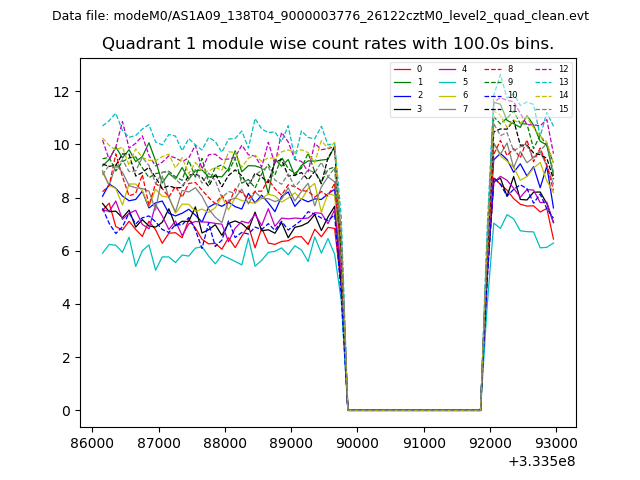
| Module-wise count rates for Quadrant A Data is divided into 100 sec bins |
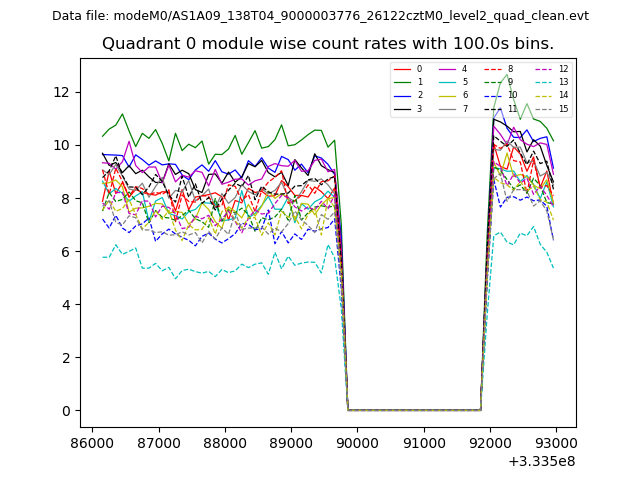 |
 |
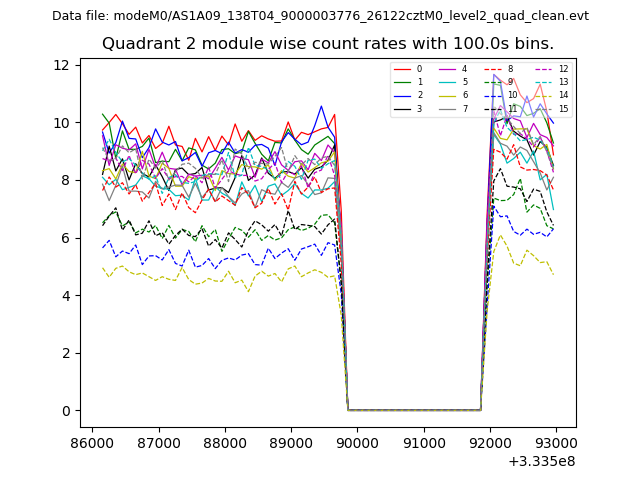
| Module-wise count rates for Quadrant B Data is divided into 100 sec bins |
 |
 |
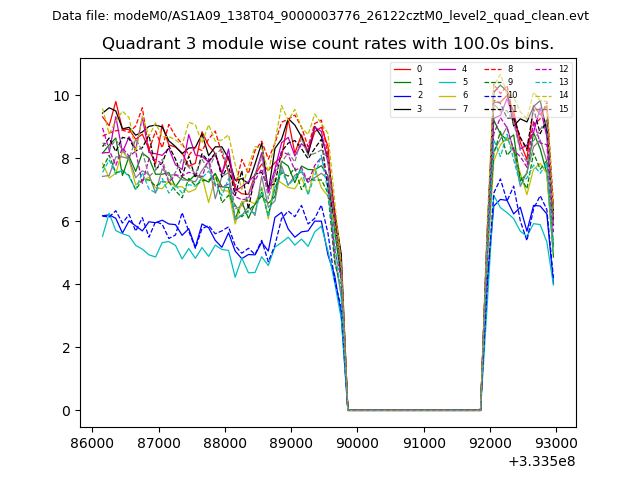
| Module-wise count rates for Quadrant C Data is divided into 100 sec bins |
 |
 |
| Module-wise count rates for Quadrant D Data is divided into 100 sec bins |
 |
 |
| Parameter | Plot |
|---|---|
| CZT HV Monitor |  |
| D_VDD | 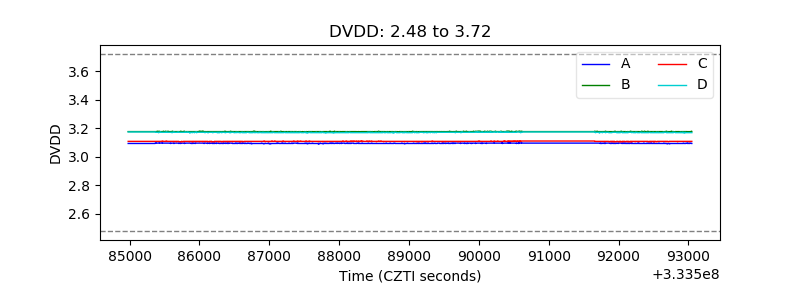 |
| Temperature 1 | 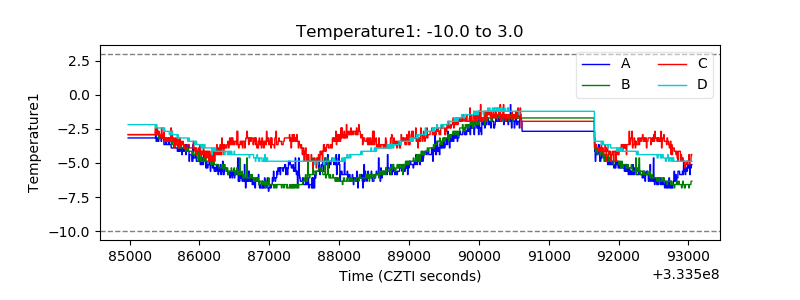 |
| Veto HV Monitor | 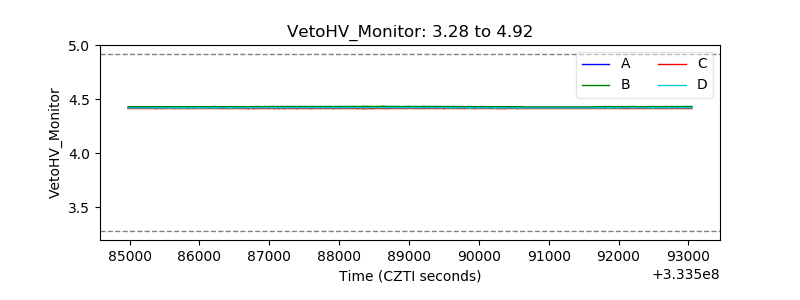 |
| Veto LLD | 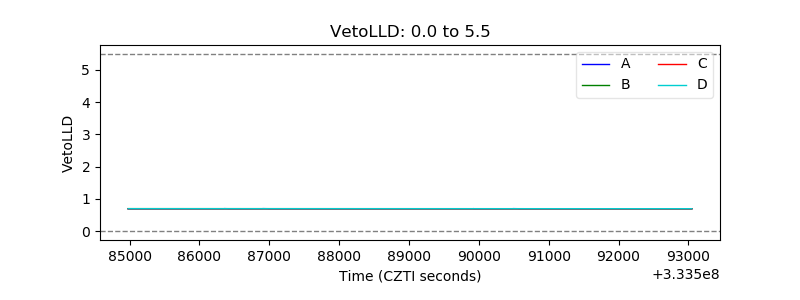 |
| Alpha Counter |  |
| _CPM_Rate | 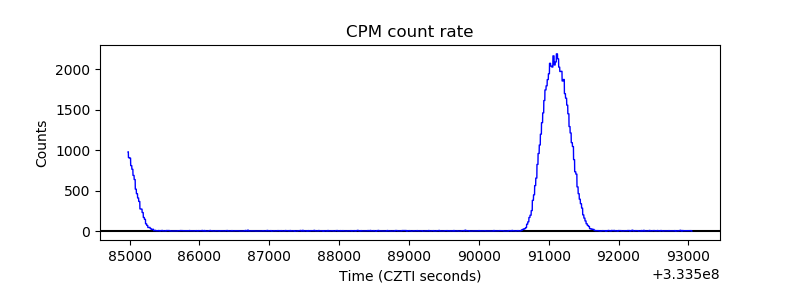 |
| CZT Counter | 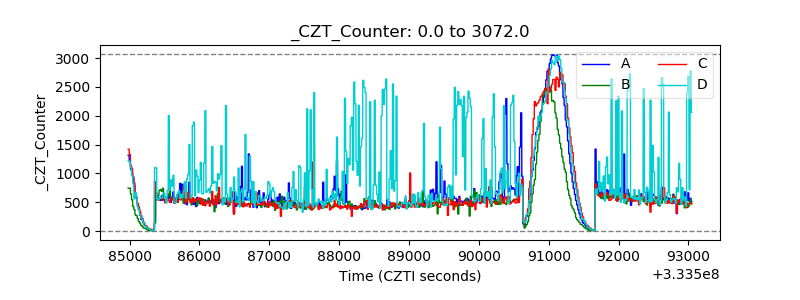 |
| +2.5 Volts monitor |  |
| +5 Volts monitor |  |
| _ROLL_ROT | 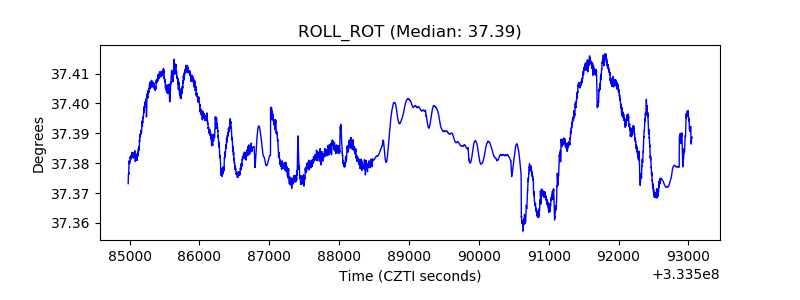 |
| _Roll_DEC | 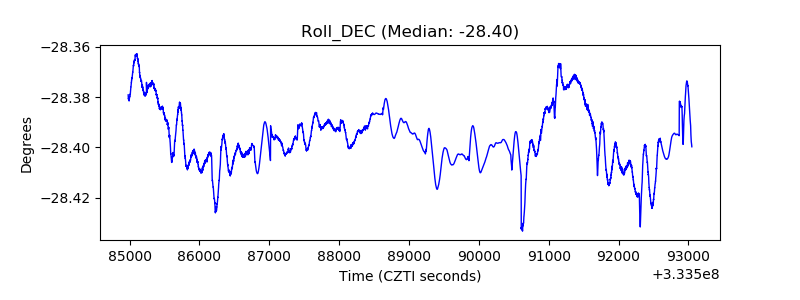 |
| _Roll_RA | 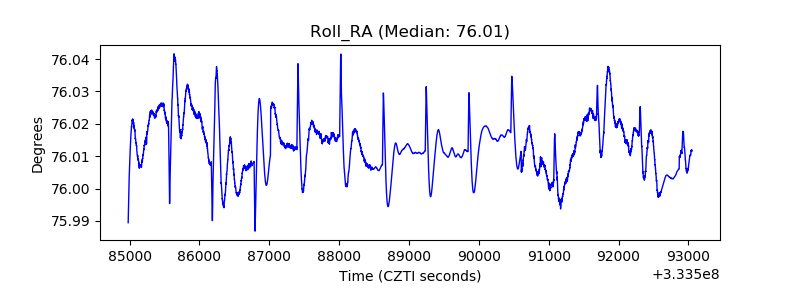 |
| Veto Counter | 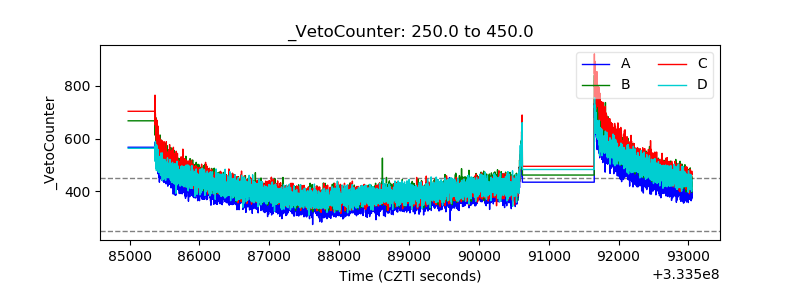 |