| Param | Original file | Final file |
|---|---|---|
| Filename | modeM0/AS1A09_138T04_9000003776_26126cztM0_level2.evt | modeM0/AS1A09_138T04_9000003776_26126cztM0_level2_quad_clean.evt |
| Size (bytes) | 476,599,680 | 113,408,640 |
| Size | 454.5 MB | 108.2 MB |
| Events in quadrant A | 3,508,815 | 746,445 |
| Events in quadrant B | 3,428,562 | 779,677 |
| Events in quadrant C | 3,686,046 | 741,294 |
| Events in quadrant D | 3,389,970 | 734,984 |
| Mode M9 | |||
|---|---|---|---|
| Quadrant | BADHDUFLAG | Total packets | Discarded packets |
| A | 0 | 16 | 0 |
| B | 0 | 17 | 0 |
| C | 0 | 17 | 0 |
| D | 0 | 17 | 0 |
| Mode M0 | |||
|---|---|---|---|
| Quadrant | BADHDUFLAG | Total packets | Discarded packets |
| A | 0 | 14402 | 0 |
| B | 0 | 14022 | 0 |
| C | 0 | 14894 | 0 |
| D | 0 | 13950 | 0 |
| Quadrant | Total seconds | Saturated seconds | Saturation percentage |
|---|---|---|---|
| A | 6197 | 33 | 0.532516% |
| B | 6196 | 50 | 0.806972% |
| C | 6196 | 150 | 2.420917% |
| D | 6196 | 36 | 0.581020% |
Noise dominated data is calculated using 1-second bins in cleaned event files. If a bin has >2000 counts, and if more than 50% of those come from <1% of pixels, then it is considered to be noise-dominated and hence unusable.
| Quadrant | # 1 sec bins | Bins with >0 counts | Bins with >2000 counts | High rate bins dominated by noise | Noise dominated (total time) | Noise dominated (detector-on time) | Marked lightcurve |
|---|---|---|---|---|---|---|---|
| A | 7567 | 6198 | 4 | 4 | 0.05% | 0.06% | 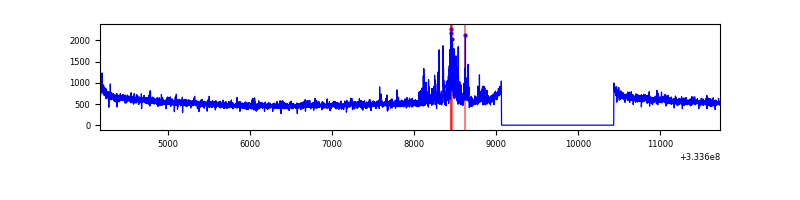 |
| B | 7566 | 6197 | 1 | 1 | 0.01% | 0.02% | 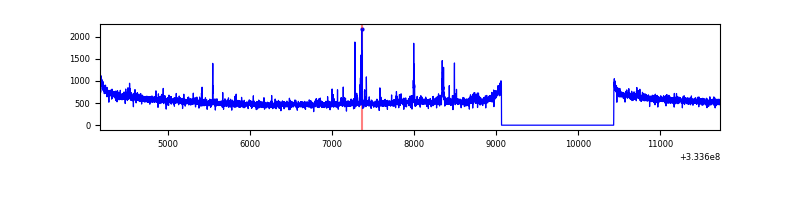 |
| C | 7566 | 6197 | 28 | 28 | 0.37% | 0.45% | 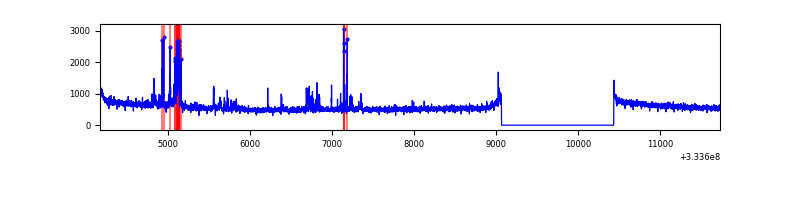 |
| D | 7566 | 6197 | 18 | 18 | 0.24% | 0.29% | 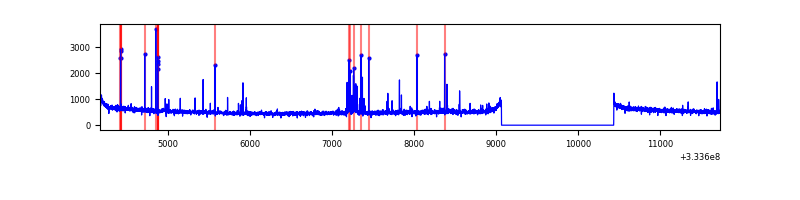 |
Top three noisy pixels from each quadrant. If the there are fewer than three noisy pixels in the level2.evt file, extra rows are filled as -1
| Pixel properties | Quadrant properties | ||||||
|---|---|---|---|---|---|---|---|
| Quadrant | DetID | PixID | Counts | Sigma | Mean | Median | Sigma |
| A | 0 | 13 | 206144 | 1212.57 | 856 | 844 | 169.3 |
| A | 13 | 254 | 8069 | 42.67 | 856 | 844 | 169.3 |
| A | 0 | 226 | 7294 | 38.1 | 856 | 844 | 169.3 |
| B | 0 | 190 | 33162 | 203.77 | 858 | 841 | 158.6 |
| B | 0 | 229 | 21751 | 131.83 | 858 | 841 | 158.6 |
| B | 12 | 111 | 18227 | 109.61 | 858 | 841 | 158.6 |
| C | 3 | 233 | 140542 | 715.6 | 843 | 851 | 195.2 |
| C | 14 | 238 | 137026 | 697.59 | 843 | 851 | 195.2 |
| C | 2 | 16 | 119487 | 607.74 | 843 | 851 | 195.2 |
| D | 12 | 233 | 86424 | 422.93 | 855 | 838 | 202.4 |
| D | 1 | 52 | 57518 | 280.09 | 855 | 838 | 202.4 |
| D | 2 | 234 | 23168 | 110.35 | 855 | 838 | 202.4 |
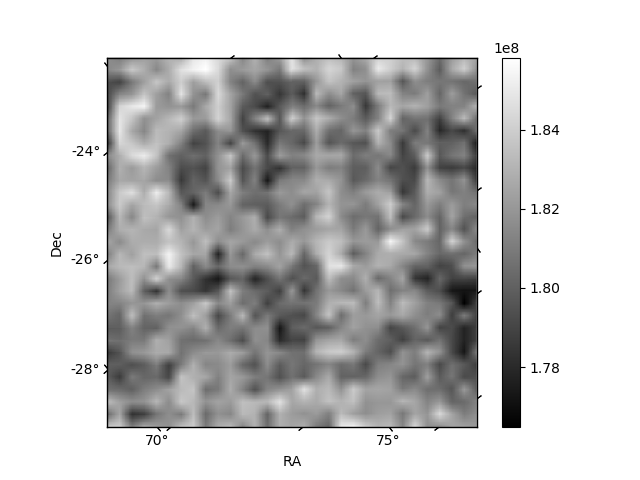
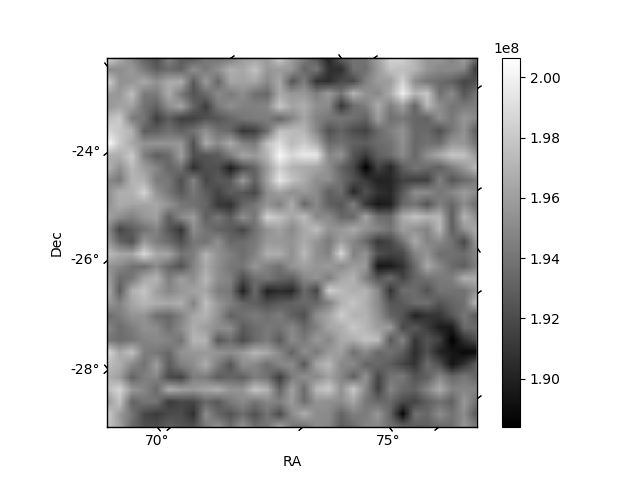
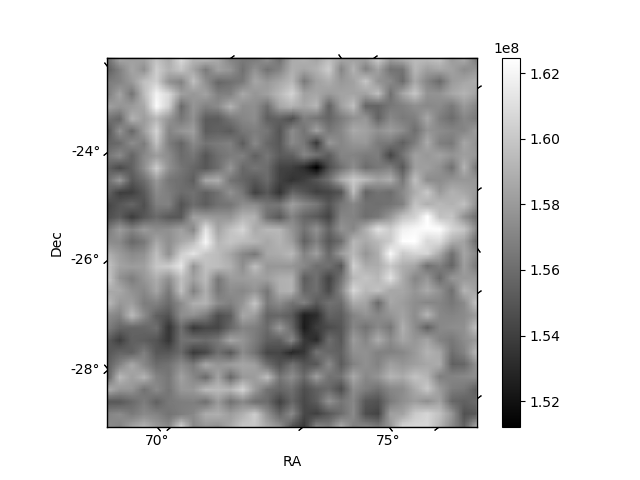
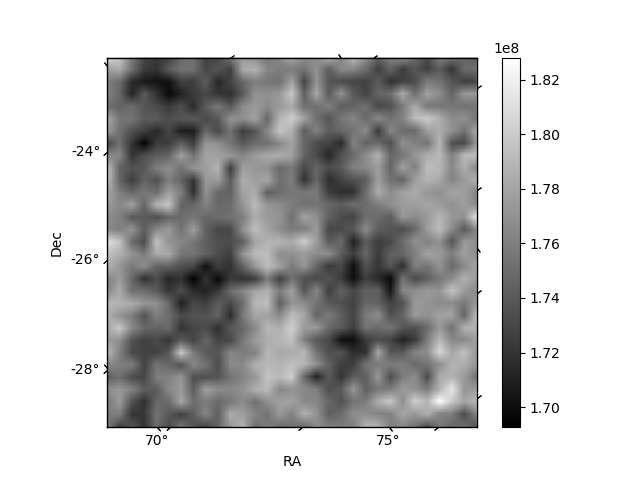
Histogram calculated using DETX and DETY for each event in the final _common_clean file
| Quadrant A |  |
 |
Quadrant B |
|---|---|---|---|
| Quadrant D |  |
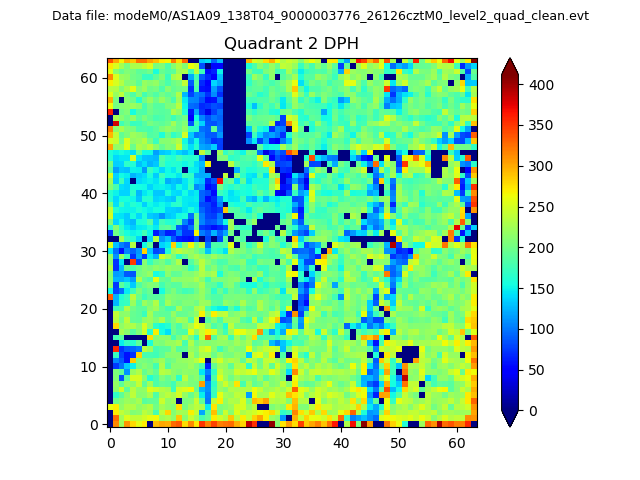 |
Quadrant C |
| Plot type | Count rate plots | Images |
|---|---|---|
| Comparison with Poisson distribution Blue bars denote a histogram of data divided into 1 sec bins. Red curve is a Poisson curve with rate = median count rate of data. |
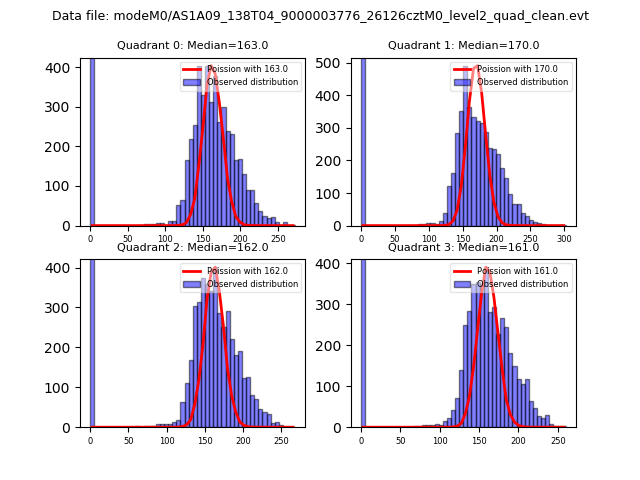 |
 |
| Quadrant-wise count rates Data is divided into 100 sec bins |
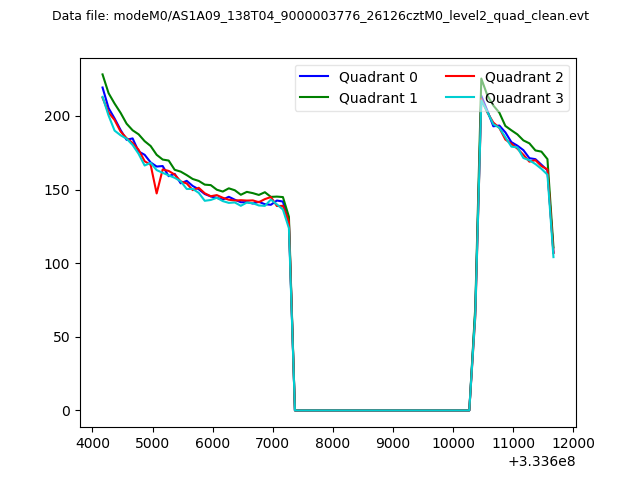 |
|
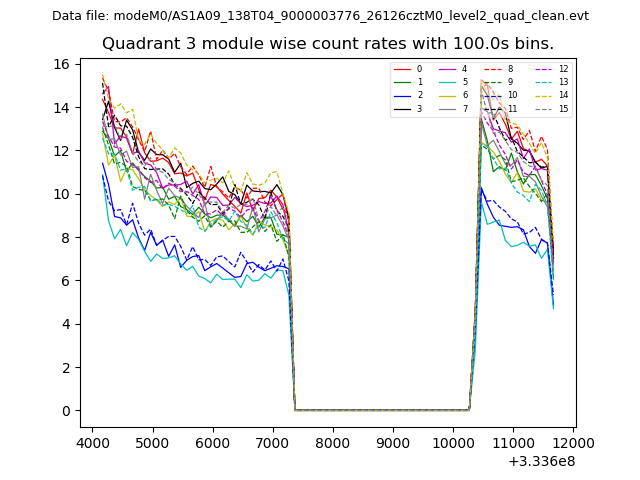
| Module-wise count rates for Quadrant A Data is divided into 100 sec bins |
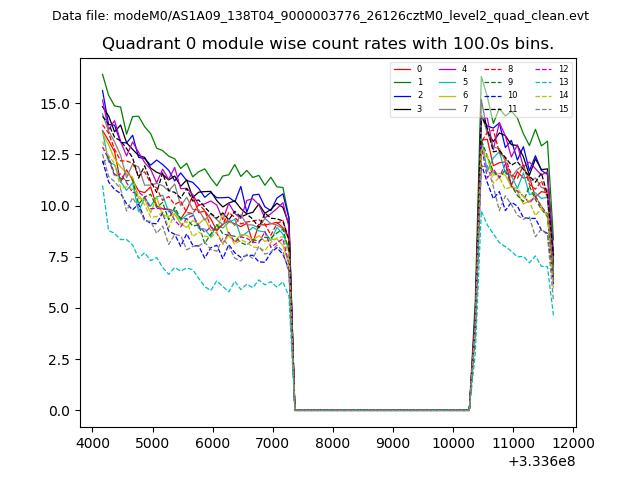 |
 |
| Module-wise count rates for Quadrant B Data is divided into 100 sec bins |
 |
 |
| Module-wise count rates for Quadrant C Data is divided into 100 sec bins |
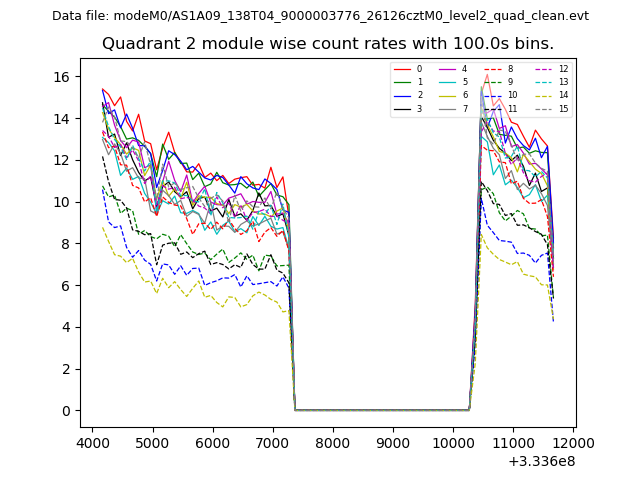 |
 |
| Module-wise count rates for Quadrant D Data is divided into 100 sec bins |
 |
 |
| Parameter | Plot |
|---|---|
| CZT HV Monitor |  |
| D_VDD | 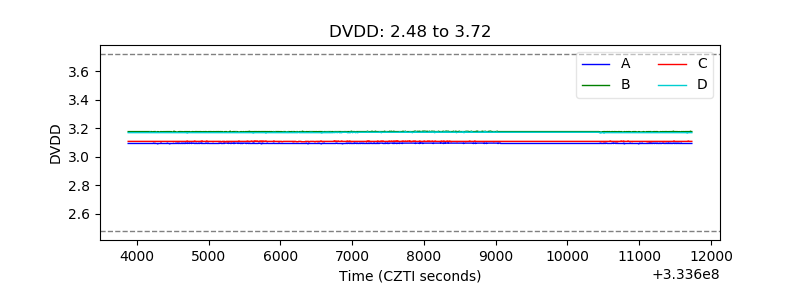 |
| Temperature 1 | 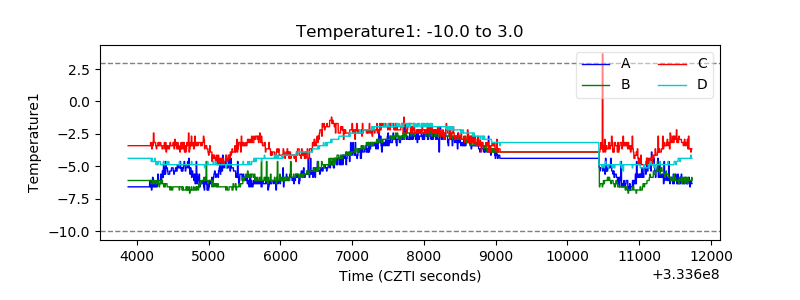 |
| Veto HV Monitor | 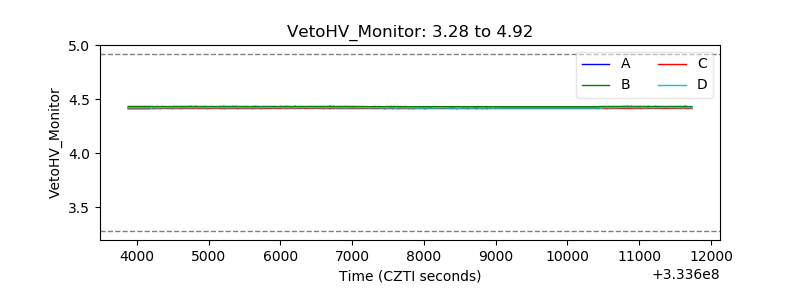 |
| Veto LLD | 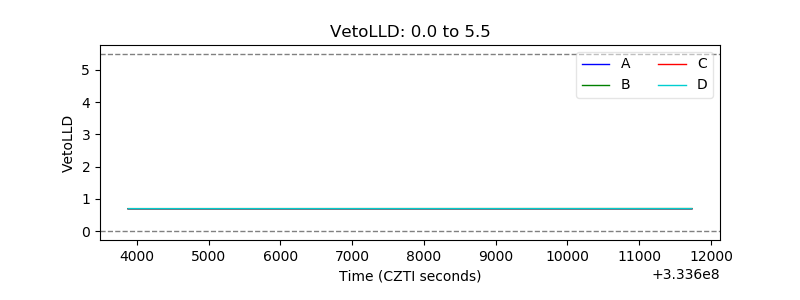 |
| Alpha Counter | 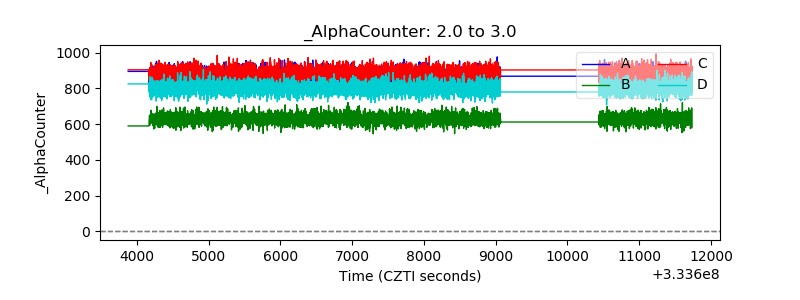 |
| _CPM_Rate | 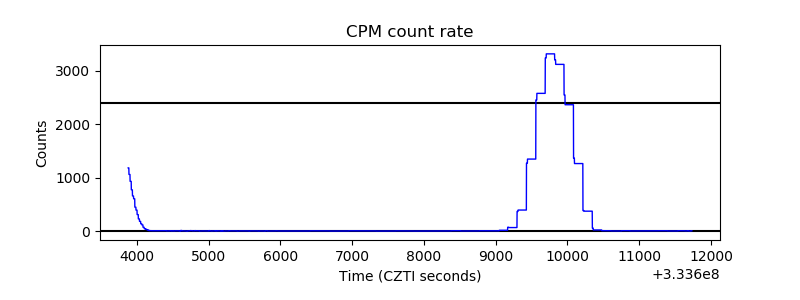 |
| CZT Counter | 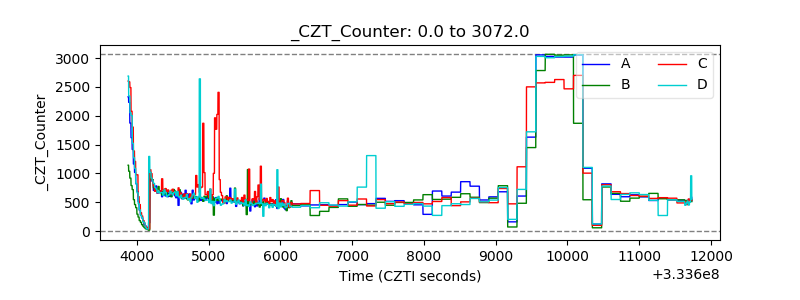 |
| +2.5 Volts monitor |  |
| +5 Volts monitor | 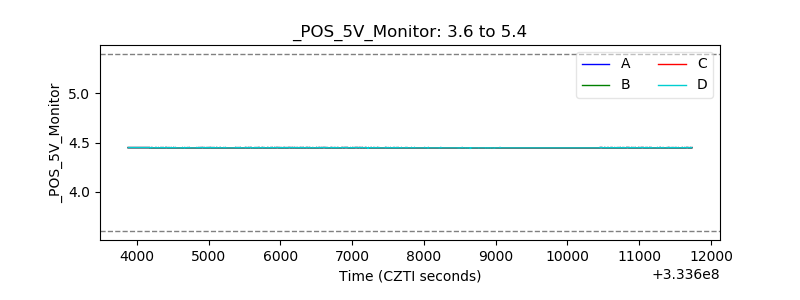 |
| _ROLL_ROT | 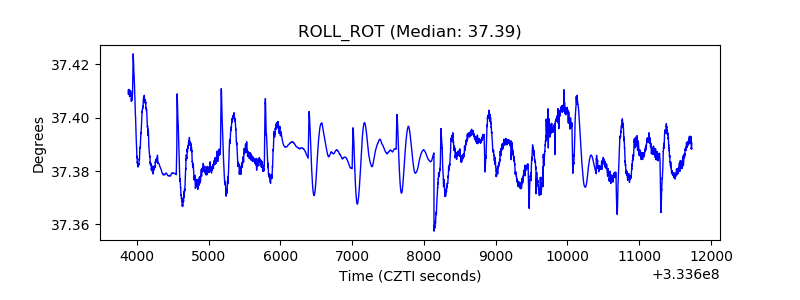 |
| _Roll_DEC | 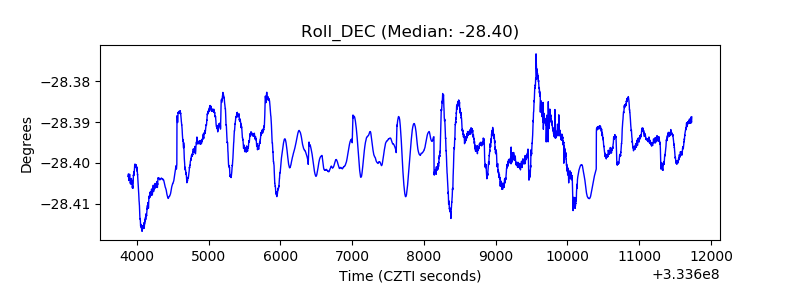 |
| _Roll_RA | 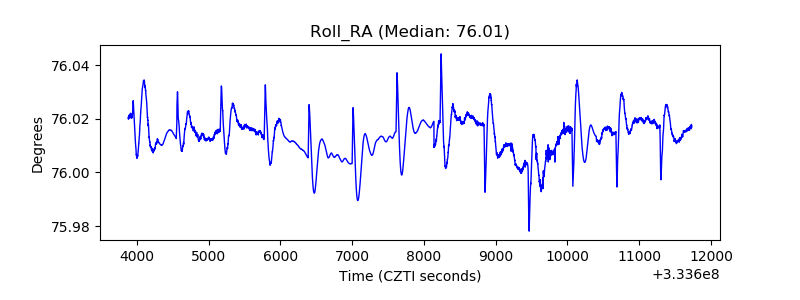 |
| Veto Counter | 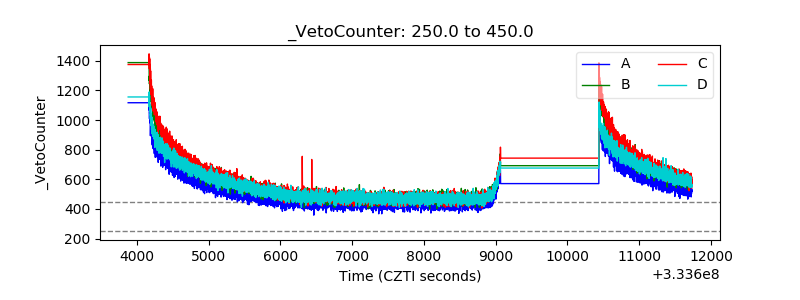 |