| Param | Original file | Final file |
|---|---|---|
| Filename | modeM0/AS1A09_138T04_9000003776_26127cztM0_level2.evt | modeM0/AS1A09_138T04_9000003776_26127cztM0_level2_quad_clean.evt |
| Size (bytes) | 77,584,320 | 25,830,720 |
| Size | 74.0 MB | 24.6 MB |
| Events in quadrant A | 565,254 | 174,330 |
| Events in quadrant B | 559,414 | 180,531 |
| Events in quadrant C | 602,917 | 173,716 |
| Events in quadrant D | 543,958 | 169,304 |
| Mode M9 | |||
|---|---|---|---|
| Quadrant | BADHDUFLAG | Total packets | Discarded packets |
| A | 1 | 139933181872936 | 46 |
| B | 1 | -1 | -1 |
| C | 1 | -1 | -1 |
| D | 1 | -1 | -1 |
| Mode M0 | |||
|---|---|---|---|
| Quadrant | BADHDUFLAG | Total packets | Discarded packets |
| A | 0 | 2297 | 0 |
| B | 0 | 2282 | 0 |
| C | 0 | 2429 | 0 |
| D | 0 | 2238 | 0 |
| Quadrant | Total seconds | Saturated seconds | Saturation percentage |
|---|---|---|---|
| A | 1038 | 0 | 0.000000% |
| B | 1032 | 0 | 0.000000% |
| C | 1041 | 13 | 1.248799% |
| D | 1025 | 0 | 0.000000% |
Noise dominated data is calculated using 1-second bins in cleaned event files. If a bin has >2000 counts, and if more than 50% of those come from <1% of pixels, then it is considered to be noise-dominated and hence unusable.
| Quadrant | # 1 sec bins | Bins with >0 counts | Bins with >2000 counts | High rate bins dominated by noise | Noise dominated (total time) | Noise dominated (detector-on time) | Marked lightcurve |
|---|---|---|---|---|---|---|---|
| A | 7915 | 1324 | 0 | 0 | 0.00% | 0.00% | 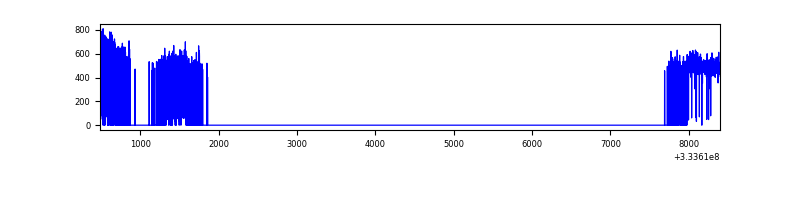 |
| B | 7915 | 1326 | 0 | 0 | 0.00% | 0.00% | 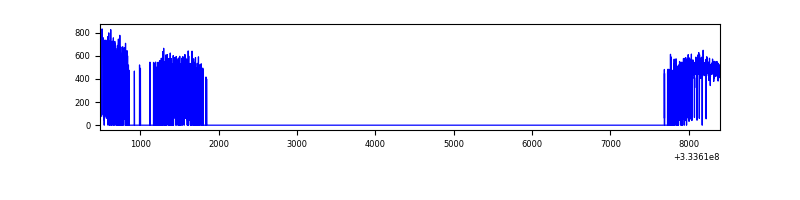 |
| C | 7915 | 1354 | 0 | 0 | 0.00% | 0.00% | 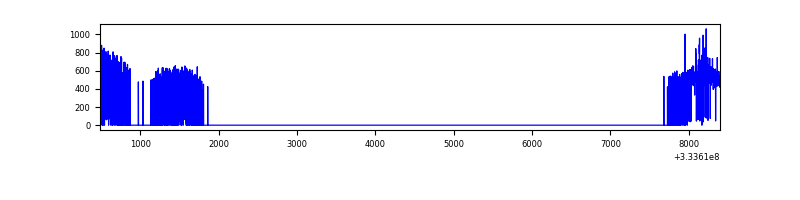 |
| D | 7915 | 1319 | 0 | 0 | 0.00% | 0.00% | 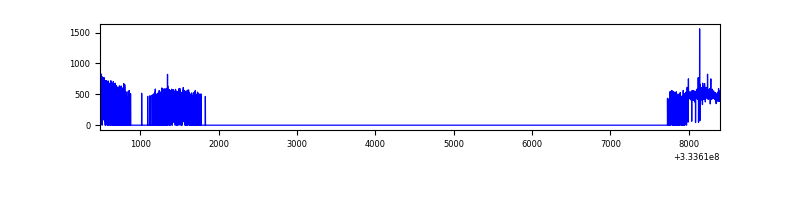 |
Top three noisy pixels from each quadrant. If the there are fewer than three noisy pixels in the level2.evt file, extra rows are filled as -1
| Pixel properties | Quadrant properties | ||||||
|---|---|---|---|---|---|---|---|
| Quadrant | DetID | PixID | Counts | Sigma | Mean | Median | Sigma |
| A | 0 | 13 | 10281 | 334.56 | 143 | 142 | 30.3 |
| A | 13 | 254 | 1399 | 41.48 | 143 | 142 | 30.3 |
| A | 6 | 16 | 1349 | 39.83 | 143 | 142 | 30.3 |
| B | 12 | 111 | 2926 | 97.7 | 143 | 139 | 28.5 |
| B | 11 | 111 | 2727 | 90.72 | 143 | 139 | 28.5 |
| B | 14 | 111 | 2512 | 83.18 | 143 | 139 | 28.5 |
| C | 14 | 238 | 23623 | 671.38 | 142 | 144 | 35.0 |
| C | 3 | 233 | 15518 | 439.62 | 142 | 144 | 35.0 |
| C | 2 | 16 | 7327 | 205.4 | 142 | 144 | 35.0 |
| D | 12 | 233 | 7823 | 221.94 | 141 | 137 | 34.6 |
| D | 2 | 234 | 3543 | 98.35 | 141 | 137 | 34.6 |
| D | 1 | 52 | 2985 | 82.24 | 141 | 137 | 34.6 |
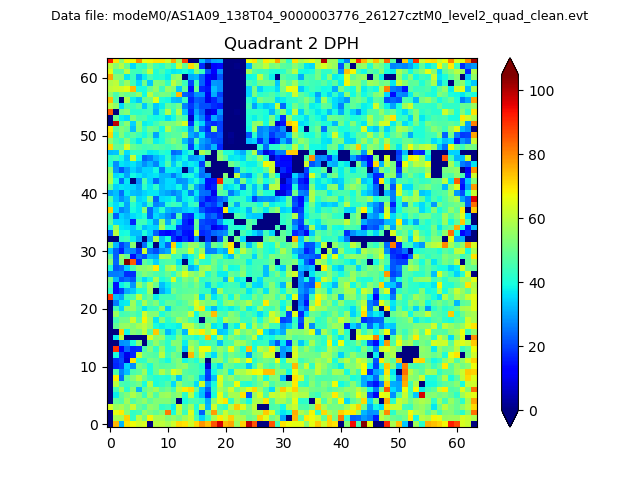
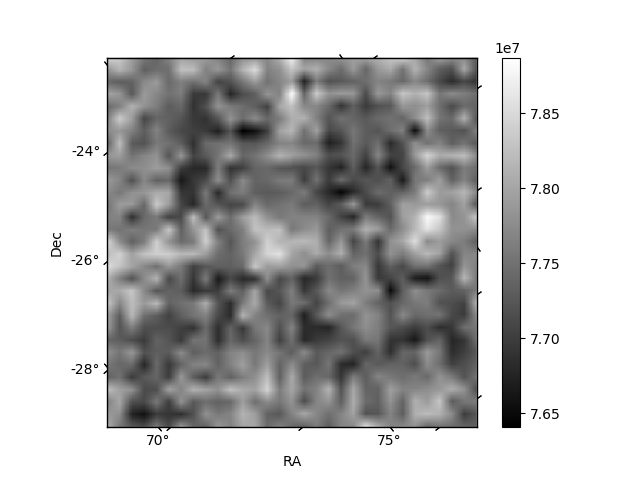
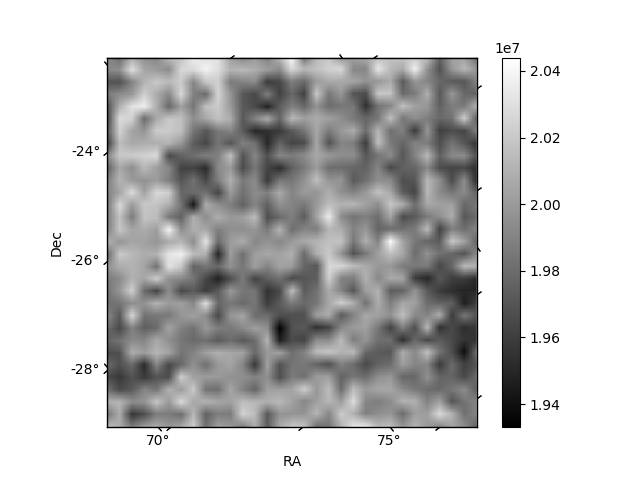
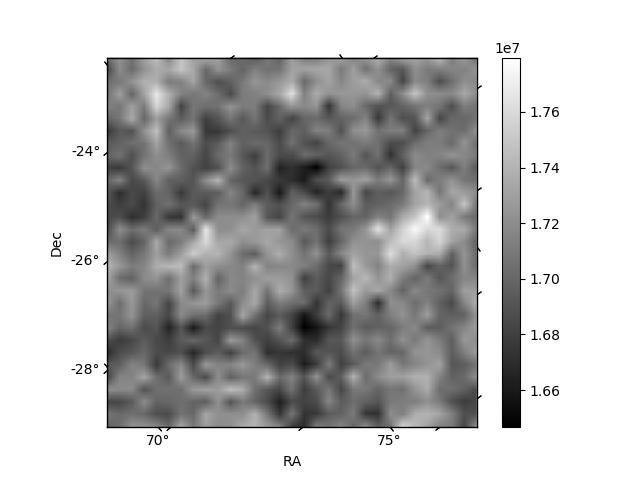
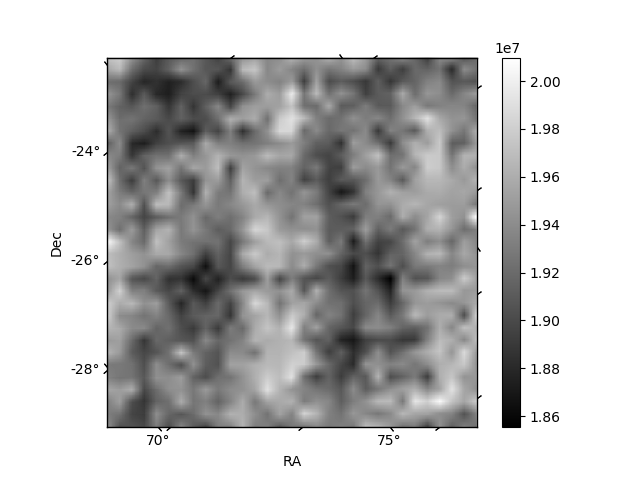
Histogram calculated using DETX and DETY for each event in the final _common_clean file
| Quadrant A | 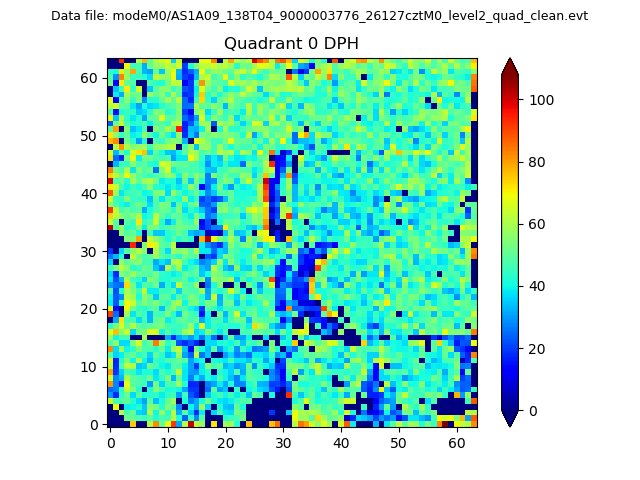 |
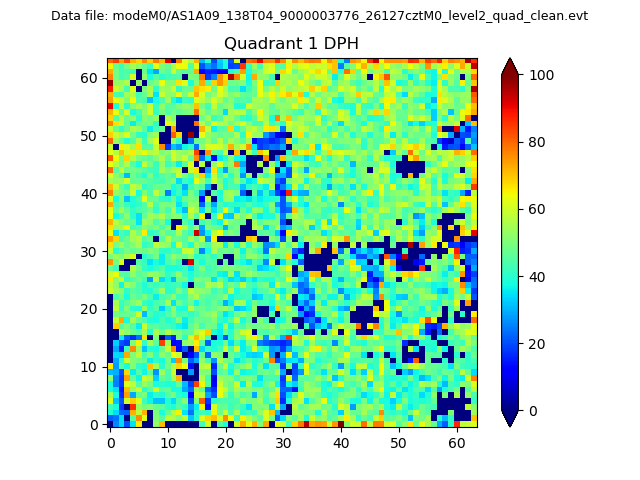 |
Quadrant B |
|---|---|---|---|
| Quadrant D | 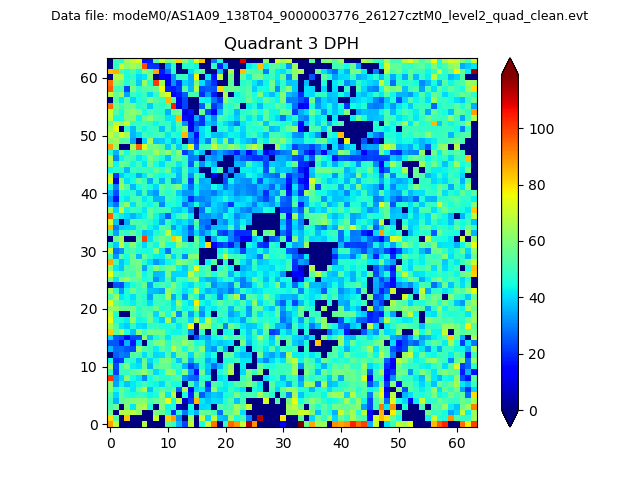 |
 |
Quadrant C |
| Plot type | Count rate plots | Images |
|---|---|---|
| Comparison with Poisson distribution Blue bars denote a histogram of data divided into 1 sec bins. Red curve is a Poisson curve with rate = median count rate of data. |
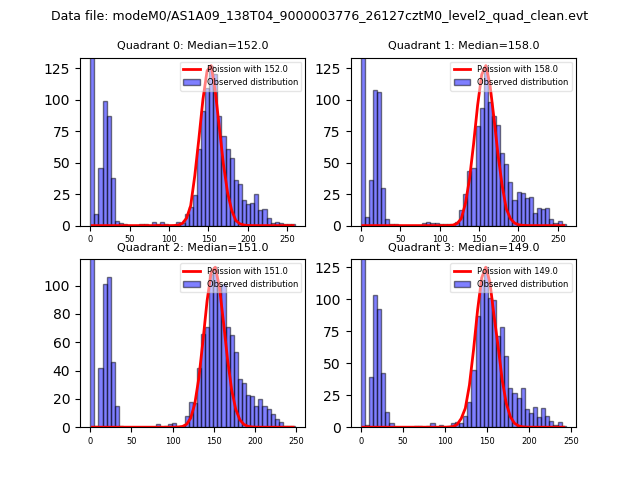 |
 |
| Quadrant-wise count rates Data is divided into 100 sec bins |
 |
|
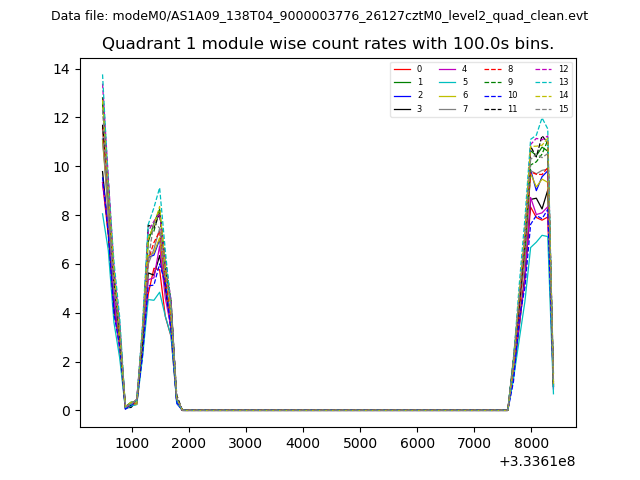
| Module-wise count rates for Quadrant A Data is divided into 100 sec bins |
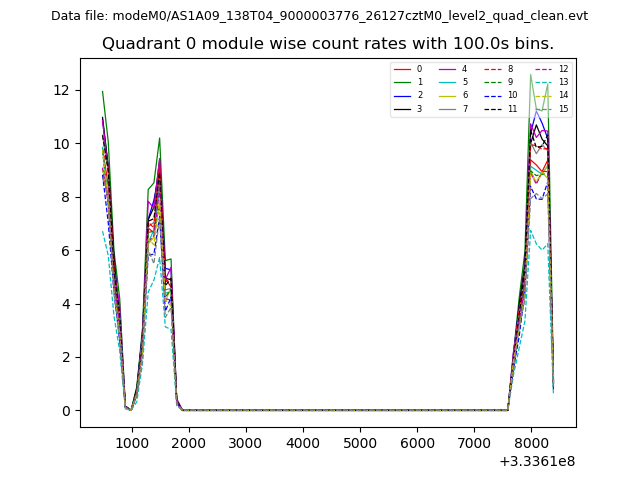 |
 |
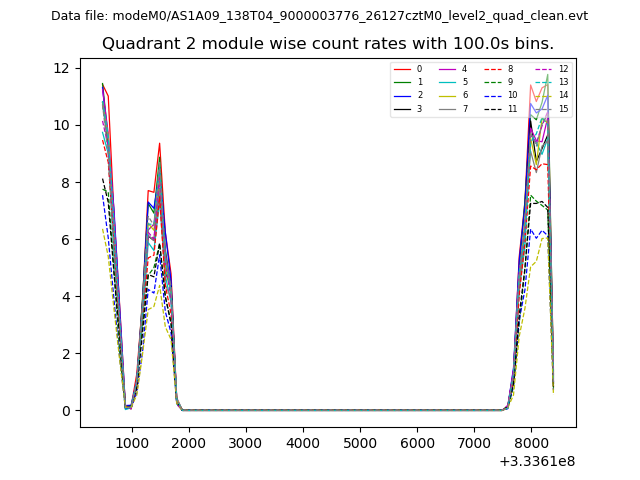
| Module-wise count rates for Quadrant B Data is divided into 100 sec bins |
 |
 |
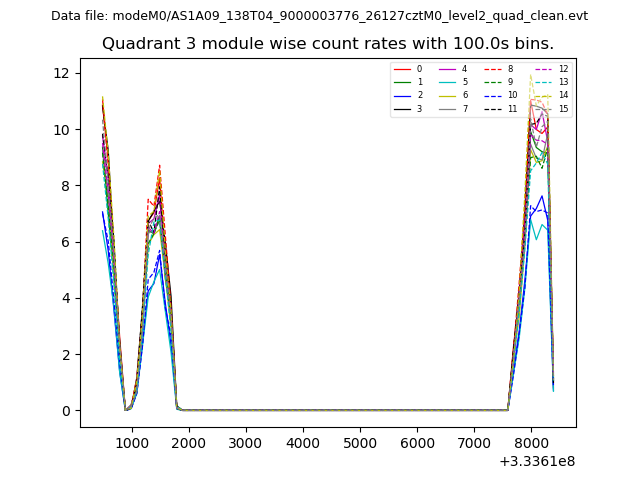
| Module-wise count rates for Quadrant C Data is divided into 100 sec bins |
 |
 |
| Module-wise count rates for Quadrant D Data is divided into 100 sec bins |
 |
 |
| Parameter | Plot |
|---|---|
| CZT HV Monitor | 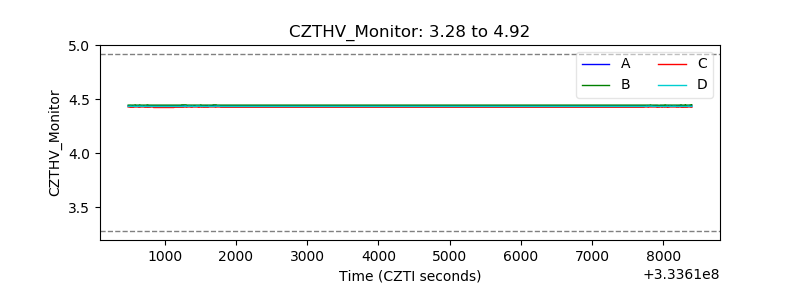 |
| D_VDD | 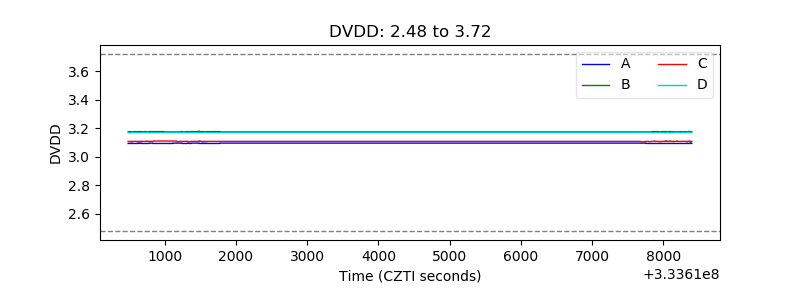 |
| Temperature 1 | 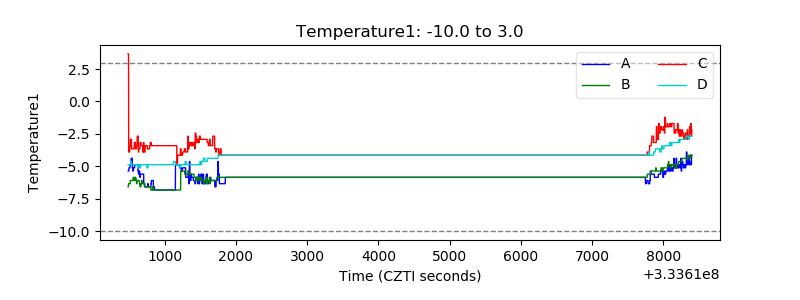 |
| Veto HV Monitor | 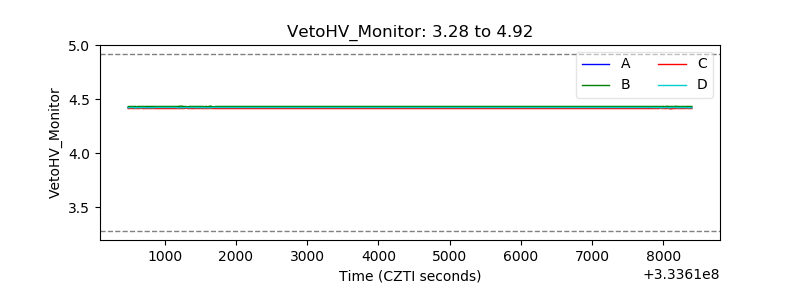 |
| Veto LLD | 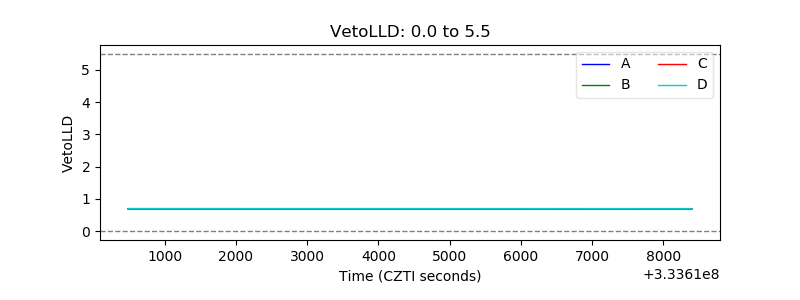 |
| Alpha Counter | 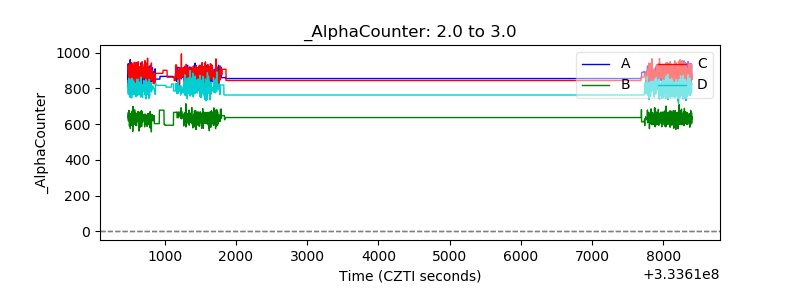 |
| _CPM_Rate |  |
| CZT Counter | 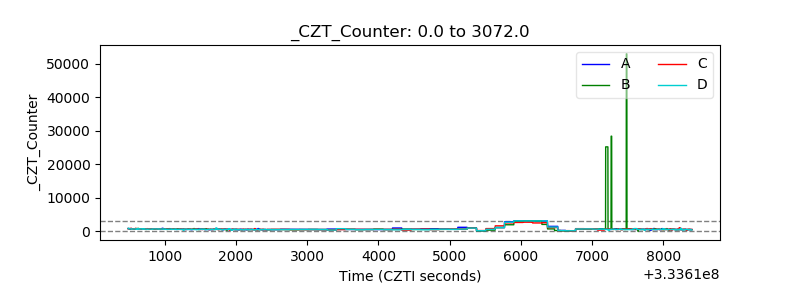 |
| +2.5 Volts monitor |  |
| +5 Volts monitor |  |
| _ROLL_ROT | 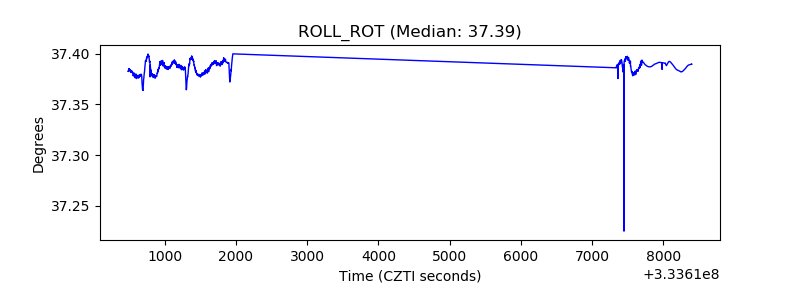 |
| _Roll_DEC | 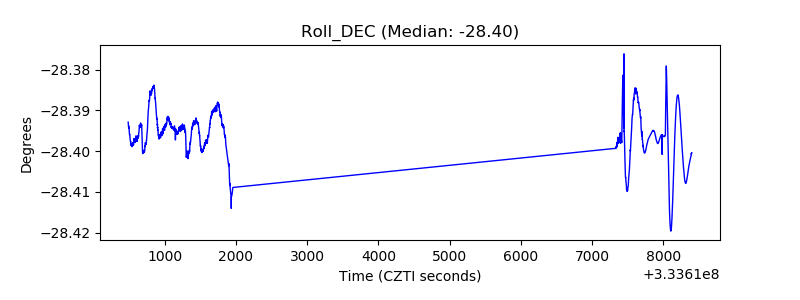 |
| _Roll_RA | 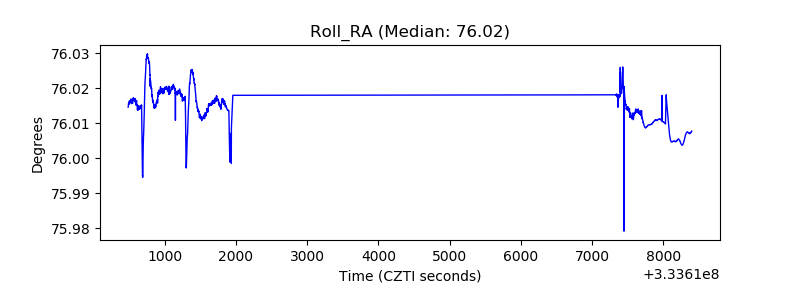 |
| Veto Counter | 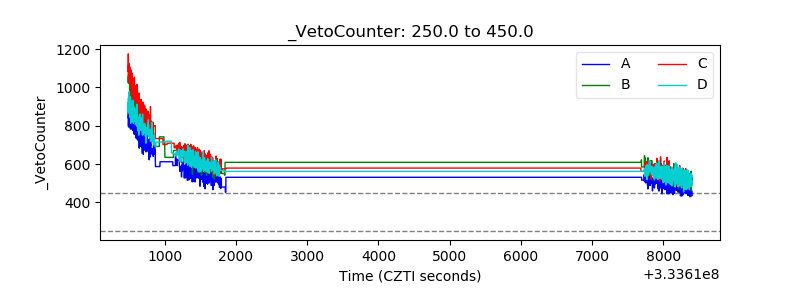 |